

ABSTRACT
Background
Lifestyle change treatments for weight loss produce medically meaningful weight reductions, but lost weight is usually regained. Meal replacements (MRs) represent one avenue for improving long-term weight loss. Another, nutrition-focused approach involves having participants make specific changes in the energy density, composition, and structure of the foods in their personal food environments.
Objective
Three conditions were compared: behavior therapy (BT), BT plus MRs (BT+MR), and a nutrition-focused treatment aimed at modifying the home food environment (HFE).
Design
Overweight and obese individuals (n = 262) were randomly assigned to 1 of the 3 conditions. Treatment occurred in weekly groups for 6 mo and in biweekly groups for 6 mo. Assessments were conducted at baseline and at 6, 12, 18, 24, and 36 mo. Multilevel models were used to estimate weight-change trajectories for each participant and to examine the treatment group effect on long-term weight loss.
Results
A multilevel analysis indicated that all 3 groups showed significant weight loss over 12 mo that was gradually regained to the 36-mo follow-up. Mean ± SD percentages of baseline weight loss at 12 mo for BT, BT+MR, and HFE were 9.41% ± 7.92%, 10.37% ± 7.77%, and 10.97% ± 7.79%, respectively. Comparable percentages at 36 mo were 4.21% ± 8.64%, 3.06% ± 6.93%, and 4.49% ± 7.83%. Those in the HFE condition lost more weight than those receiving BT through the 36-mo assessment (P < 0.01), as reflected in 2 treatment × time interactions. Further analyses showed that HFE produced the largest increases in cognitive restraint and that this increase largely mediated the HFE group's improved weight loss.
Conclusion
The nutrition-focused intervention studied here produced modestly greater long-term weight loss than BT, an effect that was largely explainable by an unexpected boost in cognitive restraint in this condition. This study was registered at clinicaltrials.gov as NCT01065974.
Keywords: obesity, treatment, behavior therapy, meal replacements, nutritional intervention, nutritional treatment, weight loss, diet, home food environment
INTRODUCTION
A challenge for the behavioral treatment of obesity is achieving durable improvements in various self-control skills. This goal should be furthered by making individuals’ food environments more compatible with long-term weight loss. Meal replacements (MRs) represent one way of furthering this goal. MRs are portion- and calorie-controlled meals that show improved initial weight loss and weight-loss maintenance (1, 2). A second approach focuses on making numerous qualitative and quantitative modifications to nutritional intake. Studies have found support for reducing the energy density (ED) of the diet and manipulating the glycemic index and the protein content of the diet to increase weight loss (3–5).
We conducted 2 studies aimed at creating durable improvements in nutritional intake to support weight-loss maintenance. The first study found that a reduced-ED diet did in fact produce significantly greater reductions in the ED of the diet but did not improve weight loss at an 18-mo follow-up (6). In a second study, we found a significant interaction between the presence or absence of MRs and the presence or absence of a reduced-ED program on long-term weight loss over a 2-y follow-up period (7). The most successful of the 4 conditions, the diet with reduced ED but no MRs, maintained virtually all of their weight losses 2 y after the end of treatment.
The first goal of this study was to compare the addition of MRs during treatment and follow-up with behavior therapy (BT) (8). The second was to test a more comprehensive version of the nutritional intervention referenced above to improve the durability of weight loss. This expanded intervention, referred to as the Home Food Environment (HFE) intervention, had 2 major components. First, beyond a focus on reducing ED, it added nutritional change components that have shown promise for promoting weight loss, including the use of pre-portioned foods (7, 9) (although MRs were not prescribed), increased protein (10) and fiber (11) intake to promote satiety, removal of highly tempting foods from the home (12), and decreasing or increasing the variety of high- or low-calorie foods, respectively (13). Many of these recommendations reflect those made in the Volumetrics eating plan (14) and overlap with stimulus control recommendations (1) and choice architecture approaches (15). Second, most of the group session content was devoted to providing the rationale for our nutrition-focused approach and training participants to make specific, agreed-upon changes to the foods, ingredients, and preparation methods and portioning techniques each week during most of the program. BT programs, by contrast, provide similar nutritional advice but spend much more group session time teaching problem-solving to improve behavioral and emotional self-control skills.
This single-factor study compared the ability of BT plus MRs (BT+MR) and the HFE intervention to improve long-term weight loss relative to standard BT. Conditions were also compared on ancillary measures to see if the removal of self-control components from the HFE condition (relative to BT) had any untoward effects on auxiliary outcomes.
METHODS
All of the participants were recruited from the community and treated at Drexel University and the University of Pennsylvania. During recruitment, participants were screened over the phone, attended a study orientation, and completed an in-person screening visit. Simple randomization via a table of random numbers was used to evenly assign participants to 1 of 3 conditions: BT, BT+MR, or the novel treatment, HFE. (The numbers 1–3, 4–6, and 7–9 were used to assign participants to 1 of the 3 conditions.) All 3 treatments lasted for 1 y. Participants attended 3 follow-up assessments over the next 2 y. Assessments took place at month 0 (baseline), month 6 (midtreatment), month 12 (end of treatment), month 18 (6-mo follow-up), month 24 (12-mo follow-up), and month 36 (24-mo follow-up). All study visits took place between January 2010 and December 2014. The study was registered at clinicaltrials.gov (NCT01065974). The study protocol was approved by the university's institutional review board (approval 11090000194).
Study sample
Inclusion criteria for the study were as follows: men and women between the ages of 18 and 65 y, with a BMI (kg/m2) between 27 and 45, able to travel regularly to the study location, and interested in participating in a weight-loss program. Exclusion criteria for the study were as follows: currently enrolled in another organized weight-loss program, lactose intolerance, taking medications that affect appetite (unless dosage had been stable for at least the previous 6 mo), history of gastric bypass or other surgical weight-loss procedures, medical conditions (e.g., cancer, substance abuse, psychotic disorders) that could limit participants’ ability to comply with the behavioral recommendations or pose a risk to the participant during weight loss, pregnancy or planning to become pregnant during the next 2 y, breastfeeding, and consuming an amount of alcohol that could interfere with study completion.
Participants were recruited and completed the intervention in 4 separate waves over the course of 3 y (2010–2012), with follow-up visits completed in 2015. Recruitment took place in the greater Philadelphia area through radio, newspaper, and online advertisements, brochures, flyers, and e-mails.
Intervention
All of the enrolled participants were randomly assigned to 1 of the 3 treatment conditions. Basic information about all 3 conditions was provided at the initial study orientation, but participants were not otherwise informed about the details of treatment in conditions to which they were not assigned. All of the group sessions were 75 min in length, and group leaders in all conditions spent the same amount of time with participants.
The BT treatment is considered the current “gold standard” for achieving medically meaningful weight losses in obese individuals (1). This condition used materials from the Lifestyle, Exercise, Attitudes, Relationships, and Nutrition (LEARN) manual and the Diabetes Prevention Program (16, 17). The BT+MR treatment added an MR component to this standard treatment (18, 19). Participants were instructed to consume 2 MRs/d during the first 6 mo of the study (breakfast and lunch were recommended) and to switch to 1 MR and 1 snack replacement between 6 and 12 mo. To facilitate adherence, all MRs and snack replacements (SlimFast) were provided by the study at no cost to the participant during the treatment year.
The HFE condition consisted of several components. First, weight loss was instigated in the usual way—that is, by identifying a caloric goal, discussing various means of reducing caloric intake, and beginning self-monitoring of food intake to keep track of food consumed and identify sources of problematic food intake. Second, parts of the first 8 wk of treatment were spent providing the rationale behind the HFE treatment: that a combination of personal vulnerability to weight gain and regain, the limitations of self-control skills for long-term weight management, and the temptations inherent in the obesogenic environment underlies the strong emphasis of HFE on making numerous changes to participants’ personal food environments (2). Third, an overview was provided on research findings on the effects on eating and weight control of the ready availability of highly tempting, hyperpalatable foods in the home; the ED of available foods (including the recommendation to start meals with a low-ED food); food portioning; increasing the protein and fiber contents of foods; and increasing the variety of low-ED foods and decreasing the variety of high-ED foods. Fourth, there were weekly homework assignments wherein participants identified specific foods and food ingredients whose modification or removal would further ≥1 of the aforementioned goals of reducing energy intake while maintaining the volume of food that participants were accustomed to consuming, with the goal of lowering daily caloric intake by ≥300 calories/d to support maintenance of lost weight. Foods targeted for modification were identified through group exercises, participants’ self-monitoring forms, and by having participants bring to the group session their grocery store receipts. Group leaders repeatedly explained that the goal of the HFE program was to maintain the tastefulness of foods as much as possible while moderating the ED of selected foods and meals and increasing the consumption of lower-ED foods. There was extensive discussion of how HFE principles could be extended to foods eaten outside of the home. However, the emphasis was placed on making sufficient changes to foods in participants’ personal food environments so that they did not need to depend as much on maintaining a consistently high level of eating self-control to maximize weight loss and avoid weight regain (2).
Treatment sessions, which lasted 1 y, were led by a group leader and co-leader. Treatment focused on weight loss for months 1–6 and gradually shifted to prevention of weight regain during months 7–12.
Group leaders were all either PhD holders or PhD candidates in at least their third year of study. Group sessions were recorded and reviewed with the principal investigators.
In the event that a participant missed a session, the group leader or co-leader attempted to conduct an in-person make-up session. When this was not possible, phone make-up sessions were conducted instead.
We attempted to enhance retention through regular contact with participants. When necessary, this was supplemented by contacting friends and family members to maximize participant retention.
Measures
Weight was measured at the clinic visit and at every assessment by using a digital Seca scale. Height was measured without shoes and was used to calculate BMI. Assessors were not blinded at treatment visits but were blinded at the 6 assessments.
A number of additional measures were administered to check whether the HFE intervention produced inferior outcomes relative to the 2 behaviorally based interventions. This was done because little of the traditional behavioral curriculum was taught in the HFE condition and so we felt it was important to conduct noninferiority tests to see if this difference resulted in reduced benefits from HFE. Because these measures were used simply to test the noninferiority of the HFE condition, they are only described briefly here.
Physical activity
The Paffenbarger Physical Activity Scale was used to assess physical activity based on time spent in light-, moderate-, and vigorous-intensity activities over the past month (20).
Quality of life
The Impact of Weight on Quality of Life Scale–Lite assessed the impact of obesity on 5 aspects of quality of life: physical function, self-esteem, sexual life, public distress, and work (21).
Binge eating
The Binge Eating Scale, specifically designed for use in obese individuals, assessed the severity of binge-eating behaviors (22).
Disinhibition and cognitive restraint
Two subscales of the Three-Factor Eating Questionnaire-Revised 18 item (TFEQ-R18) were administered. The uncontrolled eating subscale evaluates hunger-driven overeating and binge eating and the cognitive restraint subscale measures cognitive and behavioral tendencies aimed at limiting food intake (23).
Food addiction
The Yale Food Addiction Scale measures addictive-like thoughts and behaviors pertaining to highly palatable foods (24).
Body satisfaction
The Body Shape Questionnaire assesses concerns about feelings of fatness and general body shape (25).
Food cravings
The General Food Cravings Questionnaire–Trait assesses general food cravings across 4 domains (26).
Eating self-efficacy
The Weight Efficacy Lifestyle Questionnaire, a 20-item questionnaire, measures self-efficacy for controlled eating related to weight management across 5 domains: food availability, negative emotions, physical discomfort, positive activities, and social pressure (27).
Depressive symptoms
The Beck Depression Inventory–II was used to assess depressive symptoms (28).
Statistical analysis
Power calculations are dependent on both an expected difference between treatment arms as well as the clustering of the data (repeated observations within an individual with ≤6 repeated measures/participant within 1 of the 3 treatment conditions), resulting in a multilevel model structure. By using the method described by Raudenbush and colleagues (29–31), and implemented with the software Optimal Design, power calculations were made for this multilevel model structure. From our power analysis, a sample size of 249 (83 for each group) was required for 80% power to detect a medium effect size, with a significance level of 0.05 and 6 assessment points, assuming the ratio of the variability of the level 1 coefficient to the variability of the level 1 residual is 1.
Descriptive statistics of baseline characteristics were computed for each treatment group. Baseline characteristics were compared between 3 treatment groups by using ANOVA (or nonparametric Kruskal-Wallis, as appropriate) for continuous variables and chi-square test for categorical variables. Sample size calculations were based on the minimal sample needed to detect the predicted condition by time interaction, given average effect sizes from similar past research.
Multilevel models were used to estimate weight-change trajectories for each participant and to examine the treatment group effect on weight loss. Multilevel models are not restricted to individuals with complete data at every time point or data measured at the same times for all individuals (32). Analyses were performed on an intent-to-treat basis. Multilevel models are preferable to analyses based on last observation carried forward because of their enhanced power and approach to handling missing data (33).
The percentage of weight change at each occasion was examined as the primary outcome. To capture the nonlinear pattern of growth over time, the best-fitting function of time from a family of flexible polynomial functions was selected—namely, time effects with powers of −1 and −2 (1/time and 1/time2) (34). Model fitting was evaluated by using the Bayesian information criterion, Akaike information criterion, and Deviance information criterion. Occasion-level repeated measures (level 1) were nested within participants (level 2). Cross-level interactions between time effects and treatment condition were included to examine how treatment group effect influences the individual growth trajectories. Baseline characteristics were also considered as time-invariant covariates in the multilevel model. Model-based effect sizes for differences in means between 2 independent groups in multilevel models were computed on the basis of the regression framework outlined by Feingold (35).
For reasons explained below, cognitive restraint was examined as a mediator of treatment group effect on percentage of weight loss. The Statistical Package for Social Science (SPSS) macro PROCESS was used to examine the significance of this mediator. The significance of mediation effects was assessed by bias-corrected bootstrap CIs. The absence of zero in the CI indicates significant mediation effects.
Multilevel models were also used to examine whether the change trajectories on the self-report measures were different across treatment conditions (i.e., the noninferiority tests). To evaluate cognitive restraint as a mediator, we used the mediation model outlined by Preacher and Hayes (36, 37) to estimate the total and specific indirect effects. This approach expands on Baron and Kenny's methods by providing additional guidelines and techniques that allow for the most robust and accurate interpretation of these mediating effects (38).
Analyses were conducted by using R, version 3.3.3, and SPSS, version 23.0. All reported P values are based on 2-sided hypotheses, and a significance level of 0.05 was used for all analyses.
RESULTS
The CONSORT (Consolidated Standards of Reporting Trials) diagram showing the number of individuals who participated in the study from initial recruitment through the follow-up assessments is shown in Supplemental Figure 1. Retention at different assessment points ranged from 69.5% at the 36-mo assessment to 84.3% at the 6-mo assessment. Baseline characteristics of the participants are summarized in Table 1. Participants had a mean ± SD age of 49.79 ± 10.68 y (range: 21–65 y) and a mean ± SD weight of 214.97 ± 38.51 pounds, and 80.5% (n = 211) were women. No significant differences in these baseline characteristics were identified between the 3 treatment groups.
TABLE 1.
Baseline characteristics of study participants across 3 treatment groups1
| Variable | BT (n = 90) | BT+MR (n = 91) | HFE (n = 81) |
|---|---|---|---|
| Age, y | 47.7 ± 12.572 | 50.38 ± 9.39 | 51.46 ± 9.42 |
| Body weight,3 pounds | 222.96 ± 39.39 | 209.89 ± 35.73 | 211.8 ± 39.56 |
| Female, n (%) | 75 (83) | 77 (85) | 59 (73) |
| Race/ethnicity,4n (%) | |||
| American Indian/Alaskan Native | 1 (1) | 1 (1) | 0 (0) |
| Asian | 1 (1) | 1 (1) | 1 (1) |
| Black or African American | 29 (32) | 31 (34) | 19 (23) |
| White | 55 (61) | 52 (57) | 58 (72) |
| >1 race/ethnicity | 1 (1) | 6 (7) | 3 (4) |
BT, behavior therapy; BT+MR, behavior therapy plus meal replacements; HFE, home food environment.
Mean ± SD (all such values).
Body weight in kilograms—BT: 101.22 ± 17.88; BT+MR: 95.29 ± 16.22; HFE: 96.16 ± 17.96.
There were no significant differences in the proportions of racial/ethnic groups across conditions.
From multilevel analysis, both the reciprocal of a linear time effect (P < 0.001) and the reciprocal of a quadratic time effect (P < 0.001) were significant for all 3 groups, suggesting that participants experienced significant, initially rapid reductions in weight, which gradually reversed over time (see Tables 2 and 3). We then examined possible covariates as well as the treatment condition effect on weight change over time. The addition of age, height, income, and education as covariates did not significantly improve the fit of the model. As shown in Table 3, the interactions between time effects and the treatment condition were significant when comparing the HFE group with the BT group (interaction between 1/time and condition: b = 8.21, P = 0.009, effect size = 0.85; interaction between 1/time2 and condition: b = −8.2, P = 0.012, effect size = −0.97). The combination of these 2 effect sizes, −0.12, reflects the modest size of the BT/HFE difference. The 2 interaction terms reflect the fact that weight changed over time in a nonlinear fashion. The combined effect of the 2 interaction terms on weight loss is shown in Figure 1; the only significant condition differences indicated that participants in the HFE group experienced greater weight loss over the course of the study than participants in the BT group. It should be pointed out, however, that this conclusion was supported statistically despite the fact that there was more convergence between conditions evident in the raw means (e.g., in Table 2, the HFE condition showed less mean weight loss than BT at the 24-mo assessment). The interactions were not significant when contrasting the HFE group with the BT+MR group and contrasting the BT+MR group with the BT group (Table 3).
TABLE 2.
Percentage of weight loss over time across 3 treatment groups1
| BT (n = 90) | BT+MR (n = 91) | HFE (n = 81) | |
|---|---|---|---|
| Month 6 | 9.68±6.53 | 9.55±5.36 | 10.76±5.01 |
| Month 12 | 9.41±7.92 | 10.37±7.77 | 10.97±7.79 |
| Month 18 | 7.06±7.09 | 7.85 ±7.74 | 9.23 ±8.36 |
| Month 24 | 6.16±7.57 | 5.48 ±7.41 | 5.67±8.59 |
| Month 36 | 4.21±8.64 | 3.06 ±6.93 | 4.49±7.83 |
Values are means ± SDs. When comparing the HFE group with the BT group, the interaction between 1/time and condition is b = 8.21, P = 0.009, ES = 0.85; the interaction between 1/time2 and condition is b = −8.2, P = 0.012, ES = −0.97. BT, behavior therapy; BT+MR, behavior therapy plus meal replacements; ES, effect size; HFE, home food environment.
TABLE 3.
Multilevel analysis of treatment group effect on weight change over time1
| HFE (n = 81) vs. | HFE (n = 81) vs. | BT+MR (n = 91) vs. | |
|---|---|---|---|
| BT (n = 90) | BT+MR (n = 91) | BT (n = 90) | |
| Intercept | −1.50+ ± 0.90 | −2.50** ± 0.87 | −1.52+ ± 0.86 |
| 1/time | 43.00*** ± 2.88 | 48.67***± 2.67 | 43.10*** ± 2.84 |
| 1/time2 | −41.55*** ± 2.47 | −46.25***± 2.28 | −41.64*** ± 2.45 |
| 1/time by condition | 8.21** ± 3.14 | 4.62 ± 2.92 | 3.47 ± 3.05 |
| 1/time2 by condition | −8.20* ± 3.27 | −4.61 ± 3.05 | −3.46 ± 3.17 |
Values are mean estimates ± SEs. +P < 0.10; *P < 0.05; **P < 0.01; ***P < 0.001. BT, behavior therapy; BT+MR, behavior therapy plus meal replacements; HFE, home food environment.
FIGURE 1.
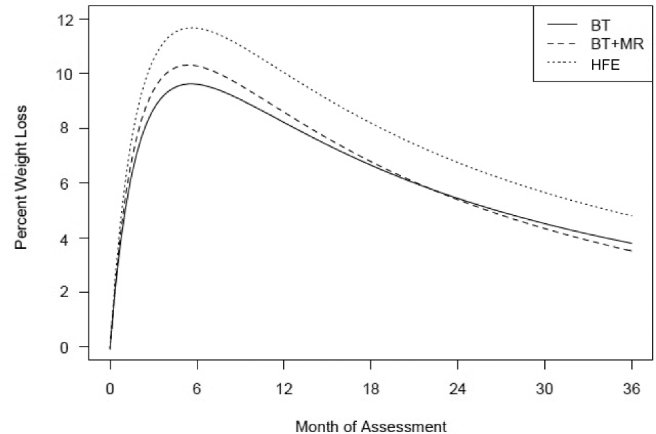
Estimated percentage of weight loss over time for the 3 treatment groups with the use of multilevel models. All 3 groups showed significant weight loss over 12 mo that was gradually regained to the 36-mo follow-up. Participants in the HFE group (n = 81) experienced greater weight loss over the course of the study than did participants in the BT group (n = 90) (interaction between 1/time and condition: b = 8.21, SE = 3.14, P = 0.009; interaction between 1/time2 and condition, b = −8.2, SE = 3.27, P = 0.012). BT, behavior therapy; BT+MR, behavior therapy plus meal replacements; HFE, home food environment.
For the tests of noninferiority, the only significant difference obtained was for the Cognitive Restraint scale (P = 0.02) (the results of these multilevel analyses are shown in Table 4). As shown in Figure 2, the HFE group showed a larger sustained increase in cognitive restraint than the other 2 conditions. Given this, we then tested whether changes in cognitive restraint mediated the greater weight loss seen in the HFE condition. From multilevel analysis, both the reciprocal of a linear time effect (P = 1.54 × 10−50) and the reciprocal of a quadratic time effect (P = 1.72 × 10−63) were significant for all 3 groups, suggesting that participants experienced significant, initially rapid reductions in weight, which gradually reversed over time (see Tables 3 and 4). Mediation analyses revealed cognitive restraint as a significant mediator of the treatment group effect on percentage of weight loss at the end of the treatment. Participants in the HFE group were estimated to have 89% more weight loss, on average, than participants in the BT group as a result of the positive effect of the HFE condition on percentage of cognitive restraint increase (unstandardized coefficient = 0.89; 95% CI: 0.2, 2.1).
TABLE 4.
Multilevel analysis of treatment group effect on study measure scores1
| HFE (n = 81) vs. | HFE (n = 81) vs. | BT+MR (n = 91) vs. | |
|---|---|---|---|
| Measure | BT (n = 90) | BT+MR (n = 91) | BT (n = 90) |
| PFS-total score | −0.01 ± 0.04 (0.81) | 0.01 ± 0.04 (0.73) | −0.02 ± 0.03 (0.51) |
| 0.00 ± 0.01 (0.94) | 0.00 ± 0.01 (0.53) | 0.01 ± 0.01 (0.40) | |
| TFEQ-R18 | |||
| Cognitive restraint | 0.85 ± 0.32 (0.007)** | 0.46 ± 0.34 (0.18) | 0.43 ± 0.30 (0.15) |
| −0.15 + 0.06 (0.016)* | −0.09 ± 0.07 (0.21) | −0.07 ± 0.06 (0.20) | |
| Uncontrolled eating | 0.02 ± 0.53 (0.97) | −0.35 ± 0.47 (0.46) | 0.39 ± 0.49 (0.42) |
| −0.01 ± 0.11 (0.96) | 0.04 ± 0.10 (0.70) | −0.05 ± 0.11 (0.65) | |
| WELQ | |||
| Negative emotions | 0.53 ± 1.02 (0.60) | 0.38 ± 1.11 (0.74) | 0.19 ± 1.14 (0.87) |
| −0.06 ± 0.21 (0.77) | −0.02 ± 0.22 (0.92) | −0.05 ± 0.22 (0.82) | |
| Availability | 0.65 ± 1.03 (0.53) | 0.42 ± 0.95 (0.66) | 0.21 ± 0.98 (0.83) |
| −0.04 ± 0.21 (0.83) | 0.00 ± 0.19 (0.99) | −0.04 ± 0.19 (0.84) | |
| Social pressure | 0.02 ± 1.06 (0.98) | −0.14 ± 0.98 (0.89) | 0.10 ± 1.02 (0.92) |
| 0.05 ± 0.22 (0.83) | 0.06 ± 0.20 (0.78) | 0.01 ± 0.21 (0.95) | |
| Physical discomfort | 0.34 ± 0.85 (0.69) | 0.25 ± 0.89 (0.78) | 0.11 ± 0.97 (0.91) |
| 0.00 ± 0.17 (0.99) | 0.03 ± 0.18 (0.89) | −0.03 ± 0.20 (0.87) | |
| Positive activities | −0.22 ± 0.79 (0.78) | −0.59 ± 0.73 (0.42) | 0.38 ± 0.80 (0.64) |
| 0.09 ± 0.16 (0.58) | 0.16 ± 0.14 (0.27) | −0.07 ± 0.16 (0.66) | |
| YFA | −0.12 ± 0.17 (0.47) | 0.20 ± 0.20 (0.31) | −0.34 ± 0.18 (0.06)+ |
| 0.02 ± 0.03 (0.60) | −0.05 ± 0.04 (0.23) | 0.07 ± 0.03 (0.06)+ | |
| GFCQ-T | −0.04 ± 0.04 (0.32) | 0.01 ± 0.04 (0.82) | −0.05 ± 0.04 (0.22) |
| 0.01 ± 0.01 (0.49) | −0.01 ± 0.01 (0.55) | 0.01 ± 0.01 (0.20) | |
| BSQ | −0.02 ± 0.04 (0.65) | 0.05 ± 0.04 (0.16) | −0.07 ± 0.04 (0.08)+ |
| 0.00 ± 0.01 (0.65) | −0.01 ± 0.01 (0.23) | 0.01 ± 0.01 (0.12) | |
| BDI-II | 0.67 ± 0.55 (0.22) | 0.45 ± 0.68 (0.51) | 0.25 ± 0.55 (0.65) |
| −0.13 ± 0.11 (0.21) | −0.11 ± 0.13 (0.38) | −0.03 ± 0.11 (0.82) | |
| Eating Habits Checklist | −1.36 ± 0.80 (0.09)+ | −0.40 ± 086 (0.65) | −0.97 ± 0.87 (0.27) |
| 0.22 ± 0.16 (0.17) | −0.01 ± 0.17 (0.96) | 0.23 ± 0.17 (0.19) | |
| IWQOL-L | −0.02 ± 0.03 (0.47) | 0.05 ± 0.03 (0.16) | −0.70 ± 0.03 (0.04)* |
| 0.00 ± 0.01 (0.62) | −0.01 ± 0.01 (0.11) | 0.01 ± 0.01 (0.06)+ | |
The first value for each variable within each column is the mean estimate ± SE (P value in parentheses) for the reciprocal of a linear time effect; the second value is the reciprocal of a quadratic time effect. +P < 0.10; *P < 0.05; **P < 0.01. BDI-II, Beck Depression Inventory–II; BSQ, Body Shape Questionnaire; BT, behavior therapy; BT+MR, behavior therapy plus meal replacements; GFCQ-T, General Food Cravings Questionnaire–Trait; HFE, home food environment; IWQOL-L, Impact of Weight on Quality of Life Scale–Lite; PFS, Power of Food Scale; TFEQ-R18, Three-Factor Eating Questionnaire; WELQ, Weight Efficacy Lifestyle Questionnaire; YFA, Yale Food Addiction Scale.
FIGURE 2.
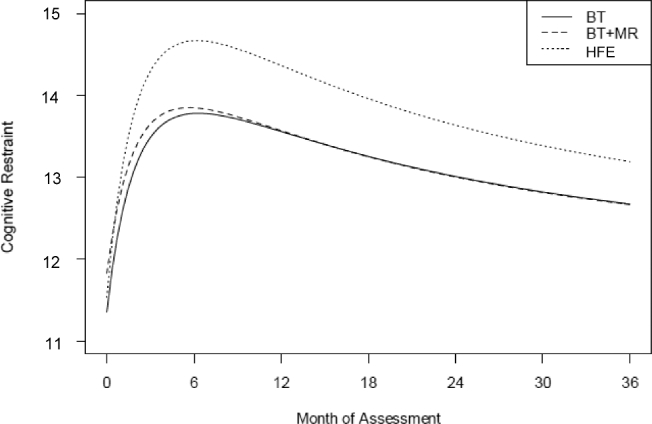
Estimated change in cognitive restraint scores over time for the 3 treatment groups with the use of multilevel models. The HFE group (n = 81) showed a larger sustained increase in cognitive restraint than the BT (n = 90) and BT+MR (n = 91) groups. In addition, participants in the HFE group were estimated to have 89% more weight loss on average than participants in the BT group as a result of the positive effect of the HFE condition on the percentage of increase in cognitive restraint (unstandardized coefficient = 0.89; 95% CI: 0.2, 2.1). The combined group means ± SDs for the 0-, 6-, 12-, 18-, 24-, and 36-mo visits were 11.57 ± 2.48, 14.20 ± 2.73, 14.00 ± 2.73, 13.52 ± 2.73, 13.10 ± 2.78, and 13.00 ± 3.02, respectively. BT, behavior therapy; BT+MR, behavior therapy plus meal replacements; HFE, home food environment.
DISCUSSION
We tested the hypotheses that the addition of MRs to a standard behavioral weight-loss intervention, and a nutrition-focused intervention that promoted various changes in foods kept in individuals’ personal food environment, would promote long-term weight loss better than standard BT. A main effect of treatment condition and the absence of an interaction with time indicated that a significant separation in weight loss between conditions was achieved and that this difference did not change over the 2-y follow-up period. Those in the HFE condition lost more weight and maintained more weight loss than those in the BT condition; results for those in the BT+MR condition were in between those of the other 2 conditions but did not differ significantly from either of them.
The degree of separation in weight loss between the groups was modest and unlikely to make a meaningful difference in the health conditions associated with obesity. Thus, the implications of the findings are more conceptual than clinical. One implication of the findings is that the switch from BT's focus on improving self-control skills to HFE's focus on participants making specific nutritional changes in their home environments more than made up for any reduction in the efficacy of the standard behavioral curriculum that might have otherwise occurred. Thus, no potential benefits of BT were sacrificed in order to expand HFE's focus on nutritional and food environment changes.
Cognitive restraint, the one noninferiority measure that did differentiate the 3 groups, showed the largest, most prolonged increase in the HFE condition. This effect was not expected. A mediation analysis indicated that the greater increase in cognitive restraint accounted for nearly all of the weight-loss advantage of HFE over BT. These effects were not predicted, but the fact that the increase in cognitive restraint was maintained over multiple follow-up assessments suggests that this difference was robust. We believe that the most likely explanation for this effect involved the perspective on self-control that was presented throughout the HFE intervention. Although some self-control is required in any lifestyle-change weight-loss program, HFE conceptualized self-control as necessary but wholly insufficient for the task of making the sustained changes in energy intake that are required to achieve long-term weight loss. We presented several reasons that de-emphasized building self-control skills and emphasized a nutrition-focused approach in participants' treatment. These included the powerful genetic determinants of obesity, the difficulty of sustaining weight losses in an obesogenic environment, the tendency of the body to treat pretreatment weight as a kind of set point, and the automatic and pervasive effects that food cues have on self-control after weight loss. Discussing this information was sobering but was not meant to discourage or blame participants. Rather, we emphasized the need to gain control over food cues and the availability, composition, and form of foods in their personal food environment as counterweights to the challenges of sustaining weight losses. In short, we suggested that by making multiple changes to their food environment, they would be reducing the need to perpetually exercise self-control to maintain the weight they lost.
We surmise that this evidence-based enumeration of the obstacles standing in the way of weight-loss maintenance had the effect of rousing feelings of reactance in the HFE participants. That is, our explanation of all the reasons why it is so hard for people to lose weight and maintain the loss may have motivated participants to “push back” against this message by increasing their vigilance over eating. If this explanation for the increase in cognitive restraint in the HFE condition is correct, then it would be more than a little ironic. That is, by questioning the usefulness of building self-control skills and detailing the internal and external threats to successful self-control, the HFE treatment may have bolstered the very capacity it was meant to downplay—stronger self-control with regard to food, measured here as cognitive restraint.
The BT+MR condition achieved impressive weight reductions during the first year but its long-term weight-loss outcomes did not statistically differ from the other 2 conditions. This condition showed larger mean weight losses than BT at the 12- and 18-mo assessments but lower losses at the 1- and 2-y follow-ups. However, it was not statistically different than the other 2 conditions. This outcome replicates our previous finding (7), but both results diverge from past work that found that MRs significantly increase weight loss (3).
There are several additional implications of the current findings. First, the cognitive restraint findings imply that the rationale provided to HFE participants may be worth pursuing as a means of enhancing the kind of long-lasting dietary vigilance that could facilitate sustained weight losses. That is, by emphasizing the array of factors that make lasting weight loss so difficult, it may help individuals to mentally and behaviorally prepare to cope with these factors. Second, it is important to distinguish between the characteristics of BT that the HFE intervention did and not duplicate. The HFE intervention did retain the critical underpinnings of group sessions and group support, regular meetings, goal setting, weekly weigh-ins, and dietary self-monitoring. However, it removed most of the behavioral focus on building self-control skills (e.g., coping with stress) and teaching problem solving to help participants overcome motivational, behavioral, and emotional challenges to weight loss. This suggests that a treatment that retains some critical underpinnings of BT but excludes most of the curriculum of BT can produce prolonged weight losses that match or exceed those achieved by traditional BT. Third, it is notable that the rate of weight regain shown by the HFE group, relative to the other 2 treatment conditions, did not accelerate over the 2 y of follow-up. That is, the statistical analyses indicated that the curves modeling weight trajectory during follow-up did not show a tendency toward convergence. In past studies of weight-loss treatments, a condition that initially produced greater weight loss and then weight regain has tended to catch up to comparison treatments so that the different treatments become more indistinguishable as the length of follow-up grew. Thus, if the longer-lasting benefits of the HFE treatment can be replicated, this would represent another positive feature of this treatment modality.
The retention rate of participants ranged from a high of 84% at 6 mo to a low of 70% at the 2-y follow-up. This represents a relatively good retention rate. Furthermore, the use of multilevel modeling allowed us to include all individuals with ≥1 observation in the analysis, which provides increased power and the ability to detect nonlinear trends across multiple time points. Another strength of this study is its inclusion of 2 y of follow-up data. A weakness of the methodology was that, because of its novelty, more supervision of group leaders occurred in the HFE condition than in the other 2 conditions. The additional supervision given to group leaders in the HFE condition might have contributed to the better weight-loss outcomes achieved. Another weakness is that all of the outcome measures of exercise and eating behavior were based on self-report.
In sum, the results of this study indicate that a nutritionally focused treatment produced better long-term weight losses than standard BT. This treatment also produced larger increases in cognitive restraint, an effect that accounted for some, if not all, of the additional weight-loss benefit produced by the HFE intervention. The HFE condition did not appear to reduce ancillary psychological and behavioral benefits associated with BT. Future research should explore ways of improving the HFE treatment and the development of ways to make sustained nutritional change easier and more acceptable to those receiving this treatment.
Supplementary Material
ACKNOWLEDGMENTS
We thank Brooke Bailer, Lucy Faulconbridge, and Myles Faith (from the University of Pennsylvania) and Staci Berkowitz, Laura Berner, Ali Ely, Jessica Markowitz, Amy Neeren, and Ashley Witt (from Drexel University) for serving as interventionists in the study. We thank Lucy Faulconbridge and Tom Wadden for providing the participant and provider treatment materials used in the BT intervention, as well as those used in the MR intervention.
The authors’ responsibilities were as follows—MRL and MLB: designed and conducted the research; FZ: analyzed the data; MRL: had final responsibility for content; and all authors: wrote the manuscript, and read and approved the final manuscript. The authors reported no conflicts of interest.
Supported by NIH grant R01 DK080909.
Supplemental Figure 1 is available from the “Supplementary data” link in the online posting of the article and from the same link in the online table of contents at https://academic.oup.com/ajcn/.
Abbreviations used
- BT
behavior therapy
- BT+MR
behavior therapy plus meal replacements
- ED
energy density
- HFE
home food environment
- MR
meal replacement
REFERENCES
- 1. Butryn ML, Webb V, Wadden TA. Behavioral treatment of obesity. Psychiatr Clin North Am 2011;34:841–59. [DOI] [PMC free article] [PubMed] [Google Scholar]
- 2. Lowe MR. Self-regulation of energy intake in the prevention and treatment of obesity: is it feasible? Obes Res 2003;11:44S–59S. [DOI] [PubMed] [Google Scholar]
- 3. Aller EE, Larsen TM, Claus H, Lindroos AK, Kafatos A, Pfeiffer A, Martinez JA, Handjieva-Darlenska T, Kunesova M, Stender S, et al. Weight loss maintenance in overweight subjects on ad libitum diets with high or low protein content and glycemic index: the DIOGENES trial 12-month results. Int J Obes (Lond) 2014;38:1511–7. [DOI] [PubMed] [Google Scholar]
- 4. Ditschuneit HH, Flechtner-Mors M, Johnson TD, Adler G. Metabolic and weight-loss effects of a long-term dietary intervention in obese patients. Am J Clin Nutr 1999;69:198–204. [DOI] [PubMed] [Google Scholar]
- 5. Ello-Martin JA, Ledikwe JH, Rolls BJ. The influence of food portion size and energy density on energy intake: implications for weight management. Am J Clin Nutr 2005;82:236S–41S. [DOI] [PubMed] [Google Scholar]
- 6. Lowe MR, Tappe KA, Annunziato RA, Riddell LJ, Coletta MC, Crerand CE, Didie ER, Ochner CN, McKinney S. The effect of training in reduced energy density eating and food self-monitoring accuracy on weight loss maintenance. Obesity 2008;16:2016–23. [DOI] [PubMed] [Google Scholar]
- 7. Lowe MR, Butryn ML, Thomas JG, Coletta M. Meal replacements, reduced energy density eating, and weight loss maintenance in primary care patients: a randomized controlled trial. Obesity (Silver Spring) 2014;22:94–100. [DOI] [PMC free article] [PubMed] [Google Scholar]
- 8. Heymsfield SB, van Mierlo CA, van der Knaap HC, Heo M, Frier HI. Weight management using a meal replacement strategy: meta and pooling analysis from six studies. Int J Obes Relat Metab Disord 2003;27:537–49. [DOI] [PubMed] [Google Scholar]
- 9. Geier AB, Rozin P, Doros G. Unit bias. A new heuristic that helps explain the effect of portion size on food intake. Psychol Sci 2006;17:521–5. [DOI] [PubMed] [Google Scholar]
- 10. Westerterp-Plantenga MS, Lemmens SG, Westerterp KR. Dietary protein—its role in satiety, energetics, weight loss and health. Br J Nutr 2012;108:S105–12. [DOI] [PubMed] [Google Scholar]
- 11. Wanders AJ, van den Borne JJ, de Graaf C, Hulshof T, Jonathan MC, Kristensen M, Mars M, Schols HA, Feskens EJ. Effects of dietary fibre on subjective appetite, energy intake and body weight: a systematic review of randomized controlled trials. Obes Rev 2011;12:724–39. [DOI] [PubMed] [Google Scholar]
- 12. Wansink B, Painter JE, Lee YK. The office candy dish: proximity's influence on estimated and actual consumption. Int J Obes (Lond) 2006;30:871–5. [DOI] [PubMed] [Google Scholar]
- 13. Raynor HA. Can limiting dietary variety assist with reducing energy intake and weight loss? Physiol Behav 2012;106:356–61. [DOI] [PMC free article] [PubMed] [Google Scholar]
- 14. Rolls BJ. Volumetrics eating plan. Harper; 2007. New York, NY. [Google Scholar]
- 15. Skov LR, Lourenco S, Hansen GL, Mikkelsen BE, Schofield C. Choice architecture as a means to change eating behaviour in self-service settings: a systematic review. Obes Rev 2013;14:187–96. [DOI] [PubMed] [Google Scholar]
- 16. Brownell KD. The LEARN program for weight management. Dallas (TX): American Health Publishing Company; 2004. [Google Scholar]
- 17. The Diabetes Prevention Program Research Group Achieving weight and activity goals among diabetes prevention program lifestyle participants. Obes Res 2004;12:1426–34. [DOI] [PMC free article] [PubMed] [Google Scholar]
- 18. Wadden TA, Foster GD, Sarwer DB, Anderson DA, Gladis M, Sanderson RS, Letchak RV, Berkowitz RI, Phelan S. Dieting and the development of eating disorders in obese women: results of a randomized controlled trial. Am J Clin Nutr 2004;80:560–8. [DOI] [PubMed] [Google Scholar]
- 19. Wadden TA, Faulconbridge LF, Jones-Corneille LR, Sarwer DB, Fabricatore AN, Thomas JG, Wilson GT, Alexander MG, Pulcini ME, Webb VL, et al. Binge eating disorder and the outcome of bariatric surgery at one year: a prospective, observational study. Obesity (Silver Spring) 2011;19:1220–8. [DOI] [PMC free article] [PubMed] [Google Scholar]
- 20. Paffenbarger RS Jr., Blair SN, Lee IM, Hyde RT.. Measurement of physical activity to assess health effects in free-living populations. Med Sci Sports Exerc 1993;25:60–70. [DOI] [PubMed] [Google Scholar]
- 21. Kolotkin RL, Crosby RD, Kosloski KD, Williams GR. Development of a brief measure to assess quality of life in obesity. Obes Res 2001;9:102–11. [DOI] [PubMed] [Google Scholar]
- 22. Gormally J, Black S, Daston S, Rardin D. The assessment of binge eating severity among obese persons. Addict Behav 1982;7:47–55. [DOI] [PubMed] [Google Scholar]
- 23. Karlsson J, Persson LO, Sjostrom L, Sullivan M. Psychometric properties and factor structure of the Three-Factor Eating Questionnaire (TFEQ) in obese men and women. Results from the Swedish Obese Subjects (SOS) study. Int J Obes Relat Metab Disord 2000;24:1715–25. [DOI] [PubMed] [Google Scholar]
- 24. Gearhardt AN, Corbin WR, Brownell KD. Preliminary validation of the Yale Food Addiction Scale. Appetite 2009;52:430–6. [DOI] [PubMed] [Google Scholar]
- 25. Cooper PJ, Taylor MJ, Cooper Z, Fairbum CG. The development and validation of the body shape questionnaire. Int J Eat Disord 1987;6:485–94. [Google Scholar]
- 26. Nijs IMT, Franken IHA, Muris P. The modified Trait and State Food-Cravings Questionnaires: development and validation of a general index of food craving. Appetite 2007;49:38–46. [DOI] [PubMed] [Google Scholar]
- 27. Clark MM, Abrams DB, Niaura RS, Eaton CA, Rossi JS. Self-efficacy in weight management. J Consult Clin Psychol 1991;59:739–44. [DOI] [PubMed] [Google Scholar]
- 28. Beck AT, Steer RA, Brown G. Manual for the Beck Depression Inventory-II. San Antonio (TX): Psychological Corporation; 1996. [Google Scholar]
- 29. Raudenbush SW. Statistical analysis and optimal design for cluster randomized trials. Psychol Methods 1997;2:173–85. [DOI] [PubMed] [Google Scholar]
- 30. Raudenbush SW, Liu X-F.. Statistical power and optimal design for multisite randomized trials. Psychol Methods 2000;5:199–213. [DOI] [PubMed] [Google Scholar]
- 31. Raudenbush SW, Liu X-F.. Effects of study duration, frequency of observation, and sample size on power in studies of group differences in polynomial change. Psychol Methods 2001;6:387–401. [PubMed] [Google Scholar]
- 32. Kwok OM, Underhill AT, Berry JW, Luo W, Elliott TR, Yoon M. Analyzing longitudinal data with multilevel models: an example with individuals living with lower extremity intra-articular fractures. Rehabil Psychol 2008;53:370–86. [DOI] [PMC free article] [PubMed] [Google Scholar]
- 33. Gibbons RD, Hedeker D, DuToit S. Advances in analysis of longitudinal data. Ann Rev Clin Psychol 2010;6:79–107. [DOI] [PMC free article] [PubMed] [Google Scholar]
- 34. Nelder JA. Inverse polynomials, a useful group of multi-factor response functions. Biometrics 1966;22:128–41. [Google Scholar]
- 35. Feingold A. Effect sizes for growth-modeling analysis for controlled clinical trials in the same metric as for classical analysis. Psychol Methods 2009;14:43–53. [DOI] [PMC free article] [PubMed] [Google Scholar]
- 36. Preacher KJ, Hayes AF. SPSS and SAS procedures for estimating indirect effects in simple mediation models. Behav Res Methods Instrum Comput 2004;36:717–31. [DOI] [PubMed] [Google Scholar]
- 37. Hayes AF, Preacher KJ. Statistical mediation analysis with a multicategorical independent variable. Br J Math Stat Psychol 2014;67:451–70. [DOI] [PubMed] [Google Scholar]
- 38. Hayes AF. Beyond Baron and Kenny: statistical mediation analysis in the new millennium. Commun Monogr 2009;76:408–20. [Google Scholar]
Associated Data
This section collects any data citations, data availability statements, or supplementary materials included in this article.