Summary
Background/Objectives
The peri-oral muscles—including orbicularis oris—are critical in maintaining equilibrium in tooth position. Lip incompetence (LI) can thus be a factor in malocclusion. We therefore aimed to validate a technique to evaluate not only muscle activity via electromyography (EMG) but also muscle endurance and fatigue via blood flow (BF) for LI.
Subjects/Methods
Subjects were classified into increased muscle tension/lip incompetent (experimental) and normal muscle tension/lip competent (control) groups. Each subject then exerted force on a custom-made traction plate connected to a tension gauge. Using laser speckle imaging and electromyographic measurements, we characterized muscle activity and corresponding BF rates in these subjects in various states of resting, loading, and recovery.
Results
Results showed a significant difference between the experimental and control groups, notably in the rate of change in BF to the inferior orbicularis oris muscle under conditions of increasing load (graded exertion). Furthermore, the data suggested that the muscles in the control group undergo a more prolonged (and therefore presumably more complete) recovery than muscles in the experimental group. These factors of reduced BF and short recovery may combine to accelerate muscle fatigue and produce LI.
Limitations
The sample used here was controlled for malocclusion (including open bite) to eliminate this type of confounding effect.
Conclusions/Implications
From these findings, we conclude that reduced BF and inadequate recovery in the orbicularis oris muscles may be more significant than EMG activity in the assessment of LI.
Introduction
‘Equilibrium theory’ posits that, together with the tongue, the perioral muscles—including the orbicularis oris muscle—maintain equilibrium in tooth position (1–3). Rogers reported that most orthodontic complications result from a lack of balance between the opposite forces exerted by the perioral and intra-oral muscles (4). For example, patients with dysfunctional orbicularis oris muscle activity may present with lip incompetence (LI), which affects the dental arch and dentofacial morphology (5, 6).
Clinically, subjects with LI are diagnosed on the basis of visual inspection of muscular tension in the mental region (7), with much of the published literature on the pathology of this condition founded on such observations. A more quantitative method of analysis measures activity within the superior and inferior orbicularis muscle using electromyography (EMG) (7–10). Such studies have reported significantly increased inferior orbicularis muscle activity (9), significant differences in muscle activity in actions such as swallowing (10), muscle activity, and muscle blood flow (BF) differences between subjects with and without LI (11), poor endurance in the orbicularis oris muscle in subjects with LI (12, 13), and evidence that lip endurance training with LI subjects increases endurance with increased training time (14). However, there have been no studies comparing muscle endurance in LI and healthy subjects using any parameters other than time.
In the extremities, measurement of muscle endurance is a common method for evaluating muscle conditioning, using various parameters such as analysis of BF during the recovery period immediately after loading (15–19), since BF increases during muscle loading and returns to resting levels after a recovery period post-loading (17). There is a close relationship between muscle endurance and muscle BF during the loading and recovery phases (18) and the recovery period in durable muscles is significantly prolonged compared to that of less durable muscles (19). Thus, measuring BF from the loading phase to the recovery period is an effective means for measuring muscle endurance in the extremities.
Muscle fatigue, defined as ‘a state of exhaustion or loss of strength or endurance’ (20), can also characterize muscle capacity, considering the ‘point of fatigue’ as synonymous with the ‘limit of endurance’ (21). Several studies have reported on muscle fatigue in the extremities by measuring BF during graded exertion (22–27), one of which found a significant negative correlation between the rates of change in BF volume and muscle fatigue (27), with muscle fatigue increasing as the rates of change in BF volume decrease during graded exertion. These imply the importance of evaluating BF not only during the recovery period but also during graded exertion.
To apply these findings to facial muscles like the orbicularis oris, validated techniques of measuring not only muscle activity but also muscle capacity (endurance and fatigue) in this region are necessary. Our study aimed to measure BF during graded exertion and recovery in subjects with and without LI using laser speckle imaging and to evaluate endurance and fatigue in relation to BF in the orbicularis oris. Demonstrating consistent differences between subjects with and without LI is the first step to assessing the clinical efficacy of treatments to change oral habits that contribute to LI and mouth breathing, influence relapse after orthodontic treatment (28), and possibly cause skeletal morphology and dental arch changes in childhood (29).
Material and methods
Subjects
One hundred healthy adult subjects were recruited, including dental students and staff members of the hospital. Exclusion criteria were: 1. any nasal deformity, infection, allergy or nasal disease; 2. congenital malformation including clefting and temporomandibular joint dysfunction; and 3. current use of medications that affect muscle activity. Prior to the experiment, we confirmed that there was no significant difference in BF or EMG activity between the right and left hemispheres of the orbicularis oris muscle. Subjects were classified into two subgroups, namely those with and without distinct muscular tension, manifesting as dimpling of the skin in the mental region during lip sealing at the mandibular rest position (7). Classification was performed by three examiners certified by the Japanese Orthodontic Society (J.T., J.J.M., and K.M.) (7). Accordingly, 15 subjects (4 male and 11 female; mean age: 29.0 ± 1.3) with elevated muscular tension were assigned to an experimental group, and 15 sex-matched subjects were selected for a control group (with no observable elevation in muscle tension; mean age: 29.6 ± 1.1 years) by simple randomized sampling of the remaining 85 subjects (36 male, 49 female) using a random number table. All procedures in this study were in compliance with the Code of Ethics of the World Medical Association (Declaration of Helsinki) and the standards established by the Ethical Review Board of our institution, which specifically approved this study (#587). Procedures were fully explained to all participants, who each provided written informed consent before the study.
The sample size was estimated to be 30 subjects for an effect size of 1 (30) for the 70%RM and 50%RM groups variable, with a power calculation of 0.80 and an alpha of 0.05 (G* Power, version 3.1.9.2; 31).
Data acquisition
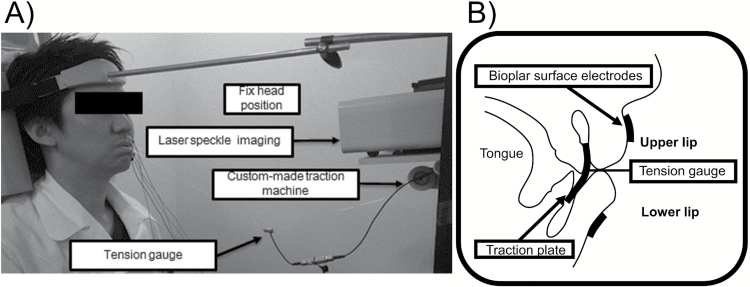
The anteroposterior relation of the dentition (overjet) and the vertical relation (overbite) were measured in each subject using a study model. Prior to the experiment, a custom-made traction plate was fabricated from 0.75-mm thick plastic and applied to the upper and lower oral vestibules in each subject (Imprelon S, Scheu-Dental Co., Iserlohn, Germany). This traction plate was designed to have the same height as that between the upper and lower incisor cervical areas, and the same inter-canine width. To avoid negative pressure from the oral vestibules, the plate was punctuated with 5-mm holes. Subjects were placed in an upright sitting position with the head fixed such that the Frankfort horizontal plane was parallel to the floor, and instructed to breathe nasally. Traction plates were inserted in the upper and lower oral vestibules, and the maximum contractile tension of the orbicularis oris muscle (single repetition of maximal output: 1-RM) was measured by pulling against the plate connected to the tension gauge (LT6-5S; SSK Co. Ltd., Tokyo, Japan) using a custom-made traction device until the plate is pulled out of the mouth (Figure 1). Accurate 30, 50 and 70 per cent load values were then calculated based on this maximum contractile tension for each subject.
Figure 1.
Muscle activity was measured by pulling against a traction plate connected to a tension gauge. (a) Oblique view of the tension gauge connected to the custom-made traction machine during exercise period. (b) Schematic illustration of the intraoral traction plate.
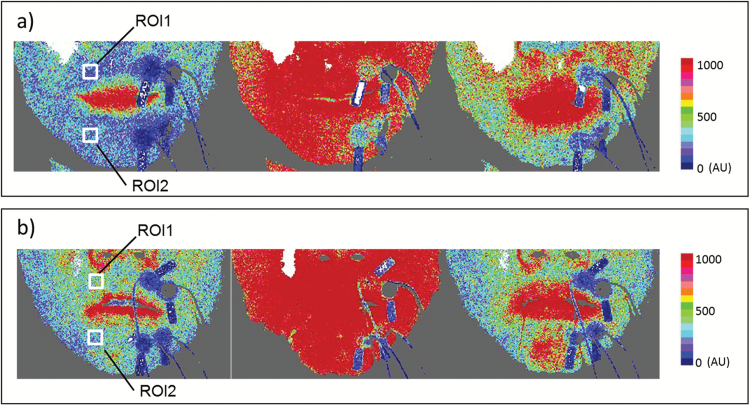
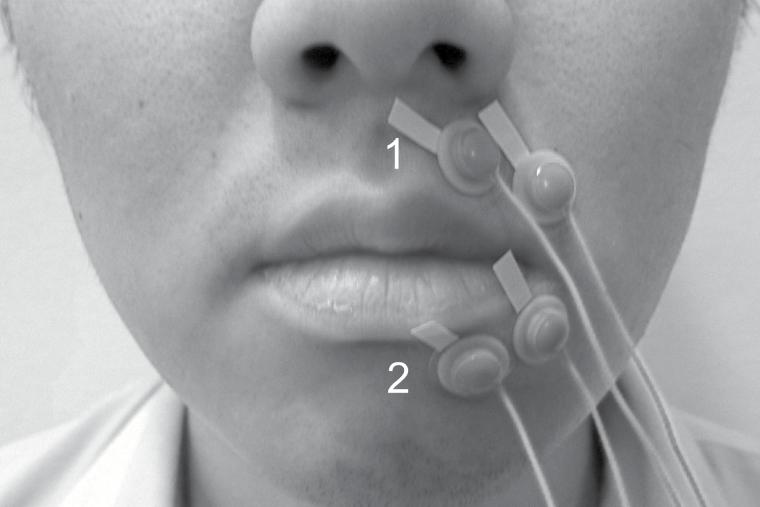
Blood flow in the superior and inferior orbicularis oris was measured using a laser speckle imager (moorFLPI Full-Field Laser Perfusion Imager; Moor Instruments, Axminster, UK). The sensor was positioned 30 cm from the upper lip, producing high-resolution images with a display rate of 25 Hz, time constant of 1.0 s, and camera exposure time of 20 ms. The target areas were the superior and inferior orbicularis oris muscles, with two regions of interest (ROIs) defined for each muscle in each image (Figure 2). Mean blood perfusion was estimated based on perfusion values in an area 3 mm × 3 mm (144 pixels). EMG activity was simultaneously recorded under the same conditions as for BF recording, using bipolar surface electrodes of 8.0 mm in diameter (Nihon Kohden, Tokyo, Japan) attached to the skin contralateral to the ROIs for the BF measurements (Figure 3). The surface electrodes were attached to the skin 20 mm apart on the upper lips and 15 mm apart on the lower lips, according to the relevant anatomical orientation (9, 11). To exclude inter-examiner error, the same examiner attached the electrodes in each subject. The signal from the electrodes was amplified using a biophysical preamplifier, digitized at a sampling frequency of 2000 Hz using data acquisition software (Lab chart, AD Instruments, Australia), and stored on a personal computer.
Figure 2.
Images showing BF in defined regions of interest (ROIs). Two ROIs on the perioral muscles were defined in each image. ROIs were set according to the same regions of electrodes as those used for EMG activity measurement. ROI1 denotes the superior orbicularis oris muscle, whereas ROI2 indicates the inferior orbicularis oris muscle. (a) Typical laser speckle perfusion image of a control group subject. (b) Typical laser speckle perfusion image of an experimental group subject. For each image series, the left-hand, middle and right-hand panels represent the rest, exercise and recovery periods, respectively.
Figure 3.
Positioning of the bipolar surface electrodes. Both lateral and medial electrodes were set in both experimental and control groups (1: superior orbicularis oris; 2: inferior orbicularis oris).
As described in previous studies (12, 13), the maximum achievable tension was defined as 1-RM and experimental loads subsequently calculated as 30, 50, and 70 per cent of 1-RM. Three recording sessions were performed at each loading condition. Each session consisted of a rest period, exercise period, and recovery period. The rest period was defined as the habituation time (>5 min) after plate insertion. The exercise period comprised an alternating pattern of twenty 5-s periods of load separated by twenty 5-s periods without load. The BF and EMG were recorded simultaneously for the superior and inferior orbicularis oris. The recovery period was the 25-s period immediately post-exercise. Each participant rested for 10 min without a traction plate in a sitting position prior to measurement, and again between sessions. Total experimental duration was approximately 1 h.
Data analysis
Data are, unless otherwise stated, shown as mean ± SD. For the rest period, a stable record (5-s duration) of raw EMG signals at two target areas at each load were processed through full-wave rectification and integration, and the mean EMG activity was calculated. Likewise, a stable 5-s record of BF at the two target areas at each load were randomly selected to calculate mean BF. An identical procedure was used to measure EMG and BF in the exercise period, except that the mean EMG activity and BF values were calculated from five randomly selected 3-s stable signals. Finally, mean BF was measured for each 5 s block in the 25-s recovery period (Figure 4; R0, 0–5 s; R1, 6–10 s; R2, 11–15 s; R3, 16–20 s; R4, 21–25 s). For all BF and EMG activity measurements, the smallest number of trials meeting the criteria (ICCs≧ 0.80, SEM%< 25%) was identified, indicating the minimum number to trials required for sufficient repeatability and reliability (32, 33).
Figure 4.
Study design. Rest period consists of at least 5 min of habituation after plate insertion. The Exercise period follows, with solid and open blocks indicating the ‘loaded’ and ‘unloaded’ phases, respectively. The recovery period is the 25 s immediately after exercise, and is sub-divided into five blocks of 5 s.
Statistical analysis
The Mann–Whitney U test was used to compare the maximum tension, overjet and overbite, the rate of change in BF volume, and the BF and EMG activity in the exercise period between the control and experimental groups. The Wilcoxon signed-rank test with Bonferroni correction was used to detect differences in BF and EMG activity in the exercise period at each different load. The Steel test was used to compare BF data for each recovery period (R0–R4) to those from the rest period.
All procedures were performed with commercial statistical software (SPSS Release 13.0, Chicago, Illinois, USA). All tests were two-tailed, with P<0.05 considered to be statistically significant.
Results
Laser speckle imaging
Typical examples of laser speckle images of BF in the control and experimental groups during the rest, exercise, and recovery periods are shown in Figure 2.
Dental evaluation
Based on study model analysis, the mean overjet was 4.3 ± 1.5 mm in the experimental group and 2.3 ± 1.2 mm in the control group, a statistically significant difference. The mean overbite was 2.2 ± 1.7 mm in the experimental group and 2.0 ± 1.9 mm in the control group, which was not statistically significantly different.
Comparison of the maximum tension of the orbicularis oris muscle in control and experimental groups
In 8 male and 22 female subjects, the average maximum tension was 1477 ± 344 kgf and 1153.9 ± 264 kgf, respectively. Moreover, the average maximum tension was 1247 ± 364 kgf for the control group and 1232 ± 364 kgf in the experimental group. Neither of these differences were statistically significant.
Comparison of BF and EMG activity at each load condition
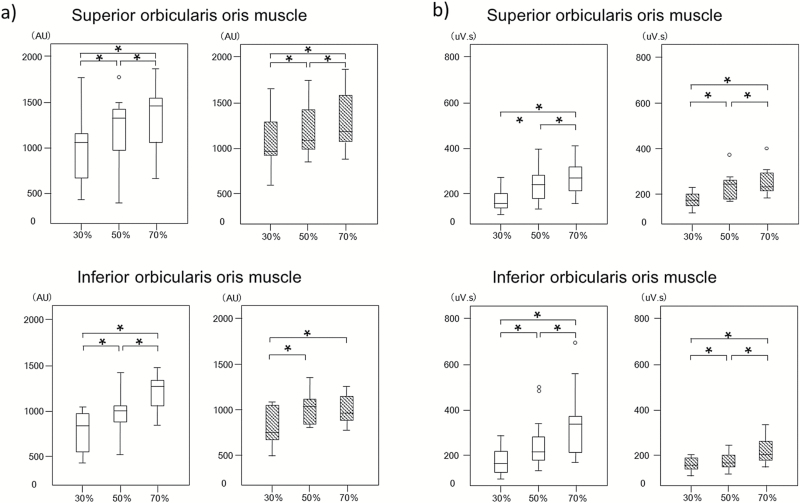
Figure 5 shows the changes in BF and EMG activity for each load condition. Significant differences in BF between loading conditions were observed for both superior and inferior orbicularis oris in the control group. In contrast, in the experimental groups, there were significant differences in BF between the 30%RM and 50%RM conditions, and similarly between the 30%RM and 70%RM conditions for the superior and inferior orbicularis oris, but not between the 50% RM and 70% RM conditions for only the inferior orbicularis oris. Significant differences in EMG activity between different loading conditions were observed in both superior and inferior orbicularis oris in the control group. Similarly, in the experimental groups, there were also significant differences in EMG activity between each loading condition for the superior and inferior orbicularis oris. Furthermore, there were no significant differences in the BF and EMG activity between the control and experimental groups. Additionally, there were no significant differences in the BF and EMG activity between male and female subjects in the control and experimental groups.
Figure 5.
EMG and BF values at different loading conditions in the control and experimental groups. Box-and-whisker plots show the distribution of BF (a) and EMG activities (b) in the control group (open bars) and experimental group (hatched bars) at different loading conditions. The line in each box represents the median of 30 subjects. The lower and upper boundaries of the box indicate the 25th and 75th percentiles. Error bars represent the 1.5-fold interquartile range. *Denotes a significant difference between the indicated loading conditions (P < 0.05 with the Bonferroni correction).
Comparison of the rate of change in BF volume and EMG activity at different loading conditions
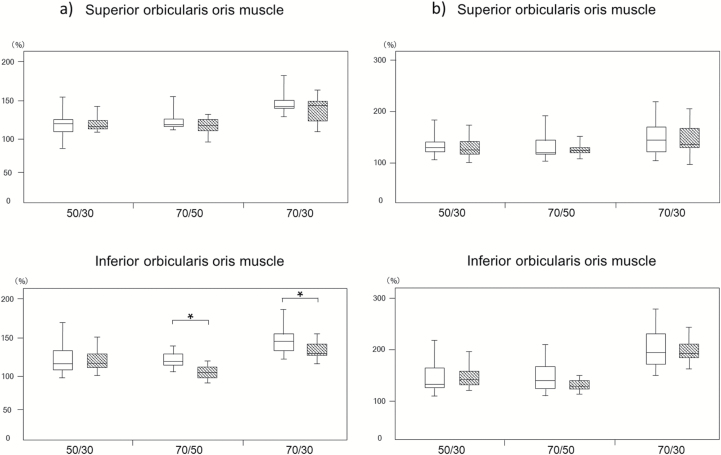
Figure 6 shows the rate of change in BF volume through the superior and inferior orbicularis oris in the control and experimental groups. Significant differences were found in the inferior orbicularis oris between the 70%RM and 30%RM groups, and between the 70%RM and 50%RM groups. No other significant differences were found for either BF or muscle activity.
Figure 6.
Rate of change in BF volume and EMG activity. Box-and-whisker plots show the distribution of the rate of change in BF (a) and EMG activities (b) in the control group (open bars) and experimental group (hatched bars) at different loading conditions. The line in each box represents the median of 30 subjects. The lower and upper boundaries of the box indicate the 25th and 75th percentiles. Error bars represent the 1.5-fold interquartile range. *Denotes a significant difference between the indicated groups (P < 0.05).
Comparison of BF rates in the rest and recovery periods
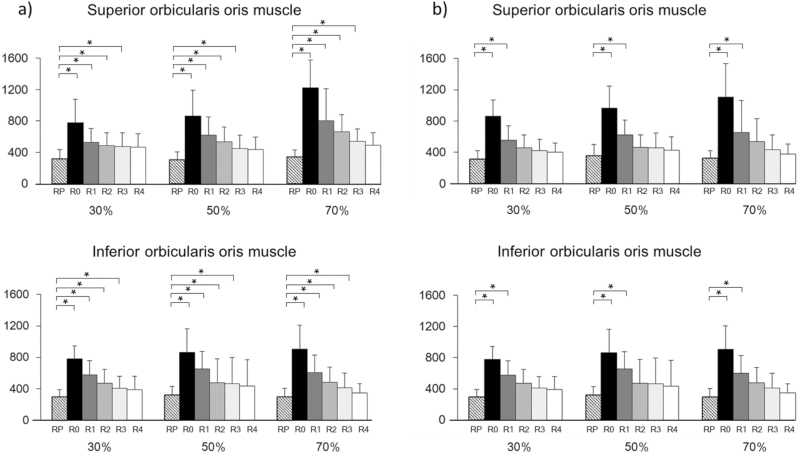
Figure 7 shows the changes in BF in the rest and recovery periods. Compared with BF during rest in all muscles in the control group, there were significant differences in BF during each recovery period (R0, R1, R2, and R3). However, in the experimental group, there were no significant differences in BF from recovery period R2 onwards. Significant differences were observed for BF during the recovery period in both the superior and inferior orbicularis oris in the control group at R0, notably between the 30%RM and 70%RM, and 50%RM and 70%RM conditions. Conversely, in the experimental group, there were no significant differences in BF at R0. There was no significant difference between the groups in terms of BF in the R0 recovery period.
Figure 7.
Changes in BF between the rest and recovery periods. Data are mean ± SD of the change in BF in the superior and inferior orbicularis oris muscle between the rest and recovery periods in (a) the Control group and (b) the Experimental group. RP: rest period; R0, R1, R2, R3, and R4 correspond to the periods at 0–5 s, 6–10 s; 11–15 s, 16–20 s, and 21–25 s after exercise, respectively. *P < 0.05 denotes a significant difference between RP and the groups indicated.
Discussion
Our study is, to our knowledge, the first to show a significant difference in the rate of change in BF to the inferior orbicularis oris muscle during graded exertion between subjects with and without LI. Moreover, we have shown that the increased BF during the recovery period of both orbicularis oris muscles is more prolonged in the control group than in the experimental group.
Measurement conditions
It has been reported in previous studies that the orientation and position of the electrodes affects the reproducibility of EMG measurements. Thus, in this study, the positioning of the bipolar electrodes was in accordance with that described in previous studies to allow direct comparison (9, 11, 34, 35). A recent study documents the optimal placement strategy for monopolar electrodes in the inferior orbicularis oris, but not for the superior oris (36). Comparing our study and this previous report, the centre of the bipolar electrodes for the inferior orbicularis oris muscle was within the optimal range in the horizontal position, but not for vertical or angular positions. This was largely unavoidable since the vertical and angular position of the electrodes was dependent on the position of the lower lip vermilion, and placement was restricted by the need to not overlap the lower lip. Previous study noted high inter-individual variability in electrode placement relative to muscle fibre orientation and position in the inferior orbicularis oris muscle. Thus, in this study, a single examiner positioned the electrodes to maintain consistency in electrode positioning relative to muscle fibre orientation.
Several previous studies have reported investigations of BF measurements in muscle of the extremities, but only of these used the laser speckle imager (11). Our study thus used an identical protocol to that study to measure muscle BF in the orbicularis oris. When using laser speckle imaging to measure BF, it is necessary to ensure that the resting BF is stable before measurement, and that the patient makes no distinct movements during measurement (37). We confirmed the position of the ROIs in accordance with a previous study that used laser Doppler perfusion imaging (11). In our pilot study, we evaluated the accuracy and reliability of BF and EMG activities on both sides and found no significant difference.
Previous studies have suggested that EMG activity in the superior orbicularis oris muscle increases in subjects with LI, a large overjet and an anterior open bite (38). Conversely, others have reported that EMG activity in superior orbicularis oris muscle is not correlated with overjet, overbite, or incisor inclination in subjects with a Class II malocclusion (39). In the present study, the sample contained no subjects with any open bite, and there were no significant differences in the average overbite in each group. Although the overjet in the experimental group was significantly greater than that in the control group, there were no significant differences in BF and EMG activity between the groups during the rest period, indicating that the overjet has negligible impact on these parameters.
BF and EMG activity during orbicularis oris muscle exercise
In the control group, the BF and EMG activity of the superior and inferior orbicularis oris were significantly different at each load condition, with the general trend being that BF and EMG activity were positively correlated with the load. However, in the experimental group, although there were significant differences in EMG activity of the superior and inferior orbicularis oris muscles between some load conditions, this was not the case for BF between the 50%RM and 70%RM groups (i.e. in high load conditions) for the inferior orbicularis oris. Significant differences were found in the rate of change in BF to the inferior orbicularis oris between the 70%RM and 30%RM groups, and between the 70%RM and 50%RM groups. In peripheral skeletal muscles, it is known that BF changes in response to muscular contraction relative to muscular fatigue (18). Douglas et al. (40) reported that rapid muscle fatigue during training results from reduced BF. Moreover, Sugaya et al. (27) measured changes in BF and muscle fatigue in different loading conditions and concluded there were significant negative correlations between muscle fatigue and the rate of change in BF volume. They stated that muscle fatigue increased in subjects where muscle BF was inadequate relative to the load exerted. Thus, it is suggested that rapid muscle fatigue in the inferior orbicularis oris of subjects with LI in high-load conditions might be caused by reduced blood supply rather than reduced effort. In this study, the significant difference in the rate of change in BF during graded exertion between subjects with and without LI was observed only in the inferior orbicularis oris muscle. Previous studies have suggested that the lower lip plays an active role in lip sealing while the upper lip plays a passive role in anterior lip sealing (41, 42). Another study noted that additional effort was needed in the inferior orbicularis oris muscles to hold the lips in contact in subjects with LI (9). Accordingly, the inferior orbicularis oris muscle may be more fatigable than superior orbicularis oris muscle.
BF during the recovery period
Generally, BF during the rest period after a period of loading rapidly restores baseline levels of metabolites such as lactic acid (40, 43). Several previous studies have characterized BF to peripheral skeletal during recovery (17–19) and found that—in the quadriceps muscle—load-tolerant muscles are more congested and have more prolonged increases in BF during rest than that recorded in load-intolerant muscles (18, 19). In the present study, BF to all orbicularis oris muscles during the recovery period was more prolonged in the control group than in the experimental group. Therefore, our study suggests that orbicularis oris muscles in the control group are more load-tolerant than those in the experimental group. Thus, subjects with LI appear to exhibit low endurance and rapid fatigue in their inferior orbicularis oris muscles compared with those subjects without LI, whose muscles are relatively load-tolerant and slow to fatigue. Furthermore, this correlation indicates that the measurement of BF during exertion and recovery (e.g. capacity of muscle) may be valid for the assessment of treatment outcomes following myofunctional therapy (MFT).
Limitations
The sample used here was controlled for malocclusion (including open bite) to eliminate this type of confounding effect. Moreover, we acknowledge that the regulation of orbicularis oris muscle activity is multi-factorial, being differentially influenced by oral habits, occlusal conditions, and the vertical and sagittal facial dimensions. It remains unclear whether BF in subjects with LI is improved by MFT, and further studies are required to clarify the relative influence of morphological (i.e. maxillofacial anatomy) and functional (i.e. BF and EMG activity) factors pre- and post-MFT.
Conclusions
We found significant differences in the rate of change in BF to the inferior orbicularis oris during graded exertion between subjects with and without LI. Moreover, the prolongation of BF during the recovery period in the control group relative to that in the experimental group leads us to conclude that BF is a key factor in endurance and fatigue in the orbicularis oris muscles and is thus a relevant determinant of lip competency.
Funding
This study was supported by Grants-in-Aid for Scientific Research Projects from the Japan Society for the Promotion of Science (#25862001, #16K11801, and #26713055).
Conflict of interest
The authors declare no potential conflicts of interest with respect to the authorship and/or publication of this article.
Acknowledgements
The authors thank Ms Masako Akiyama (University Research Administration Office, Tokyo Medical and Dental University, Tokyo, Japan) for her advices of statistical analysis in this article.
References
- 1. Moyers R. (1988)Handbook of Orthodontics 1988. Year Book Medical Publishers, Boca Raton, FL. [Google Scholar]
- 2. Weinstein S., Haack D.C., Morris L.Y., Snyder B.B. and Attaway H.E (1963)On an equilibrium theory of tooth position. Angle Orthodontist, 33, 1–26. [Google Scholar]
- 3. Foster T.D. (1990)Textbook of Orthodontics. Blackwell Scientific Publications, Oxford, UK. [Google Scholar]
- 4. Rogers A.P. (1918)Muscle training and its relation to orthodontia. International Journal of Orthodontics, 4, 555–557. [Google Scholar]
- 5. Zickefoose W.E. and Hanson M.L (1974)Oral Myotherapy. O.M.T.Materials, Sacramento, CA. [Google Scholar]
- 6. Zickefoose W.E. (1980)Techniques of Oral Myofunctional Therapy. O.M.T.Materials, Sacramento, CA. [Google Scholar]
- 7. Gustafsson M. and Ahlgren J (1975)Mentalis and orbicularis oris activity in children with incompetent lips: an electromyographic and cephalometric study. Acta Odontologica, 33, 355–363. [Google Scholar]
- 8. Tomiyama N., Ichida T. and Yamaguchi K (2004)Electromyographic activity of lower lip muscles when chewing with the lips in contact and apart. The Angle Orthodontist, 74, 31–36. [DOI] [PubMed] [Google Scholar]
- 9. Yamaguchi K., Morimoto Y., Nanda R.S., Ghosh J. and Tanne K (2000)Morphological differences in individuals with lip competence and incompetence based on electromyographic diagnosis. Journal of Oral Rehabilitation, 27, 893–901. [DOI] [PubMed] [Google Scholar]
- 10. Tosello D.O., Vitti M. and Berzin F (1998)EMG activity of the orbicularis oris and mentalis muscles in children with malocclusion, incompetent lips and atypical swallowing–part I. Journal of Oral Rehabilitation, 25, 838–846. [DOI] [PubMed] [Google Scholar]
- 11. Dei A., Miyamoto J.J., Takada J., Ono T. and Moriyama K (2016)Evaluation of blood flow and electromyographic activity in the perioral muscles. European Journal of Orthodontics, 38, 525–531. [DOI] [PubMed] [Google Scholar]
- 12. Ooya W., Kaneko T., Handa K. and Iida J (2008)Orbicularis oris muscle training: Oxygenation in the orbicularis oris muscle using near-infrared spectroscopy. Hokkaido Journal of Dental Science, 29, 129–138. [Google Scholar]
- 13. Ooya W., Kaneko T., Handa K. and Iida J (2009)Training methods effectively in the strength and endurance of the orbicularis oris muscle. Journal of Japanese Society of Stomatognathic Function, 15, 131–138. [Google Scholar]
- 14. Ohtsuka M., Kaneko T. and Iida T (2015)Effectiveness of training methods to improve orbicularis oris muscle endurance in patients with incompetence lips. Orthod Waves, 74, 99–104. [Google Scholar]
- 15. Monteiro A.A. and Kopp S (1988)Estimation of blood flow by 133Xe clearance in human masseter muscle during rest, endurance of isometric contraction, and recovery. Archives of Oral Biology, 33, 561–565. [DOI] [PubMed] [Google Scholar]
- 16. Kitamura K. (1986)Effect of muscular endurance training on forearm blood flow during and after rhythmic contraction. Journal of Sports Medicine and Physical Fitness, 35, 127–133. [Google Scholar]
- 17. Kagaya A. (2001)Muscle blood flow during exercise in man. Japanese Society of Physical Education, 46, 429–442. [Google Scholar]
- 18. Ajisaka R., Watanabe S., Toyama M., Matsuda M. and Yamaguchi I (2002)Changes in blood volume in the muscles of the thigh and calf during exercise and recovery and their relationships to exercise tolerance in patients with cardiac disease. Journal of Cardiology, 40, 95–102. [PubMed] [Google Scholar]
- 19. Chance B., Dait M.T., Zhang C., Hamaoka T. and Hagerman F (1992)Recovery from exercise-induced desaturation in the quadriceps muscles of elite competitive rowers. The American Journal of Physiology, 262, C766–C775. [DOI] [PubMed] [Google Scholar]
- 20. Thomas L.S., et al. (2008)Stedman’s Mosby’s Medical Dictionary for Health Professions and Nursing. 6th edn. Lippincott Williams & Wilkins, Wolters Kluwer. [Google Scholar]
- 21. Bigland-Ritchie B. and Woods J.J (1984)Changes in muscle contractile properties and neural control during human muscular fatigue. Muscle & Nerve, 7, 691–699. [DOI] [PubMed] [Google Scholar]
- 22. Kagaya A. and Homma S (1997)Brachial arterial blood flow during static handgrip exercise of short duration at varying intensities studied by a Doppler ultrasound method. Acta Physiologica Scandinavica, 160, 257–265. [DOI] [PubMed] [Google Scholar]
- 23. Visser B., Nielsen P.K., de Kraker H., Smits M., Jensen B.R., Veeger D. and van Dieën J.H (2006)The effects of shoulder load and pinch force on electromyographic activity and blood flow in the forearm during a pinch task. Ergonomics, 49, 1627–1638. [DOI] [PubMed] [Google Scholar]
- 24. Laaksonen M.S., Kalliokoski K.K., Kyröläinen H., Kemppainen J., Teräs M., Sipilä H., Nuutila P. and Knuuti J (2003)Skeletal muscle blood flow and flow heterogeneity during dynamic and isometric exercise in humans. American Journal of Physiology, 284, H979–H986. [DOI] [PubMed] [Google Scholar]
- 25. Wilson J.R., Martin J.L., Schwartz D. and Ferraro N (1984)Exercise intolerance in patients with chronic heart failure: role of impaired nutritive flow to skeletal muscle. Circulation, 69, 1079–1087. [DOI] [PubMed] [Google Scholar]
- 26. McNeil C.J., Allen M.D., Olympico E., Shoemaker J.K. and Rice C.L (2015)Blood flow and muscle oxygenation during low, moderate, and maximal sustained isometric contractions. American Journal of Physiology, Regulatory, Integrative and Comparative Physiology, 309, R475–R481. [DOI] [PMC free article] [PubMed] [Google Scholar]
- 27. Sugaya M., Sakamaki M., Ozaki H., Ogasawara R., Sato Y., Yasuda T. and Abe T (2011)Influence of decreased muscular blood flow induced by external compression on muscle activation and maximal strength after a single bout of low-intensity exercise. Japan Journal of Physical Education, Health and Sport Sciences, 56, 481–489. [Google Scholar]
- 28. Littlewood S.J., Kandasamy S. and Huang G (2017)The influence of incompetent lip seal on the growth and development of craniofacial complex. Australian Dental Journal, 62, 51–57. [DOI] [PubMed] [Google Scholar]
- 29. Drevensek M., Stefanac-Papić J. and Farcnik F (2005)The influence of incompetent lip seal on the growth and development of craniofacial complex. Collegium Antropologicum, 29, 429–434. [PubMed] [Google Scholar]
- 30. Cohen J. (1992)A power primer. Psychological Bulletin, 112, 155–159. [DOI] [PubMed] [Google Scholar]
- 31. Faul F., Erdfelder E., Buchner A. and Lang A.G (2009)Statistical power analyses using G*Power 3.1: tests for correlation and regression analyses. Behavior Research Methods, 41, 1149–1160. [DOI] [PubMed] [Google Scholar]
- 32. Schinkel-Ivy A., DiMonte S. and Drake J.D (2015)Repeatability of kinematic and electromyographical measures during standing and trunk motion: how many trials are sufficient?Journal of Electromyography and Kinesiology, 25, 232–238. [DOI] [PubMed] [Google Scholar]
- 33. Hidalgo B., Gilliaux M., Poncin W. and Detrembleur C (2012)Reliability and validity of a kinematic spine model during active trunk movement in healthy subjects and patients with chronic non-specific low back pain. Journal of Rehabilitation Medicine, 44, 756–763. [DOI] [PubMed] [Google Scholar]
- 34. Lapatki B.G., Stegeman D.F. and Jonas I.E (2003)A surface EMG electrode for the simultaneous observation of multiple facial muscles. Journal of Neuroscience Methods, 123, 117–128. [DOI] [PubMed] [Google Scholar]
- 35. Radeke J., van Dijk J.P., Holobar A. and Lapatki B.G (2014)Electrophysiological method to examine muscle fiber architecture in the upper lip in cleft-lip patients. Journal of Orofacial Orthopedics, 75, 51–61. [DOI] [PubMed] [Google Scholar]
- 36. Lapatki B.G., Oostenveld R., Van Dijk J.P., Jonas I.E., Zwarts M.J. and Stegeman D.F (2010)Optimal placement of bipolar surface EMG electrodes in the face based on single motor unit analysis. Psychophysiology, 47, 299–314. [DOI] [PubMed] [Google Scholar]
- 37. Larsson S.E., Cai H., Zhang Q., Larsson R. and Oberg P.A (1995)Microcirculation in the upper trapezius muscle during sustained shoulder load in healthy women–an endurance study using percutaneous laser-Doppler flowmetry and surface electromyography. European Journal of Applied Physiology and Occupational Physiology, 70, 451–456. [DOI] [PubMed] [Google Scholar]
- 38. Lowe A.A. (1980) Correlations between orofacial muscle activity and craniofacial morphology in a sample of control and anterior open-bite subjects. American Journal of Orthodontics, 78, 89–98. [DOI] [PubMed] [Google Scholar]
- 39. Kilic N. (2010) Associations between upper lip activity and incisor position. Australian Orthodontic Journal, 26, 56–60. [PubMed] [Google Scholar]
- 40. Douglas B.M., et al. (2007)ACSM’s Primary Care Sports Medicine.2nd edn. American College of Sports Medicine. [Google Scholar]
- 41. Simpson M.M. (1976)Lip incompetence and its relationship to skeletal and dental morphology–an electromyographic investigation. British Journal of Orthodontics, 3, 177–179. [DOI] [PubMed] [Google Scholar]
- 42. Yemm R., El-Sharkawy M. and Stephens C.D (1978)Measurement of lip posture and interaction between lip posture and resting face height. Journal of Oral Rehabilitation, 5, 391–402. [DOI] [PubMed] [Google Scholar]
- 43. Frontera W.R., et al. (2010)Delisa’s Physical Medicine & Rehabilitation: Principles and Practice. 5th edn. Lippincott Williams & Wilkins, Wolters Kluwer, 616. [Google Scholar]


