

Abstract
Background
The empirical dietary inflammatory pattern (EDIP) score has been associated with concentrations of circulating inflammatory biomarkers in European Americans.
Objective
We used the EDIP score, a weighted sum of 18 food groups that characterizes dietary inflammatory potential based on circulating concentrations of inflammatory biomarkers, to test the hypothesis that a pro-inflammatory dietary pattern is associated with inflammatory biomarker concentrations in a US multi-ethnic population.
Methods
In this cross-sectional study, we calculated EDIP scores using baseline food frequency questionnaire data from 31,472 women, aged 50–79 y, in the Women's Health Initiative observational study and clinical trials. Circulating biomarkers outcomes at baseline were: C-reactive protein (CRP), interleukin-6 (IL-6), tumor necrosis factor (TNF)-α, TNF receptor (TNFR) 1 and 2, and adiponectin. We used multivariable-adjusted linear regression analyses to estimate absolute concentrations and relative differences in biomarker concentrations, overall and in subgroups of race/ethnicity and BMI (body mass index) categories.
Results
Independent of energy intake, BMI, physical activity, and other potential confounding variables, higher EDIP scores were significantly associated with higher (lower for adiponectin) absolute concentrations of all 6 biomarkers. On the relative scale, the percentage of difference in the concentration of biomarkers, among women in the highest compared to the lowest EDIP quintile, was: CRP, +13% (P-trend < 0.0001); IL-6, +15% (P-trend < 0.0001); TNF-α, +7% (P-trend = 0.0007); TNFR1, +4% (P-trend = 0.0009); TNFR2, +5% (P-trend < 0.0001); and adiponectin, −13% (P-trend <0.0001). These associations differed by racial/ethnic groups and by BMI categories. Whereas the absolute biomarker concentrations were lower among European-American women and among normal-weight women, the associations with diet were stronger than among women of African-American or Hispanic/Latino origin and among overweight and obese women.
Conclusions
Findings demonstrate the successful replication of an empirical hypothesis-oriented a posteriori dietary pattern score in a multi-ethnic population of postmenopausal women, with subgroup differences by race/ethnicity and body weight. Future research needs to apply the score in non-US populations.
Keywords: empirical dietary inflammatory pattern, inflammatory biomarkers, validation, dietary patterns
Introduction
Clinical and epidemiologic data suggest that inflammatory responses play an important role in the development and progression of many chronic diseases including cancer (1, 2), cardiovascular disease (3, 4), diabetes (5), and dementia (6), among other diseases. For example, prospective studies have found significantly higher concentrations of C-reactive protein (CRP) and ILs in those who developed cancer than in those who did not (7–9). Diet is known to influence the development of these chronic diseases, and intervention studies have shown that diet modulates inflammation (10–12). For example, in a meta-analysis to determine the effect of healthy dietary patterns on biomarkers associated with adiposity, insulin resistance, and inflammation in adults, consumption of a healthy dietary pattern was associated with significantly lower CRP concentrations (12). Dietary patterns associated with inflammation may therefore influence chronic disease outcomes (13, 14).
We previously developed the empirical dietary inflammatory pattern (EDIP) score to identify the dietary components that explain maximal variation in inflammatory biomarkers (15). The EDIP is a food-based index that characterizes the inflammatory potential of diet based on circulating concentrations of inflammatory biomarkers, and its relative validity has been evaluated in 2 independent cohorts of health professionals: the Nurses’ Health Study (NHS)-II and Health Professionals Follow-up Study (HPFS) (15, 16). These 2 studies comprised mainly European-American women and men, respectively, therefore it is important to evaluate the association of the EDIP score and circulating inflammatory biomarkers in a multiracial/ethnic population. In contrast to a priori indexes that define dietary patterns based on the prevailing scientific knowledge [e.g., the Dietary Approaches to Stop Hypertension (DASH) meal plan, the alternative Healthy Eating Index-2010], the EDIP is a hypothesis-oriented a posteriori index: its development is data-driven and focused on identifying a dietary pattern predictive of biological markers of inflammation. In the current cross-sectional study, we evaluated whether the EDIP score, calculated using dietary data from the Women's Health Initiative (WHI) baseline FFQ, is associated with concentrations of circulating inflammatory biomarkers at baseline. Additionally, we investigated the association of the EDIP score with inflammatory biomarkers in subgroups defined by race/ethnicity and by BMI.
Methods
Study population
The WHI enrolled 161,808 postmenopausal women 50–79 y old with a predicted >3 y survival in 40 sites in the United States between 1993 and 1998 (17). Participants were enrolled into an observational study (OS) or ≥1 of 4 clinical trials. The full WHI-OS consisted of 93,676 postmenopausal women not eligible or unwilling to participate in the clinical trials. The clinical trial components included the dietary modification trial; the hormone therapy trial, which included an estrogen-plus-progestin study of women with a uterus and the estrogen-alone study of women without a uterus; and the calcium and vitamin D trial (17). Women of racial or ethnic minority groups represented 17.1% of the overall WHI sample.
At the baseline clinic visit, certified staff drew blood samples and performed physical measurements including blood pressure, height, and weight. For the current study, we pooled 35,720 participants with inflammatory biomarker data at baseline. We excluded women with implausible energy values (≤600 kcal/d or ≥5000 kcal/d, n = 1668), very high CRP values (≥10 mg/L, n = 2419), and very low or very high BMI values (in kg/m2; <15 or >50, n = 161), leaving an analytic sample of 31,472 (52.6% in the observational study and 47.4% in the clinical trials). The WHI protocol was approved by the institutional review boards at the Clinical Coordinating Center at the Fred Hutchinson Cancer Research Center in Seattle, WA, and at each of the 40 Clinical Centers (17). The current study was approved by the institutional review board at the Brigham and Women's Hospital.
Dietary assessment and calculation of the EDIP score
During screening for the WHI, all participants completed a self-administered 122-item FFQ developed for the WHI to estimate average daily dietary intake over the previous 3-mo period. This served as the baseline measure. FFQ data were considered complete if all adjustment questions, all summary questions, 90% of the foods, and at least one-half of every food group section was completed (17, 18). The WHI FFQ has produced results reasonably comparable to those from four 24-h dietary recall interviews and 4 d of food diaries recorded within the WHI (19).
The development of the EDIP score in the NHS (15) and its validation in the NHS-II and HPFS have been described (15, 16). The goal was to empirically create a score for overall inflammatory potential of whole diets defined using food groups. Thirty-nine predefined food groups (20) were entered into reduced rank regression models followed by stepwise linear regression analyses to identify a dietary pattern most predictive of 3 plasma inflammatory biomarkers: CRP, IL-6, and TNF receptor (TNFR) 2 (15). The EDIP score is the weighted sum of 18 food groups, and assesses the inflammatory potential of diets on a continuum from maximally anti-inflammatory to maximally pro-inflammatory, with lower (more negative) scores indicating anti-inflammatory diets and higher (more positive) scores indicating pro-inflammatory diets. We applied the EDIP component weights developed in the NHS to calculate EDIP scores for each participant based on the WHI baseline FFQ data.
The 18 food groups comprising the EDIP score are the following: intakes of processed meat, red meat, organ meat, fish (other than dark-meat fish), other vegetables (i.e., vegetables other than green leafy vegetables and dark yellow vegetables), refined grains, high-energy beverages (cola and other carbonated beverages with sugar, fruit drinks), low-energy beverages (low-energy cola and other low-energy carbonated beverages—the WHI FFQ did not assess low-energy beverages), and tomatoes were positively related to concentrations of the inflammatory biomarkers. Intakes of beer, wine, tea, coffee, dark-yellow vegetables (comprising carrots, yellow squash, and sweet potatoes), green leafy vegetables, snacks (popcorn, corn chips, potato chips, crackers), fruit juice, and pizza were inversely related to concentrations of the inflammatory biomarkers (15). The specific foods in the WHI FFQ for each food group component are listed in footnote 3 of Table 1.
TABLE 1.
Baseline characteristics of study participants in quintiles of the EDIP score in postmenopausal women, Women's Health Initiative, 1993–19981
| EDIP2,3 quintiles | |||||
|---|---|---|---|---|---|
| Quintile 1 | Quintile 2 | Quintile 3 | Quintile 4 | Quintile 5 | |
| (−10.01 to −0.63) | (−0.63 to −0.04) | (−0.04 to 0.39) | (0.39 to 0.86) | (0.86 to 6.65) | |
| Characteristic | n = 6853 | n = 6854 | n = 6854 | n = 6854 | n = 6854 |
| Race/ethnicity, % | |||||
| American Indian or Alaskan Native | 1.6 | 1.3 | 1.7 | 1.7 | 1.8 |
| Asian or Pacific Islander | 1.2 | 1.9 | 2.1 | 3.1 | 3.6 |
| African American | 13.0 | 17.2 | 23.0 | 30.9 | 36.2 |
| Hispanic/Latino | 5.4 | 6.9 | 8.5 | 11.4 | 20.1 |
| European American | 78.7 | 72.5 | 64.6 | 52.5 | 38.2 |
| Other | 0.1 | 0.1 | 0.2 | 0.3 | 0.1 |
| BMI, kg/m2 | 27.3 ± 5.2 | 27.7 ± 5.2 | 28.1 ± 5.3 | 28.7 ± 5.6 | 29.9 ± 6.1 |
| Overweight/obese (BMI ≥25), % | 62.5 | 66.0 | 68.5 | 72.5 | 78.5 |
| Diabetic, % | 5.1 | 6.2 | 7.2 | 9.7 | 11.1 |
| Circulating inflammatory markers4 | |||||
| CRP, mg/L | 1.88 ± 1.23 | 2.01 ± 1.22 | 2.16 ± 1.20 | 2.36 ± 1.20 | 2.69 ± 1.18 |
| IL-6, pg/mL | 1.55 ± 1.08 | 1.70 ± 1.09 | 1.72 ± 1.12 | 1.79 ± 1.09 | 2.05 ± 1.15 |
| TNF-α, pg/mL | 1.23 ± 0.82 | 1.22 ± 0.76 | 1.27 ± 0.77 | 1.32 ± 0.87 | 1.32 ± 0.86 |
| TNFR1, ng/mL | 1.40 ± 0.56 | 1.45 ± 0.57 | 1.46 ± 0.57 | 1.44 ± 0.60 | 1.43 ± 0.59 |
| TNFR2, ng/mL | 2.59 ± 0.57 | 2.64 ± 0.57 | 2.66 ± 0.58 | 2.66 ± 0.58 | 2.66 ± 0.59 |
| Adiponectin, μg/mL | 7.54 ± 0.76 | 6.89 ± 0.78 | 6.42 ± 0.75 | 6.36 ± 0.77 | 5.64 ± 0.77 |
| Age at screening, y | 65.4 ± 7.1 | 65.5 ± 7.2 | 65.3 ± 7.3 | 64.5 ± 7.4 | 62.8 ± 7.4 |
| Physical activity, MET-h/wk | 9.1 ± 11.8 | 8.4 ± 11.4 | 7.3 ± 10.4 | 6.6 ± 10.5 | 5.5 ± 9.5 |
| Alcohol,5 servings/wk | 4.8 ± 8.1 | 2.4 ± 4.3 | 1.6 ± 3.4 | 1.1 ± 2.9 | 0.7 ± 2.4 |
| Total energy intake, kcal/d | 1719 ± 640 | 1566 ± 572 | 1503 ± 590 | 1467 ± 615 | 1768 ± 809 |
| Dietary fiber, g/d | 17.8 ± 7.2 | 16.3 ± 6.7 | 15.3 ± 6.4 | 14.2 ± 6.5 | 15.0 ± 7.5 |
| Dietary calcium, mg/d | 909 ± 514 | 813 ± 439 | 756 ± 421 | 705 ± 420 | 740 ± 455 |
| Dietary vitamin D, μg/d | 4.7 ± 3.7 | 4.3 ± 3.1 | 4.1 ± 2.9 | 3.9 ± 2.8 | 4.0 ± 3.0 |
| Dietary lycopene, mg/d | 5.15 ± 3.25 | 4.69 ± 2.98 | 4.44 ± 2.94 | 4.25 ± 3.09 | 4.57 ± 3.57 |
| Whole grains, servings/d | 1.28 ± 0.84 | 1.20 ± 0.81 | 1.17 ± 0.80 | 1.13 ± 0.81 | 1.3 ± 1.0 |
| Aspirin/NSAID user, % | 59.6 | 57.4 | 56.1 | 54.2 | 53.4 |
| Educational level, % | |||||
| Some high school or lower educational level | 4.0 | 4.9 | 6.1 | 9.2 | 14.6 |
| High school graduate/some college or associate degree | 53.4 | 55.4 | 57.2 | 58.8 | 58.9 |
| ≥4 y of college | 42.6 | 39.7 | 36.7 | 32.0 | 26.5 |
| Smoking status, % | |||||
| Never | 41.8 | 49.4 | 52.1 | 56.6 | 57.9 |
| Former | 48.0 | 43.0 | 39.9 | 35.7 | 33.2 |
| Current | 10.2 | 7.6 | 8.0 | 7.7 | 8.9 |
| Menopausal hormone use, % | |||||
| Unopposed estrogen use, ever | 29.4 | 32.1 | 32.0 | 33.2 | 30.3 |
| Estrogen plus progestin use, ever | 18.5 | 17.8 | 17.4 | 15.6 | 14.8 |
1Values are percentages or means ± SDs. All biomarker values were back-transformed (ex) since biomarker data were ln-transformed prior to analyses. CRP, C-reactive protein; EDIP, empirical dietary inflammatory pattern score; MET-h, metabolic equivalent hours; NSAID, nonsteroidal anti-inflammatory drugs; TNFR, TNF receptor; WHI, Women's Health Initiative.
2EDIP scores were adjusted for total energy intake using the residual method. Lower (more negative) EDIP scores indicate anti-inflammatory diets whereas higher (more positive) scores indicate pro-inflammatory diets.
3The EDIP component foods (servings/d) in the WHI were as follows: processed meat (hot dogs, chorizo, other sausage, bacon, breakfast sausage, scrapple; lunch meat such as ham, turkey; other lunch meat such as bologna); red meat (ground meat including hamburgers, beef, pork, and lamb as a main dish or as a sandwich; stew, pot pie, and casseroles with meat; gravies made with meat drippings); organ meat (liver, including chicken liver; other organ meats); fish other than dark-meat fish (fried fish, shrimp, lobster, crab and oysters, canned tuna, tuna salad, and tuna casserole, white fish such as sole, snapper, cod); other vegetables (i.e., vegetables other than green leafy vegetables and dark yellow vegetables: red peppers and red chilies, green peppers, green chilies, jalapenos, and green chili salsa, corn, and hominy); refined grains (total grain variable minus whole grain variable, both WHI-computed food groups); high-energy beverages [all regular (not diet) soft drinks]; low-energy beverages (the WHI FFQ did not assess low-energy beverages); tomatoes (fresh tomato, tomato juice, tomato sauce, cooked tomato, salsa and salsa picante); beer (all types); wine (red wine, white wine); coffee or tea (all types); dark-yellow vegetables (carrots, including mixed dishes with carrots; summer squash, zucchini, nopales, and okra; winter squash, such as acorn, butternut, and pumpkin; sweet potatoes and yams; other potatoes, cassava, and yucca—boiled, baked, or mashed); green leafy vegetables (cooked greens such as spinach, mustard greens, turnip greens, collards; lettuce and plain lettuce salad; mixed lettuce or spinach salad with vegetables); pizza (low-fat pizza; other pizza); fruit juice (orange juice and grapefruit juice; other fruit juices such as apple and grape); snacks (snacks such as potato chips, corn chips, tortilla chips, Ritz and cheese crackers; saltines, Snackwell’s, fat-free tortilla chips and fat-free potato chips; popcorn).
4Numbers of participants with biomarker data were different for each biomarker as follows: CRP, n = 17,379; IL-6, n = 7218; TNF-α, n = 4854; TNFR1, n = 5042; TNFR2, n = 9369; adiponectin, n = 3105; total n = 31,472 women.
5Alcohol serving was the sum of: beer (1 glass, 1 bottle, or 1 can), wine (4-oz glass of red wine, white wine), and liquor (1 drink or 1 shot whiskey, gin, etc.).
Biomarker assessment
Outcomes for the current study included the following 6 circulating inflammatory biomarkers: CRP, expressed in mg/L; IL-6, expressed in pg/mL; TNF-α, expressed in pg/mL; TNFR1, expressed in ng/mL; TNFR2, expressed in ng/mL; and adiponectin, expressed in μg/mL. CRP was measured using a high-sensitivity immunoturbidimetric assay on the Hitachi 911 (Roche Diagnostics, Indianapolis, IN), using reagents and calibrators from DiaSorin (Stillwater, MN). IL-6 was measured by a quantitative sandwich enzyme immunoassay technique (Quantikine HS Immunoassay Kit). TNF-α, TNFR1, and TNFR2 were measured using an ELISA kit (R&D Systems, Minneapolis, MN), whereas adiponectin was measured using an ELISA kit from Denka Seiken of Tokyo, Japan. The average CVs from blinded quality control samples were: CRP, 2.3%; IL-6, 9.2%; TNF-α, 16.5%; TNFR1, 8.4%; TNFR2, 8.1%; and adiponectin, 10.4%. Statistical calibration was performed to adjust for batch-related variability according to the methods described by Rosner et al. (21). Briefly, a batch effect correction factor was calculated using linear regression to model the association between assay batch and natural log-transformed values of each biomarker. All values were corrected by the batch-specific factor to normalize values across the batches (21).
Covariates
Data on potential confounding variables were collected by self-administered questionnaires on demographics, medical history, and lifestyle factors, as has been previously described (17). Covariates included in the models were the following: total energy intake (kilocalories per day); age at WHI baseline (years); BMI, categorized into normal weight (15 to <25), overweight (25 to <30), and obese (≥30 to ≤50); racial/ethnic groups (American Indian or Alaskan Native, Asian or Pacific Islander, Hispanic/Latino, African American, European American, and other race groups); educational levels, categorized into some high school or lower educational level, high school graduate or some college or associate degree, and ≥4 y of college; smoking status, categorized into current, former, and never; physical activity, calculated by summing the metabolic equivalent-hours (MET-h) for all reported activities for each individual (e.g., walking, aerobics, jogging, tennis, swimming, biking outdoors, exercise machine, calisthenics, popular or folk dancing) (MET-h/wk) (22); diabetes (yes or no); hypertension (yes or no); hypercholesterolemia (yes or no); arthritis (yes or no); colitis (yes or no); regular use of aspirin and other nonsteroidal anti-inflammatory drugs (NSAIDs) (yes or no); regular use of statins (yes or no). Regular use of medications was defined as: ≥2 times in each of the 2 wk preceding the interview. Duration of estrogen use and duration of combined estrogen and progesterone use were both categorized into 5 groups (none, ≤4.9 y, 5–10.0 y, 10.1–14.9 y, and ≥15.0 y); dietary modification trial arm (intervention, control, not randomized to the trial); hormone therapy trial arm (estrogen-alone intervention, estrogen-alone control, combined estrogen and progesterone intervention, estrogen and progesterone control, not randomized to the trial); and calcium and vitamin D arm (intervention, control, not randomized to the trial).
Statistical analysis
We described participants’ characteristics using means ± SDs for continuous variables, and frequencies (percentages) for categorical variables across quintiles of the EDIP score. Given that biomarkers were log-transformed to normalize their distributions prior to analyses, the biomarker values were back-transformed to their original units (i.e., ex, where x is the natural log-transformed biomarker concentration) (23, 24).
To assess the association of EDIP scores with concentrations of biomarkers, we conducted age-adjusted and multivariable-adjusted linear regression analyses to model the natural log of biomarker concentrations as the outcome (or dependent variable) and then back-transformed to obtain an estimate of the absolute concentration in each quintile of the EDIP score, or to obtain the relative change (as percentage of difference) in biomarker concentrations in higher EDIP quintiles compared to the lowest quintile as reference. All multivariable models were adjusted for the potential confounding variables listed in the covariate section, and the model-based absolute and relative biomarker concentrations were calculated via the mean values of the continuous variables and via the reference category of the categorical variables. EDIP scores were adjusted for total energy intake using the residual method, therefore energy intake was not directly included in the multivariable models. We constructed a third model with additional adjustment for BMI (continuous) and diabetes—possible intermediates in the association of dietary inflammatory potential and inflammatory biomarker concentrations. For analyses of linear trend, we used the EDIP quintile medians assigned to each participant, in multivariable-adjusted models and interpreted the P value of the ordinal variable as the P value for linear trend.
Although we have previously examined the association of the EDIP score and inflammatory biomarkers in BMI categories (15, 16), we have not examined potential racial/ethnic differences; therefore we conducted analyses stratified by racial/ethnic groups and by BMI categories to examine associations between the EDIP score and biomarker concentrations, limiting potential confounding by race/ethnicity or potential confounding and mediation by body weight. We conducted these stratified analyses without testing for interaction because the subgroup analyses were preplanned. In all stratified analyses, we adjusted for diabetes and BMI (as a continuous variable) even within BMI strata. In all subgroup analyses we used the same EDIP quintile cutoffs and medians as for the primary analysis, to enhance comparability of findings across subgroups. All analyses were conducted using SAS version 9.4 (SAS Institute, Cary, NC), and all tests were 2-sided. Tests of trend with P < 0.05 were considered statistically significant, whereas for the relative change models, 95% CIs not including 0 were considered to indicate statistically significant findings.
Results
Participant characteristics by EDIP quintiles are shown in Table 1. Women consuming the most anti-inflammatory diets (EDIP quintile 1) showed lower biomarker concentrations (higher for adiponectin) for all biomarkers, and reported higher physical activity levels, higher intakes of dietary fiber, calcium, vitamin D, lycopene, wholegrains, and lower BMI, compared to those consuming the most pro-inflammatory diets (quintile 5). The proportions of overweight or obese women, Asians or Pacific Islanders, African Americans, Hispanic/Latinos, and those with lower educational levels increased across EDIP quintiles (Table 1). The proportion of participants from minority racial/ethnic backgrounds was 38.7% of the total sample for the current study and comprised 24.1% African Americans, 10.5% Hispanics/Latinos, 2.4% Asians/Pacific Islanders, and 1.6% American Indians or Alaskan Natives; the remaining 61.3% were European Americans.
Table 2 shows significantly higher (lower for adiponectin) absolute concentrations of all 6 inflammatory biomarkers in higher EDIP quintiles across all 3 statistical models, including when additionally adjusted for BMI and diabetes. Table 3 presents the same data as are in Table 2 but in a relative format, showing that higher EDIP scores were significantly associated with higher (lower for adiponectin) concentrations of all inflammatory biomarkers, independent of total energy intake, BMI, physical activity, and other potential confounding variables. For example, the percentage of difference (95% CIs) in the concentration of biomarkers among women in the highest compared to the lowest EDIP quintile was higher by: CRP: +13% (+8% to +19%), P-trend <0.0001; IL-6: +15% (+7% to +23%), P-trend <0.0001; TNF-α: +7% (0% to +13%), P-trend = 0.0007; TNFR1: +4% (+1% to +7%), P-trend = 0.0009; TNFR2: +5% (+3% to +8%), P-trend < 0.0001; and adiponectin: –13% (−17% to −6%), P-trend < 0.0001 (Table 3). For CRP and IL-6, additional adjustment for BMI and diabetes in model 3 highly attenuated the percentage of differences in biomarker concentrations, but not so much for the other 4 biomarkers.
TABLE 2.
Multivariable-adjusted absolute mean concentration (95% CI) of circulating inflammatory markers in quintiles of the EDIP score in postmenopausal women1
| EDIP quintiles | ||||||
|---|---|---|---|---|---|---|
| Quintile 1 | Quintile 2 | Quintile 3 | Quintile 4 | Quintile 5 | P-trend2 | |
| CRP, mg/L | ||||||
| Model 1 | 1.89 (1.83, 1.95) | 2.03 (1.97, 2.10) | 2.17 (2.10, 2.34) | 2.36 (2.29, 2.43) | 2.65 (2.57, 2.72) | <0.0001 |
| Model 2 | 2.38 (2.16, 2.61) | 2.50 (2.27, 2.74) | 2.59 (2.36, 2.84) | 2.71 (2.47, 2.98) | 2.93 (2.67, 3.22) | <0.0001 |
| Model 3 | 2.85 (2.60, 3.11) | 2.95 (2.70, 3.23) | 3.02 (2.77, 3.30) | 3.13 (2.86, 3.41) | 3.23 (2.96, 3.53) | <0.0001 |
| IL-6, pg/mL | ||||||
| Model 1 | 1.54 (1.48, 1.61) | 1.69 (1.62, 1.76) | 1.71 (1.64, 1.78) | 1.79 (1.72, 1.86) | 2.08 (2.00, 2.17) | <0.0001 |
| Model 2 | 1.61 (1.32, 1.96) | 1.76 (1.44, 2.15) | 1.74 (1.43, 2.13) | 1.80 (1.47, 2.20) | 2.01 (1.65, 2.45) | <0.0001 |
| Model 3 | 1.90 (1.58, 2.30) | 2.06 (1.70, 2.49) | 2.04 (1.68, 2.46) | 2.04 (1.69, 2.47) | 2.19 (1.81, 2.64) | <0.0001 |
| TNF-α, pg/mL | ||||||
| Model 1 | 1.23 (1.20, 1.27) | 1.22 (1.18, 1.25) | 1.27 (1.23, 1.30) | 1.33 (1.29, 1.37) | 1.34 (1.29, 1.39) | <0.0001 |
| Model 2 | 1.10 (0.99, 1.23) | 1.09 (0.97, 1.21) | 1.13 (1.01, 1.26) | 1.19 (1.07, 1.32) | 1.19 (1.07, 1.33) | <0.0001 |
| Model 3 | 1.14 (1.02, 1.27) | 1.12 (1.00, 1.25) | 1.17 (1.04, 1.30) | 1.22 (1.09, 1.36) | 1.22 (1.09, 1.36) | <0.0001 |
| TNFR1, ng/mL | ||||||
| Model 1 | 1.40 (1.38, 1.43) | 1.44 (1.42, 1.47) | 1.46 (1.43, 1.48) | 1.45 (1.43, 1.48) | 1.45 (1.43, 1.48) | 0.002 |
| Model 2 | 1.31 (1.24, 1.38) | 1.35 (1.28, 1.43) | 1.37 (1.30, 1.45) | 1.37 (1.30, 1.45) | 1.38 (1.30, 1.46) | <0.0001 |
| Model 3 | 1.40 (1.32, 1.47) | 1.44 (1.37, 1.52) | 1.45 (1.38, 1.53) | 1.46 (1.38, 1.54) | 1.45 (1.37, 1.53) | 0.0009 |
| TNFR2, ng/mL | ||||||
| Model 1 | 2.57 (2.53, 2.60) | 2.62 (2.59, 2.66) | 2.66 (2.62, 2.69) | 2.67 (2.63, 2.70) | 2.70 (2.67, 2.73) | <0.0001 |
| Model 2 | 2.41 (2.30, 2.52) | 2.47 (2.36, 2.59) | 2.52 (2.41, 2.64) | 2.54 (2.42, 2.66) | 2.57 (2.46, 2.69) | <0.0001 |
| Model 3 | 2.52 (2.41, 2.64) | 2.59 (2.47, 2.71) | 2.63 (2.51, 2.75) | 2.64 (2.52, 2.76) | 2.65 (2.53, 2.78) | <0.0001 |
| Adiponectin, μg/mL | ||||||
| Model 1 | 7.55 (7.28, 7.83) | 6.89 (6.64, 7.15) | 6.36 (6.14, 6.59) | 6.34 (6.15, 6.62) | 5.68 (5.48, 5.88) | <0.0001 |
| Model 2 | 6.99 (5.86, 8.35) | 6.58 (5.51, 7.86) | 6.20 (5.19, 7.40) | 6.50 (5.46, 7.76) | 6.01 (5.04, 7.17) | <0.0001 |
| Model 3 | 6.14 (5.17, 7.29) | 5.81 (4.89, 6.90) | 5.49 (4.63, 6.52) | 5.80 (4.89, 6.88) | 5.44 (4.59, 6.46) | <0.0001 |
1Values are absolute back-transformed (ex) biomarker concentrations since biomarker data were ln-transformed prior to analyses. Model 1 was adjusted for age at screening only; model 2 was adjusted for covariates in model 1 and for physical activity, educational level, race/ethnicity, income, nonsteroidal anti-inflammatory drug use, statin use, smoking status, duration of postmenopausal hormone use (separately for unopposed estrogen and combined estrogen and progestin), high cholesterol, hypertension, colitis, arthritis, dietary modification trial arm, hormone therapy trial arm, and calcium and vitamin D trial arm; model 3 was adjusted for all covariates in model 2 and for BMI (continuous) and diabetes. The absolute biomarker concentrations were calculated via the mean values of the continuous covariates and via the reference category of the categorical covariates. Numbers of participants with biomarker data were different for each biomarker as follows: CRP, n = 17,379; IL-6, n = 7218; TNF-α, n = 4854; TNFR1, n = 5042; TNFR2, n = 9369; adiponectin, n = 3105; total n = 31,472 women. CRP, C-reactive protein; EDIP, empirical dietary inflammatory pattern; TNFR, TNF receptor.
2The P value for linear trend across EDIP quintiles was the P value of the ordinal variable constructed by assigning quintile medians to all participants in the quintile. Models for linear trend were adjusted for all covariates listed in footnote #1.
TABLE 3.
Multivariable-adjusted percentage of difference (95% CI) in the relative concentrations of circulating inflammatory markers in quintiles of the EDIP score in postmenopausal women1
| EDIP quintiles, % difference (95% CI) | ||||||
|---|---|---|---|---|---|---|
| Quintile 1 (reference) | Quintile 2 | Quintile 3 | Quintile 4 | Quintile 5 | P-trend2 | |
| CRP | ||||||
| Model 1 | 0 | +7 (+2, +13) | +15 (+8, +21) | +25 (+18, +31) | +40 (+33, +47) | <0.0001 |
| Model 2 | 0 | +5 (0, +11) | +9 (+3, +15) | +14 (+8, +20) | +24 (+17, +30) | <0.0001 |
| Model 3 | 0 | +4 (−1, +9) | +6 (+1, +11) | +10 (+5, +15) | +13 (+8, +19) | <0.0001 |
| IL-6 | ||||||
| Model 1 | 0 | +10 (+2, +18) | +11 (+3, +19) | +16 (+8, +25) | +35 (+26, +45) | <0.0001 |
| Model 2 | 0 | +10 (+2, +18) | +9 (+1, +17) | +12 (+4, +21) | +25 (+17, +35) | <0.0001 |
| Model 3 | 0 | +8 (+1, +16) | +7 (0, +14) | +7 (0, +15) | +15 (+7, +23) | <0.0001 |
| TNF-α | ||||||
| Model 1 | 0 | −2 (−6, +4) | +3 (−3, +8) | +7 (+2, +14) | +8 (+2, +15) | <0.0001 |
| Model 2 | 0 | −1 (−4, +4) | +3 (−3, +8) | +8 (+2, +14) | +8 (+2, +15) | <0.0001 |
| Model 3 | 0 | −2 (−7, +4) | +2 (−3, +8) | +7 (+1, +13) | +7 (0, +13) | <0.0001 |
| TNFR1 | ||||||
| Model 1 | 0 | +3 (0, +6) | +4 (+1, +7) | +4 (0, +7) | +4 (+1, +7) | 0.002 |
| Model 2 | 0 | +3 (0, +6) | +5 (+2, +8) | +5 (+2, +8) | +6 (+2, +9) | <0.0001 |
| Model 3 | 0 | +3 (0, +6) | +4 (+1, +7) | +4 (+1, +7) | +4 (+1, +7) | 0.0009 |
| TNFR2 | ||||||
| Model 1 | 0 | +2 (0, +5) | +4 (+1, +6) | +4 (+2, +6) | +5 (+3, +8) | <0.0001 |
| Model 2 | 0 | +3 (+1, +5) | +5 (+2, +7) | +5 (+3, +8) | +7 (+4, +9) | <0.0001 |
| Model 3 | 0 | +3 (0, +5) | +4 (+2, +6) | +5 (+2, +7) | +5 (+3, +8) | <0.0001 |
| Adiponectin | ||||||
| Model 1 | 0 | −9 (−14, −3) | −16 (−21, −10) | −16 (−21, −10) | −25 (−29, −20) | <0.0001 |
| Model 2 | 0 | −6 (−11, 0) | −11 (−17, −6) | −7 (−13, −1) | −14 (−19, −8) | <0.0001 |
| Model 3 | 0 | −5 (−11, 0) | −11 (−14, −5) | −6 (−11, 0) | −13 (−17, −6) | <0.0001 |
1Values are percentages of changes in concentrations of biomarkers, i.e., the relative differences in biomarker concentrations between higher dietary index quintiles and quintile 1 as the reference; e.g., biomarker concentration in quintile 5 minus the concentration in quintile 1. All values were back-transformed (ex) biomarker concentrations since biomarker data were ln-transformed prior to analyses. Model 1 was adjusted for age at screening only; model 2 was adjusted for covariates in model 1 and for physical activity, educational level, race/ethnicity, income, nonsteroidal anti-inflammatory drug use, statin use, smoking status, duration of postmenopausal hormone use (separately for unopposed estrogen and combined estrogen and progestin), high cholesterol, hypertension, colitis, arthritis, dietary modification trial arm, hormone therapy trial arm, and calcium and vitamin D trial arm; model 3 was adjusted for all covariates in model 2 and for BMI and diabetes. The relative biomarker concentrations were calculated via the mean values of the continuous covariates and via the reference category of the categorical covariates. Numbers of participants with biomarker data were different for each biomarker as follows: CRP, n = 17,379; IL-6, n = 7218; TNF-α, n = 4854; TNFR1, n = 5042; TNFR2, n = 9369; adiponectin, n = 3105; for a total n of 31,472 women. CRP, C-reactive protein; EDIP, empirical dietary inflammatory pattern; TNFR, TNF receptor.
2The P value for linear trend across EDIP quintiles was the P value of the ordinal variable constructed by assigning quintile medians to all participants in the quintile. Models for linear trend were adjusted for all covariates listed in footnote #1.
Table 4 presents the absolute concentrations of biomarkers in race/ethnicity categories. Higher EDIP scores were significantly associated with higher (lower for adiponectin) biomarker concentrations among most race/ethnic groups including African Americans, Hispanics/Latinos, and European Americans, though mainly in the CRP, IL-6, and adiponectin models. The significant associations in the TNF-α, TNFR1, and TNFR2 models were mainly among European Americans (Table 4). The percentage of difference in biomarker concentrations between higher EDIP quintiles and the lowest quintile (reference) showed stronger associations of diet and inflammatory biomarkers among European-American women than in women of other racial/ethnic groups (Supplemental Table 1). Figure 1 shows absolute concentrations of CRP, IL-6, and adiponectin in the highest and in the lowest EDIP quintiles. All other racial groups, irrespective of dietary inflammatory potential, tended to have much higher biomarker concentrations than European-American women, though women consuming anti-inflammatory diets had slightly lower concentrations than those consuming pro-inflammatory diets for all racial groups (Figure 1).
TABLE 4.
Multivariable-adjusted absolute mean concentration (95% CI) of circulating inflammatory markers in quintiles of the EDIP score, stratified by race/ethnicity in postmenopausal women1
| EDIP quintiles | |||||||
|---|---|---|---|---|---|---|---|
| Subgroup | n | Quintile 1 | Quintile 2 | Quintile 3 | Quintile 4 | Quintile 5 | P-trend2 |
| CRP, mg/L | 17,379 | ||||||
| American Indian or Alaskan Native | 466 | 3.61 (2.39, 5.47) | 3.86 (2.50, 5.94) | 3.47 (2.30, 5.23) | 2.98 (1.96, 4.52) | 3.21 (2.13, 4.85) | 0.11 |
| African American | 4922 | 2.88 (2.42, 3.42) | 2.82 (2.38, 3.34) | 2.81 (2.38, 3.31) | 2.97 (2.53, 3.49) | 3.01 (2.56, 3.54) | 0.09 |
| Hispanic/Latino | 2487 | 2.52 (2.12, 2.99) | 2.39 (2.02, 2.83) | 2.65 (2.41, 3.14) | 2.76 (2.34, 3.24) | 2.77 (2.36, 3.25) | 0.01 |
| European American | 9504 | 2.31 (2.08, 2.56) | 2.40 (2.16, 2.67) | 2.52 (2.27, 2.80) | 2.57 (2.31, 2.86) | 2.74 (2.45, 3.06) | <0.0001 |
| IL-6, pg/mL | 7218 | ||||||
| Asian or Pacific Islander | 515 | 3.19 (1.38, 7.37) | 3.70 (1.63, 8.42) | 3.14 (1.38, 7.15) | 3.08 (1.37, 6.92) | 3.36 (1.48, 7.62) | 0.73 |
| Hispanic/Latino | 637 | 2.80 (1.18, 6.63) | 2.95 (1.24, 7.00) | 3.35 (1.43, 7.87) | 3.37 (1.46, 7.82) | 3.44 (1.47, 8.03) | 0.03 |
| African American | 1789 | 2.04 (1.22, 3.42) | 2.21 (1.33, 3.68) | 2.20 (1.32, 3.66) | 2.29 (1.37, 3.81) | 2.32 (1.40, 3.85) | 0.02 |
| European American | 4133 | 2.02 (1.67, 2.45) | 2.14 (1.77, 2.59) | 2.16 (1.78, 2.63) | 2.12 (1.75, 2.58) | 2.35 (1.93, 2.86) | 0.001 |
| TNF-α, pg/mL | 4854 | ||||||
| African American | 854 | 1.30 (1.05, 1.61) | 1.27 (1.04, 1.56) | 1.19 (0.97, 1.46) | 1.35 (1.11, 1.64) | 1.25 (1.03, 1.51) | 0.74 |
| European American | 3893 | 1.25 (1.15, 1.37) | 1.22 (1.12, 1.33) | 1.29 (1.18, 1.41) | 1.32 (1.21, 1.44) | 1.37 (1.25, 1.49) | <0.0001 |
| TNFR1, ng/mL | 5042 | ||||||
| Asian or Pacific Islander | 490 | 1.08 (0.90, 1.24) | 1.14 (0.95, 1.36) | 1.07 (0.90, 1.28) | 1.12 (0.94, 1.33) | 1.10 (0.92, 1.30) | 0.88 |
| African American | 909 | 1.49 (1.32, 1.67) | 1.48 (1.32, 1.66) | 1.49 (1.33, 1.67) | 1.47 (1.31, 1.64) | 1.48 (1.32, 1.65) | 0.68 |
| Hispanic/Latino | 584 | 1.49 (1.34, 1.66) | 1.48 (1.34, 1.65) | 1.48 (1.35, 1.63) | 1.55 (1.40, 1.71) | 1.50 (1.36, 1.65) | 0.69 |
| European American | 2855 | 1.54 (1.46, 1.62) | 1.58 (1.51, 1.67) | 1.62 (1.54, 1.71) | 1.63 (1.54, 1.72) | 1.61 (1.52, 1.70) | <0.0001 |
| TNFR2, ng/mL | 9369 | ||||||
| Asian or Pacific Islander | 701 | 2.18 (1.83, 2.60) | 2.09 (1.77, 2.48) | 2.19 (1.85, 2.59) | 2.16 (1.83, 2.55) | 2.20 (1.86, 2.60) | 0.49 |
| African American | 2208 | 2.49 (2.31, 2.69) | 2.49 (2.31, 2.69) | 2.51 (2.33, 2.69) | 2.51 (2.34, 2.70) | 2.50 (2.33, 2.68) | 0.78 |
| Hispanic/Latino | 896 | 2.52 (2.28, 2.80) | 2.69 (2.43, 2.97) | 2.66 (2.43, 2.92) | 2.64 (2.40, 2.89) | 2.62 (2.40, 2.89) | 0.78 |
| European American | 5358 | 2.77 (2.67, 2.89) | 2.85 (2.74, 2.97) | 2.92 (2.80, 3.04) | 2.94 (2.83, 3.07) | 3.00 (2.87, 3.12) | <0.0001 |
| Adiponectin, μg/mL | 3105 | ||||||
| Asian or Pacific Islander | 273 | 6.28 (3.89, 10.2) | 6.15 (3.83, 9.90) | 5.65 (3.55, 9.00) | 5.59 (3.55, 8.80) | 5.27 (3.32, 8.39) | 0.03 |
| African American | 948 | 5.05 (4.06, 6.29) | 4.69 (3.77, 5.83) | 4.50 (3.62, 5.59) | 4.86 (3.93, 6.01) | 4.45 (3.61, 5.50) | 0.03 |
| Hispanic/Latino | 265 | 5.92 (4.78, 7.34) | 6.76 (5.50, 8.31) | 5.64 (4.68, 6.81) | 6.05 (5.07, 7.22) | 5.63 (4.71, 6.74) | 0.23 |
| European American | 1490 | 6.80 (5.98, 7.73) | 6.47 (5.69, 7.36) | 6.13 (5.37, 7.00) | 6.49 (5.67, 7.41) | 6.27 (5.45, 7.20) | 0.01 |
1Values are absolute back-transformed (ex) biomarker concentrations since biomarker data were ln-transformed prior to analyses. All models were adjusted for age at screening, physical activity, educational level, income, nonsteroidal anti-inflammatory drug use, statin use, smoking status, duration of postmenopausal hormone use (separately for unopposed estrogen and combined estrogen and progestin), status of high cholesterol, hypertension, colitis, and arthritis, dietary modification trial arm, hormone therapy trial arm, calcium and vitamin D trial arm, diabetes, and BMI as a continuous variable. The absolute biomarker concentrations were calculated via the mean values of the continuous covariates and via the reference category of the categorical covariates. In the CRP dataset, there was no race/ethnicity category for Asian/Pacific Islander; in the IL-6 dataset there were few (n = 129) American Indians/Alaskan Natives; in the TNF-α dataset, Indians/Alaskan Natives, Asians, and Hispanics totaled only 82; in the TNFR1 and TNFR2 datasets, the number of Indians/Alaskan Natives was 198; and in the adiponectin dataset, the number of Indians/Alaskan Natives was only 128.
2The P value for linear trend across EDIP quintiles was the P value of the ordinal variable constructed by assigning quintile medians to all participants in the quintile. Models for linear trend were adjusted for all covariates listed in footnote #1.
FIGURE 1.
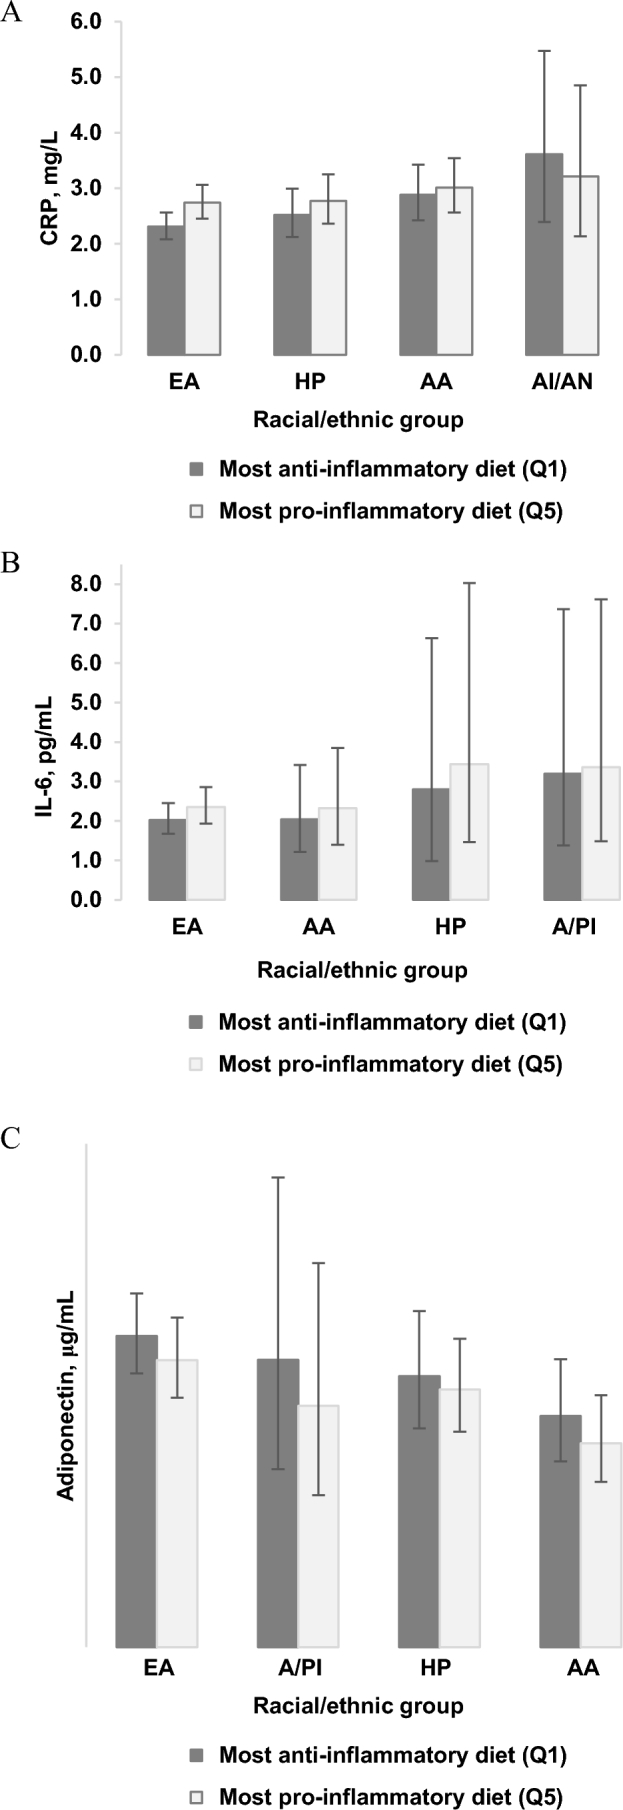
Multivariable-adjusted plasma absolute mean concentration (95% CI) of (A) CRP, (B) IL-6, and (C) ADIPO, in the highest (Q5) and in the lowest (Q1) EDIP quintiles in postmenopausal women. Values are multivariable-adjusted absolute biomarker concentrations calculated in each EDIP quintile via the mean values of the continuous covariates (age at screening, physical activity, BMI) and via the reference category of the categorical covariates (educational level, income level, nonsteroidal anti-inflammatory drug use, statin use, smoking status, duration of postmenopausal hormone use—separately for unopposed estrogen, combined estrogen and progestin, high cholesterol, hypertension, colitis, arthritis, dietary modification trial arm, hormone therapy trial arm, calcium and vitamin D trial arm; model 3, diabetes). n in EDIP quintiles, by race/ethnicity: EA—CRP: Q1 = 2576, Q5 = 1086; IL-6: Q1 = 1058, Q5 = 536; ADIPO: Q1 = 403, Q5 = 165; HP—CRP: Q1 = 297, Q5 = 923; IL-6: Q1 = 59, Q5 = 218; ADIPO: Q1 = 30, Q5 = 65; AA—CRP: Q1 = 506, Q5 = 1384; IL-6: Q1 = 221, Q5 = 520; ADIPO: Q1 = 131, Q5 = 267; AI/AN—CRP: Q1 = 94, Q5 = 95; A/PI—IL-6: Q1 = 50, Q5 = 152; ADIPO: Q1 = 28, Q5 = 76. AA, African American; ADIPO, adiponectin; AI/AN, American Indian/Alaskan Native; A/PI, Asian/Pacific Islander; CRP, C-reactive protein; EA, European American; EDIP, empirical dietary inflammatory pattern; HP, Hispanic/Latino; Q, quintile.
In the BMI-stratified analyses, we additionally adjusted for BMI as a continuous variable, to render the associations completely independent of BMI within the BMI strata. Table 5 presents the absolute concentrations of biomarkers in BMI strata. As expected, the absolute concentration of biomarkers was higher (lower for adiponectin) among obese women than among normal-weight women. In contrast, the trend of higher biomarker concentrations also appeared to be significant or stronger among normal-weight women than among obese women (Table 5). The percentage of difference in biomarker concentrations between higher EDIP quintiles and the lowest quintile (reference) showed stronger associations among normal-weight women (Supplemental Table 2). In Figure 2, we present the absolute biomarker concentrations in the highest and in the lowest EDIP quintiles by BMI category. Generally, obese women consuming pro-inflammatory dietary patterns had much higher (lower for adiponectin) absolute biomarker concentrations for all 6 biomarkers (especially CRP and adiponectin) compared to normal-weight women consuming anti-inflammatory dietary patterns (Figure 2).
TABLE 5.
Multivariable-adjusted absolute mean concentration (95% CI) of circulating inflammatory markers in quintiles of the EDIP score, stratified by BMI categories, Women's Health Initiative1
| EDIP quintiles | |||||||
|---|---|---|---|---|---|---|---|
| Subgroup | n | Quintile 1 | Quintile 2 | Quintile 3 | Quintile 4 | Quintile 5 | P-trend2 |
| CRP, mg/L | 17,379 | ||||||
| Normal weight | 4446 | 2.15 (1.79, 2.58) | 2.23 (1.85, 2.68) | 2.32 (1.98, 2.87) | 2.39 (1.98, 2.87) | 2.59 (2.14, 3.12) | <0.0001 |
| Overweight | 6494 | 2.62 (2.26, 3.04) | 2.68 (2.31, 3.11) | 2.83 (2.45, 3.28) | 2.87 (2.48, 3.32) | 2.98 (2.57, 3.45) | <0.0001 |
| Obese | 6439 | 3.92 (3.41, 4.51) | 3.97 (3.46, 4.57) | 4.03 (3.51, 4.63) | 4.24 (3.69, 4.86) | 4.26 (3.71, 4.89) | 0.001 |
| IL-6, pg/mL | 7218 | ||||||
| Normal weight | 2409 | 1.97 (1.33, 2.91) | 1.96 (1.33, 2.90) | 1.89 (1.28, 2.81) | 1.97 (1.33, 2.91) | 2.22 (1.50, 3.28) | 0.16 |
| Overweight | 2532 | 1.83 (1.28, 2.60) | 1.95 (1.38, 2.77) | 2.07 (1.46, 2.95) | 2.11 (1.48, 2.99) | 2.18 (1.54, 3.09) | <0.0001 |
| Obese | 2277 | 2.25 (1.60, 3.15) | 2.61 (1.87, 3.65) | 2.54 (1.81, 3.54) | 2.47 (1.77, 344) | 2.59 (1.85, 3.61) | 0.02 |
| TNF-α, pg/mL | 4854 | ||||||
| Normal weight | 1859 | 1.12 (0.94, 1.33) | 1.10 (0.92, 1.31) | 1.13 (0.94, 1.34) | 1.18 (0.99, 1.40) | 1.19 (1.00, 1.42) | 0.06 |
| Overweight | 1745 | 1.18 (0.94, 1.47) | 1.14 (0.91, 1.43) | 1.19 (0.95, 1.49) | 1.25 (1.00, 1.56) | 1.21 (0.97, 1.52) | 0.11 |
| Obese | 1250 | 1.14 (0.90, 1.45) | 1.12 (0.88, 1.41) | 1.17 (0.93, 1.48) | 1.23 (0.98, 1.54) | 1.24 (0.98, 1.55) | 0.01 |
| TNFR1, ng/mL | 5042 | ||||||
| Normal weight | 1870 | 1.23 (1.13, 1.35) | 1.26 (1.15, 1.38) | 1.29 (1.18, 1.38) | 1.29 (1.18, 1.41) | 1.31 (1.20, 1.43) | 0.001 |
| Overweight | 1852 | 1.45 (1.33, 1.58) | 1.47 (1.35, 1.60) | 1.50 (1.37, 1.63) | 1.51 (1.39, 1.65) | 1.48 (1.36, 1.61) | 0.13 |
| Obese | 1320 | 1.53 (1.40, 1.67) | 1.60 (1.46, 1.75) | 1.58 (1.44, 1.72) | 1.58 (1.44, 1.72) | 1.56 (1.43, 1.70) | 0.45 |
| TNFR2, ng/mL | 9369 | ||||||
| Normal weight | 3235 | 2.31 (2.14, 2.51) | 2.36 (2.18, 2.55) | 2.42 (2.24, 2.62) | 2.44 (2.25, 2.63) | 2.46 (2.27, 2.66) | <0.0001 |
| Overweight | 1305 | 2.57 (2.40, 2.75) | 2.60 (2.43, 2.79) | 2.62 (2.44, 2.80) | 2.64 (2.47, 2.83) | 2.62 (2.45, 2.80) | 0.07 |
| Obese | 2829 | 2.68 (2.49, 2.85) | 2.76 (2.58, 2.95) | 2.83 (2.65, 3.02) | 2.82 (2.64, 3.01) | 2.84 (2.66, 3.03) | 0.0002 |
| Adiponectin, μg/mL | 3105 | ||||||
| Normal weight | 1190 | 6.54 (5.21, 8.21) | 6.11 (4.87, 7.66) | 5.81 (4.63, 7.28) | 6.16 (4.93, 7.69) | 5.60 (4.46, 7.02) | 0.0005 |
| Overweight | 1115 | 5.74 (4.76, 6.92) | 5.29 (4.39, 6.38) | 4.97 (4.11, 6.01) | 5.39 (4.46, 6.51) | 4.95 (4.10, 5.97) | 0.002 |
| Obese | 800 | 5.24 (4.35, 6.32) | 5.36 (4.44, 6.48) | 4.99 (4.13, 6.03) | 5.09 (4.23, 6.14) | 4.93 (4.11, 5.92) | 0.13 |
1All models were adjusted for age at screening, physical activity, educational level, race/ethnicity, income, nonsteroidal anti-inflammatory drug use, statin use, smoking status, duration of postmenopausal hormone use (separately for unopposed estrogen and combined estrogen and progestin), status of high cholesterol, hypertension, colitis, and arthritis, dietary modification trial arm, hormone therapy trial arm, calcium and vitamin D trial arm, diabetes, and BMI as a continuous variable within each BMI category. The absolute biomarker concentrations were calculated via the mean values of the continuous covariates and via the reference category of the categorical covariates. BMI (kg/m2) categories were defined as follows: normal weight: 15 to <25; overweight: 25 to <30; obese: 30 to ≤50. CRP, C-reactive protein; EDIP, empirical dietary inflammatory pattern; TNFR, TNF receptor.
2The P value for linear trend across EDIP quintiles was the P value of the ordinal variable constructed by assigning quintile medians to all participants in the quintile. Models for linear trend were adjusted for all covariates listed in footnote #1.
FIGURE 2.

Multivariable-adjusted plasma absolute mean concentration (95% CI) of biomarkers in the highest (Q5) and in the lowest (Q1) EDIP quintiles, classified according to BMI (kg/m2) categories (normal weight: 15 to <25; overweight: 25 to <30; obese: 30 to ≤50). The 6 biomarkers included were: (A) CRP (n, normal weight: Q1 = 1112, Q5 = 629; overweight: Q1 = 1338, Q5 = 1184; obese: Q1 = 1023, Q5 = 1670); (B) IL-6 (n, normal weight: Q1 = 572, Q5 = 358; overweight: Q1 = 499, Q5 = 471; obese: Q1 = 348, Q5 = 634); (C) TNF-α (n, normal weight: Q1 = 438, Q5 = 263; overweight: Q1 = 372, Q5 = 319; obese: Q1 = 199, Q5 = 335); (D) TNFR1 (n, normal weight: Q1 = 454, Q5 = 277; overweight: Q1 = 368, Q5 = 351; obese: Q1 = 212, Q5 = 355); (E) TNFR2 (n, normal weight: Q1 = 767, Q5 = 481; overweight: Q1 = 655, Q5 = 623; obese: Q1 = 442, Q5 = 788); (F) adiponectin (n, normal weight: Q1 = 279, Q5 = 185; overweight: Q1 = 214, Q5 = 218; obese: Q1 = 128, Q5 = 218). CRP, C-reactive protein; Q, quintile; TNFR, TNF receptor.
Discussion
We evaluated the association of the EDIP score with concentrations of circulating inflammatory biomarkers, calculated using data from the WHI FFQ. Higher EDIP scores were associated with higher circulating concentrations of CRP, IL-6, TNF-α, TNFR1, and TNFR2, and lower concentrations of adiponectin. These associations differed by racial/ethnic group, with higher absolute concentrations of biomarkers among women of African-American or of Hispanic/Latino origin than among European-American women, but stronger associations with diet among European-American women. Associations also differed by BMI categories, with higher absolute concentrations of biomarkers among overweight and obese women than among normal-weight women, but stronger associations with diet among normal-weight women. This is the first and largest study, to our knowledge, to confirm the association of the EDIP score in a more racially diverse population of older women.
In contrast to the a posteriori approach to defining dietary patterns taken here, a previous study in the WHI took an a priori approach to examine the inflammatory potential of diet by testing associations of the literature-derived, nutrient-based dietary inflammatory index (DII) with baseline inflammatory biomarker data (CRP, IL-6, and TNFR2) in 2600 women. The DII significantly predicted concentrations of IL-6 and TNFR2 but not CRP, after adjusting for multiple confounding factors including BMI and physical activity (25). This previous study included supplements in the calculation of DII scores, which makes direct comparison with the food-based EDIP challenging. In the NHS-II and HPFS, the DII was calculated without including supplemental forms of its components, and associations of the EDIP and DII scores with inflammatory biomarkers could be directly compared using the same methodology (16). The study showed that although both dietary indexes were significantly associated with concentrations of CRP, IL-6, and TNFR2, the associations of the EDIP score with inflammatory biomarkers were of higher magnitude and the EDIP explained a slightly higher variance in biomarker concentrations than the DII (16). For example, comparing women in the highest to those in the lowest index quintiles, on a multiplicative scale, the concentration of CRP was 60% higher in EDIP models and 49% higher in DII models; and among men, it was 38% higher in EDIP models and 29% higher in DII models (16). The stronger association of the EDIP score with inflammatory markers (especially CRP), even in BMI strata in the current study, suggests that the EDIP may be more sensitive (compared to the DII) to dietary factors or dietary patterns associated with obesity. Also, the DII is driven largely by supplements and supplement use might vary a lot across populations.
The role of adiposity in the association between diet and systemic inflammation is complex. In model 2, we assumed mediation and no confounding by BMI, and in model 3 (on which our conclusions are based), we assumed that BMI is a confounder. However, in the subgroup analyses, both mediation and confounding are minimized by stratification. Higher adiposity, assessed using several measures, has been shown to be associated with higher concentrations of inflammatory markers, independent of diet (26). Also, obesity has been formally shown to mediate the pathway through which the Mediterranean dietary pattern reduces insulin resistance and inflammation (27). In the current study, we observed differences in the association of the EDIP and inflammatory markers by BMI categories, in which the association was generally stronger among normal-weight women than among overweight or obese women, on the multiplicative scale. When we examined the absolute differences among women in the highest and lowest EDIP quintiles, we found that consuming a pro-inflammatory diet was associated with higher absolute biomarker concentration even among normal-weight women. We also observed differences by race/ethnicity, with lower absolute biomarker concentrations (and stronger associations with diet) among European Americans than among other racial groups.
Using a multi-ethnic population of older American women and men, Morimoto et al. (28) observed racial/ethnic differences in serum adipokine and CRP concentrations. For example, compared to European Americans, leptin concentrations were lower in Japanese-American men and women and higher in African-American women, adiponectin concentrations were lower in African-American men and women and in Japanese-American and Native-Hawaiian women, and CRP was lower in Japanese-American men and women as well as in Native-Hawaiian women and higher in African-American men and women after adjusting for BMI. The authors suggested that the persistence of racial/ethnic differences in biomarker concentrations, even after adjusting for BMI, indicates that part of the racial/ethnic differences is due to other factors, including visceral adipose tissue and subcutaneous adipose tissue (28). However, in another study, Carroll et al. (29) found that African-American men and women had either similar or greater concentrations of inflammatory biomarkers compared to European Americans and Hispanics, despite having lower visceral adipose tissue. In addition, a previous study that used DII scores to characterize longitudinal trends in dietary inflammatory potential in the WHI found low DII scores (anti-inflammatory dietary patterns) in Asian/Pacific Islanders and European Americans compared to other race/ethnic groups (30). These racial/ethnic differences may be due to different dietary patterns inherent in the cultures of racial/ethnic groups. For example, diets of most Asian populations contain many anti-inflammatory foods and lack many of the pro-inflammatory foods in Western diets (31, 32). In the WHI, European-American women have higher educational attainment (33) and may be more inclined to modify their diets according to recommendations (34). This may partly explain the differential associations by race/ethnicity in the current study, though we adjusted for educational level.
Strengths of the current study include application of the EDIP score in a large, well-characterized population; the inclusion of women of diverse racial/ethnic groups; and the use of a food-based dietary index, whose scores are not directly impacted by supplement use, to assess diet quality based on its inflammatory potential. Limitations include known measurement error in using an FFQ for the assessment of diet, and potential residual or unmeasured confounding, though we adjusted for many potential confounding variables. In the current study, although we had data on multiple racial/ethnic groups, the sample size was insufficient to investigate associations in some subgroups including American Indians or Alaskan Natives, and Asians or Pacific Islanders. Additionally, the different racial/ethnic groups in the United States may generally have the same or similar food supply, therefore it is important to apply the EDIP in international populations which may have different food patterns than the United States. In such applications, the specific foods will likely not be the same (e.g., different specific types of green leafy vegetables in other countries than in the United States) but the correlation of the overall food group (e.g., green leafy vegetables) with inflammation (and disease outcomes) is likely to be consistent across populations (35). For example, in a review of almost 50 studies that reported on the association of several dietary patterns and colorectal cancer risk from 5 world regions, Tabung et al. (35) noted that despite differences in the number of food groups, the intake quantity, and the exact types of foods in each food group, the 2 identified dietary patterns—a “healthy” and an “unhealthy” pattern—were consistently associated with colorectal cancer risk across populations.
In summary, the successful replication of this empirical, hypothesis-oriented, a posteriori dietary pattern score in a large, multi-ethnic population of women shows that one empirical dietary pattern can be applied in the same way across different populations, to enhance reproducibility, yet still provide insights on potential biological mechanisms linking dietary patterns with disease outcomes: inflammation in the case of the EDIP score. Changes in lifestyle behaviors that include reductions in the inflammatory potential of diet hold promise to reduce systemic inflammation and the adverse signaling processes resulting from elevated inflammatory biomarkers.
Supplementary Material
Acknowledgments
The authors’ responsibilities were as follows—FKT, ELG, and KMR: designed the research; FKT: conducted the research and performed statistical analysis with support from FG; FKT: wrote the paper; KMR: provided study oversight; and all authors: analyzed and interpreted the data and provided critical input, and read and approved the final manuscript.
Notes
Supported by National Cancer Institute grant # K99 CA 207736 (to FKT) and The American Cancer Society grant # 127524-MRSG-15-012-01-CNE (to PDC). The National Institutes of Health funded the Women's Health Initiative (WHI) program through contracts #: HHSN268201100046C, HHSN268201100001C, HHSN268201100002C, HHSN268201100003C, HHSN268201100004C, and HHSN271201100004C.
Author disclosures: FKT, ELG, FG, LL, PDC, RB, JEM, EMCF, KMH, LVH, and KMR, no conflicts of interest.
Supplemental Tables 1 and 2 are available from the “Supplementary data” link in the online posting of the article and from the same link in the online table of contents at https://academic.oup.com/jn/.
Abbreviations used: CRP, C-reactive protein; DII, dietary inflammatory index; EDIP, empirical dietary inflammatory pattern score; HPFS, Health Professionals Follow-up Study; MET-h, metabolic equivalent hours; NHS, Nurses’ Health Study; TNFR, TNF receptor; WHI, Women's Health Initiative.
References
- 1. Brücher B, Jamall IS. Epistemology of the origin of cancer: a new paradigm. BMC Cancer 2014;14:331. [DOI] [PMC free article] [PubMed] [Google Scholar]
- 2. Grivennikov SI, Greten FR, Karin M. Immunity, inflammation, and cancer. Cell 2010;140:883–99. [DOI] [PMC free article] [PubMed] [Google Scholar]
- 3. Ridker PM. High-sensitivity C-reactive protein. Circulation 2001;103:1813. [DOI] [PubMed] [Google Scholar]
- 4. Ridker PM, Cushman M, Stampfer MJ, Tracy RP, Hennekens CH. Inflammation, aspirin, and the risk of cardiovascular disease in apparently healthy men. N Engl J Med 1997;336:973–9. [DOI] [PubMed] [Google Scholar]
- 5. Lohse T, Faeh D, Bopp M, Rohrmann S. Adherence to the cancer prevention recommendations of the World Cancer Research Fund/American Institute for Cancer Research and mortality: a census-linked cohort. Am J Clin Nutr 2016;104:678–85. [DOI] [PubMed] [Google Scholar]
- 6. Vergnaud A-C, Romaguera D, Peeters PH, van Gils CH, Chan DS, Romieu I, Freisling H, Ferrari P, Clavel-Chapelon F, Fagherazzi G. et al. Adherence to the World Cancer Research Fund/American Institute for Cancer Research guidelines and risk of death in Europe: results from the European Prospective Investigation into Nutrition and Cancer cohort study. Am J Clin Nutr 2013;97:1107–20. [DOI] [PubMed] [Google Scholar]
- 7. Mursu J, Steffen LM, Meyer KA, Duprez D, Jacobs DR. Diet quality indexes and mortality in postmenopausal women: the Iowa Women's Health Study. Am J Clin Nutr 2013;98:444–53. [DOI] [PMC free article] [PubMed] [Google Scholar]
- 8. Zhou B, Shu B, Yang J, Liu J, Xi T, Xing Y. C-reactive protein, interleukin-6 and the risk of colorectal cancer: a meta-analysis. Cancer Causes Control 2014;25:1397–405. [DOI] [PubMed] [Google Scholar]
- 9. Heikkilä K, Harris R, Lowe G, Rumley A, Yarnell J, Gallacher J, Ben-Shlomo Y, Ebrahim S, Lawlor DA. Associations of circulating C-reactive protein and interleukin-6 with cancer risk: findings from two prospective cohorts and a meta-analysis. Cancer Causes Control 2009;20:15–26. [DOI] [PubMed] [Google Scholar]
- 10. Due A, Toubro S, Stender S, Skov AR, Astrup A. The effect of diets high in protein or carbohydrate on inflammatory markers in overweight subjects. Diabetes Obes Metab 2005;7:223–9. [DOI] [PubMed] [Google Scholar]
- 11. Esposito K, Marfella R, Ciotola M, Di Palo C, Giugliano F, Giugliano G, D'Armiento M, D'Andrea F, Giugliano D. Effect of a Mediterranean-style diet on endothelial dysfunction and markers of vascular inflammation in the metabolic syndrome: a randomized trial. JAMA 2004;292:1440–6. [DOI] [PubMed] [Google Scholar]
- 12. Neale EP, Batterham MJ, Tapsell LC. Consumption of a healthy dietary pattern results in significant reductions in C-reactive protein levels in adults: a meta-analysis. Nutr Res 2016;36:391–401. [DOI] [PubMed] [Google Scholar]
- 13. Tabung FK, Liu L, Wang W, Fung TT, Wu K, Smith-Warner SA, Cao Y, Hu FB, Ogino S, Fuchs CS. et al. Association of dietary inflammatory potential with colorectal cancer risk in men and women. JAMA Oncology 2018, doi: 10.1001/jamaoncol.2017.4844. [DOI] [PMC free article] [PubMed] [Google Scholar]
- 14. Liu L, Nishihara R, Qian ZR, Tabung FK, Nevo D, Zhang X, Song M, Cao Y, Mima K, Masugi Y. et al. Association between inflammatory diet pattern and risk of colorectal carcinoma subtypes classified by immune responses to tumor. Gastroenterology 2017;156:1517–30.e14. [DOI] [PMC free article] [PubMed] [Google Scholar]
- 15. Tabung FK, Smith-Warner SA, Chavarro JE, Wu K, Fuchs SF, Hu FB, Chan AT, Willett WC, Giovannucci EL. Development and validation of an empirical index of dietary inflammatory potential. J Nutr 2016;146:1560–70. [DOI] [PMC free article] [PubMed] [Google Scholar]
- 16. Tabung FK, Smith-Warner SA, Chavarro JE, Fung TT, Hu FB, Chan AT, Willett WC, Giovannucci EL. An empirical dietary inflammatory pattern score enhances prediction of circulating inflammatory biomarkers in adults. J Nutr 2017;147:1567–77. [DOI] [PMC free article] [PubMed] [Google Scholar]
- 17. Women's Health Initiative Study Group Design of the Women's Health Initiative clinical trial and observational study. Control Clin Trials 1998;19:61–109. [DOI] [PubMed] [Google Scholar]
- 18. Patterson RE, Neuhouser ML, Hedderson MM, Schwartz SM, Standish LJ, Bowen DJ. Changes in diet, physical activity, and supplement use among adults diagnosed with cancer. J Am Diet Assoc 2003;103:323–8. [DOI] [PubMed] [Google Scholar]
- 19. Patterson RE, Kristal AR, Tinker LF, Carter RA, Bolton MP, Agurs-Collins T. Measurement characteristics of the Women's Health Initiative food frequency questionnaire. Ann Epidemiol 1999;9:178–87. [DOI] [PubMed] [Google Scholar]
- 20. Hu FB, Rimm E, Smith-Warner SA, Feskanich D, Stampfer MJ, Ascherio A, Sampson L, Willett WC. Reproducibility and validity of dietary patterns assessed with a food frequency questionnaire. Am J Clin Nutr 1999;69:243–9. [DOI] [PubMed] [Google Scholar]
- 21. Rosner B, Cook N, Portman R, Daniels S, Falkner B. Determination of blood pressure percentiles in normal-weight children: some methodological issues. Am J Epidemiol 2008;167:653–66. [DOI] [PubMed] [Google Scholar]
- 22. Irwin ML, McTiernan A, Manson JE, Thomson CA, Sternfeld B, Stefanick ML, Wactawski-Wende J, Craft L, Lane D, Martin LW. et al. Physical activity and survival in postmenopausal women with breast cancer: results from the Women's Health Initiative. Cancer Prev Res (Phila) 2011;4:522–9. [DOI] [PMC free article] [PubMed] [Google Scholar]
- 23. Bland JM, Altman DG. Statistics notes: transformations, means, and confidence intervals. Br Med J 1996;312:1079. [DOI] [PMC free article] [PubMed] [Google Scholar]
- 24. Bland JM, Altman DG. Statistics notes: logarithms. Br Med J 1996;312:700. [DOI] [PMC free article] [PubMed] [Google Scholar]
- 25. Tabung FK, Steck SE, Zhang J, Ma Y, Liese AD, Agalliu I, Hou L, Hurley TG, Hingle M, Jiao L. et al. Construct validation of the dietary inflammatory index among postmenopausal women. Ann Epidemiol 2015;25:398–405. [DOI] [PMC free article] [PubMed] [Google Scholar]
- 26. Choi J, Joseph L, Pilote L. Obesity and C-reactive protein in various populations: a systematic review and meta-analysis. Obes Rev 2013;14:232–44. [DOI] [PubMed] [Google Scholar]
- 27. Ma J, Giovannucci E, Pollak M, Leavitt A, Tao Y, Gaziano JM, Stampfer MJ. A prospective study of plasma C-peptide and colorectal cancer risk in men. JNCI 2004;96:546–53. [DOI] [PubMed] [Google Scholar]
- 28. Morimoto Y, Conroy SM, Ollberding NJ, Kim Y, Lim U, Cooney RV, Franke AA, Wilkens LR, Hernandez BY, Goodman MT. et al. Ethnic differences in serum adipokine and C-reactive protein levels: the multiethnic cohort. Int J Obes 2014;38:1416–22. [DOI] [PMC free article] [PubMed] [Google Scholar]
- 29. Carroll JF, Fulda KG, Chiapa AL, Rodriquez M, Phelps DR, Cardarelli KM, Vishwanatha JK, Cardarelli R. Impact of race/ethnicity on the relationship between visceral fat and inflammatory biomarkers. Obesity 2009;17:1420–7. [DOI] [PubMed] [Google Scholar]
- 30. Tabung FK, Steck SE, Zhang J, Ma Y, Liese AD, Tylavsky FA, Vitolins MZ, Ockene JK, Hebert JR. Longitudinal changes in the dietary inflammatory index: an assessment of the inflammatory potential of diet over time in the Women's Health Initiative. Eur J Clin Nutr 2016;70:1374–80. [DOI] [PMC free article] [PubMed] [Google Scholar]
- 31. Brenner DR, Boucher BA, Kreiger N, Jenkins D, El-Sohemy A. Dietary patterns in an ethnoculturally diverse population of young Canadian adults. Can J Diet Pract Res 2011;72:e161–8. [DOI] [PubMed] [Google Scholar]
- 32. Garduño-Diaz SD, Khokhar S. South Asian dietary patterns and their association with risk factors for the metabolic syndrome. J Hum Nutr Diet 2013;26:145–55. [DOI] [PubMed] [Google Scholar]
- 33. Hays J, Hunt JR, Hubbell FA, Anderson GL, Limacher M, Allen C, Rossouw JE. The Women's Health Initiative recruitment methods and results. Ann Epidemiol 2003;13:S18–77. [DOI] [PubMed] [Google Scholar]
- 34. Drewnowski A, Moudon AV, Jiao J, Aggarwal A, Charreire H, Chaix B. Food environment and socioeconomic status influence obesity rates in Seattle and in Paris. Int J Obes 2014;38:306–14. [DOI] [PMC free article] [PubMed] [Google Scholar]
- 35. Tabung FK, Brown LS, Fung TT. Dietary patterns and colorectal cancer risk: a review of 17 years of evidence (2000–2016). Current Colorectal Cancer Reports 2017;13:440–54. [DOI] [PMC free article] [PubMed] [Google Scholar]
Associated Data
This section collects any data citations, data availability statements, or supplementary materials included in this article.