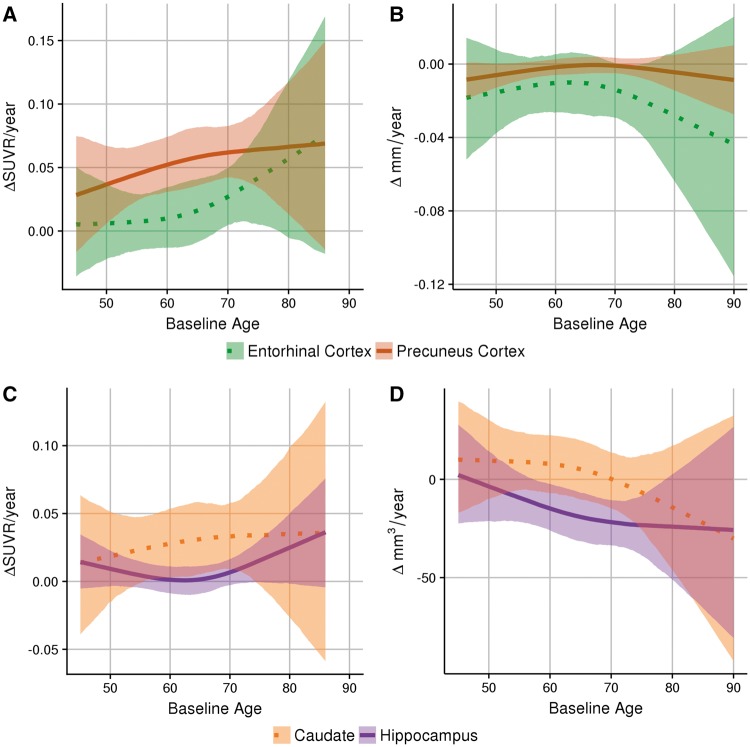
Figure 3.
Regional differences in biomarker trajectories. Top: The difference in the longitudinal rates of change of PIB measurements (A) and cortical thickness (B) between APOE ɛ4 carriers and non-carriers in two cortical regions. Bottom: The difference in the longitudinal rates of change of PIB (C) and volume (D) between APOE ɛ4 carriers and non-carriers in two subcortical regions.

