

 Cell signalling and mechanics influence vascular pathophysiology and there is an increasing demand for in vitro model systems that enable examination of signalling between vascular cells under hemodynamic conditions.
Abstract
Cell signalling and mechanics influence vascular pathophysiology and there is an increasing demand for in vitro model systems that enable examination of signalling between vascular cells under hemodynamic conditions. Current 3D vessel wall constructs do not recapitulate the mechanical conditions of the native tissue nor do they allow examination of cell–cell interactions under relevant hemodynamic conditions. Here, we describe a 3D microfluidic chip model of arterial endothelial and smooth muscle cells where cellular organization, composition and interactions, as well as the mechanical environment of the arterial wall are mimicked. The hemodynamic EC–VSMC-signalling-on-a-chip consists of two parallel polydimethylsiloxane (PDMS) cell culture channels, separated by a flexible, porous PDMS membrane, mimicking the porosity of the internal elastic lamina. The hemodynamic EC–VSMC-signalling-on-a-chip allows co-culturing of human aortic endothelial cells (ECs) and human aortic vascular smooth muscle cells (VSMCs), separated by a porous membrane, which enables EC–VSMC interaction and signalling, crucial for the development and homeostasis of the vessel wall. The device allows real time cell imaging and control of hemodynamic conditions. The culture channels are surrounded on either side by vacuum channels to induce cyclic strain by applying cyclic suction, resulting in mechanical stretching and relaxation of the membrane in the cell culture channels. The blood flow is mimicked by creating a flow of medium at the EC side. Vascular cells remain viable during prolonged culturing, exhibit physiological morphology and organization and make cell–cell contact. During dynamic culturing of the device with a shear stress of 1–1.5 Pa and strain of 5–8%, VSMCs align perpendicular to the given strain in the direction of the flow and EC adopt a cobblestone morphology. To our knowledge, this is the first report on the development of a microfluidic device, which enables a co-culture of interacting ECs and VSMCs under hemodynamic conditions and presents a novel approach to systematically study the biological and mechanical components of the intimal-medial vascular unit.
1. Introduction
Cardiovascular diseases (CVD) are the most common cause of death worldwide. CVDs, are often linked to adverse changes in tissue composition and architecture and are often promoted by changes in blood flow. Problems linked to vascular remodelling exist in many CVDs such as hypertension with vascular and cardiac hypertrophy and coronary remodelling in atherosclerosis. Juxtacrine and paracrine signalling between vascular cells and mechanical cues from blood flow play fundamental roles in tissue remodelling and homeostasis,1–7 but a mechanistic understanding on how cell–cell signalling and mechanics are integrated is missing. The arterial vessel wall is a multicellular structure with an endothelial cell (EC) sheet surrounded by a layered contractile structure of vascular smooth muscle cells (VSMCs). ECs sense alterations in blood flow and communicate with VSMCs to regulate the formation and remodelling of wall architecture required to maintain mechanical homeostasis.8,9 Fundamental understanding of the interplay between the mechanical influence of blood flow and EC–VSMC signalling is needed to reveal new mechanisms in vascular physiology and pathology and can be expected to lead to new therapies.
To address these questions, models that recapitulate the hemodynamic conditions, tissue composition and organization, and allow systematic examination of cell–cell interactions and signalling are needed.4,10 Most currently used models are simplistic static two-dimensional (2D) cell cultures of ECs and VSMCs.11–14 However, they poorly mimic the in vivo conditions. Cicha, et al. used bifurcating flow-through cell culture slides with ECs, however no co-culture, nor a 3D environment, was created.14 3D vessel wall constructs better predict the behaviour and remodelling of the in vivo tissue and are more physiologically relevant.15–17 Several 3D co-culture systems have been developed to study EC–VSMC interactions, including direct cultures of ECs and VSMCs, on opposite sides of a membrane, and cultures of ECs on extracellular matrix-like gels containing VSMCs. Lavender, et al. worked on a direct co-culture of EC and VSMCs and the effect of flow, however this model did not take the effect of strain into account.16 Recently, a three-dimensional (3D) tubular system with a co-culture of ECs and VSMCs was created by Tan, et al.10 The advantage of this system is the preservation of physiological cell–cell interactions, important for vascular homeostasis. Although vessel wall architecture was represented, this model did not recapitulate the physiological flow and strain conditions of the native tissue. As vascular tissue remodelling and mechanics are strongly interrelated and remodelling in response to changes in blood flow is important to maintain mechanical homeostasis,1–4 it is critical to incorporate EC–VSMC organization and interaction under hemodynamic loading in experimental models. Xia, et al. studied cell signalling by the use of trans well membranes, however this method does not allow for mechanical loading.18 Furthermore, Polacheck, et al. created human engineered microvessels and studied cell signalling under physiological shear stress but lacks the ability to apply physiological strain.19 Robert, et al. created a tubular 3D engineered artery model composed of ECs and VSMCs which are exposed to fluid shear stress in vitro.17 Although the physiological vessel wall architecture and pulsatile flow conditions were mimicked, the model does not allow to study EC–VSMC signalling, lacks the possibility for live imaging, and requests a long culture time and difficult harvesting techniques for biochemical assays.
Therefore, in this study, we describe a 3D microfluidic model of the EC–VSMC niche under physiological flow and strain conditions, where cell organization and composition, EC–VSMC interactions and the mechanical environment of the vessel wall is simulated. The biomimetic EC–VSMC signalling niche is inspired by a recently developed model of the human-lung-on-a-chip.20 The developed in vitro micro-engineered model aims to create an in vivo-like environment to study cell interactions and signalling, cellular phenotypes and gene and protein activity and to enable control of the important hemodynamic mechanical cues, strain and fluid flow shear stress.
The device consists of two parallel cell culture channels, separated by a flexible, porous membrane made of polydimethylsiloxane PDMS, mimicking the porous internal elastic lamina (Fig. 1A).21 The PDMS membrane is coated with fibronectin, one of the components of the ECM of the in vivo vessel wall.21 Human aortic VSMCs are cultured at one side of the device whereas human aortic ECs are present at the opposite side of the culture channel and exposed to flow of culture medium, mimicking the hemodynamic environment of the vessel wall (Fig. 1B). A thin porous membrane separating the ECs and VSMCs allows separated co-culturing of the cells while still enabling cell–cell contact under mechanical strain, crucial for the development of the arterial wall.8 The cyclic strain is applied through pumps connected to two vacuum channels on either side of the culture channels. (Fig. 1C and D).
Fig. 1. Schematic overview of the vessel wall on a chip device layer, consisting of two vacuum chambers and a cell culture chamber (A). The microfabricated vessel wall device uses compartmentalized PDMS microchannels to form an organized co-culture of ECs and VSMCs whereby physiological arterial strain and shear stress from the blood flow can be recreated (B). Schematic top view of the final microfluidic device with culture channels (red) and vacuum channels (blue) (C and D). Three PDMS layers are aligned and irreversibly bonded to form two sets of three parallel microchannels, separated by a thin PDMS membrane with pores (E). Selective etching of the membrane layers in the vacuum channels produces two large side chambers to which vacuum is applied, causing mechanical stretching of the membrane in the culture channel (F). Images are adapted from Huh et al., 2013.18.

While past studies have analysed vascular cells under hemodynamic conditions, this is the first report of a microfluidic device which enables a co-culture of ECs and VSMCs with appropriate juxtacrine cell–cell interactions under hemodynamic conditions, mimicking the EC–VSMCs niche present in the intimal-medial unit (IMU) of the native vessel wall. The compact micromodel of the vessel wall can be used to study molecular and cellular mechanism of human vascular physiology in vitro and will solve limitations of current vascular models. Key advantages of this EC–VSMC niche model are the possibility of live imaging and the ability to isolate cells separately for biochemical and gene analysis. The device permits in vitro research of vascular diseases, such as atherosclerosis and hypertension where EC–VSMC interactions play an important role.22,23 Since all of the cellular components can be independently varied, this model is an essential platform to study EC–VSMC signalling under hemodynamic conditions. In conclusion, we developed a hemodynamic EC–VSMC-signalling niche device that can be used to study the EC–VSMC interaction under physiological and pathophysiological hemodynamic loading in a controlled manner. This is a unique platform which will enable mechanistic studies of the interplay of EC–VSMC signalling and mechanics in the arterial wall and is an improvement in the field of vascular research models where other models provide less or no control over the biological or mechanical components involved. Detailed understanding of the interplay between mechanics and cell signalling mechanisms that regulate vascular remodelling is essential to reveal new therapeutic targets and help predict therapeutic outcomes in vascular medicine and engineering.
2. Experimental
Micro device design and fabrication
The artery-on-a-chip device was fabricated by adapting a soft lithography technique, previously used to create the lung-on-a-chip device. The artery-on-a-chip has a similar clear and flexible architecture and is made from polydimethylsiloxane (PDMS, Sylgard 184, Dow Corning). The aligned upper and lower culture channels (400 μm wide, 3.5 cm length, 150 μm high) are separated by a 10 μm thick PDMS membrane with 10 μm diameter circular pores and 28 μm center to center spacing in a honeycomb pattern (Fig. 1D). The dimensions of the vacuum channels (200 μm wide, 3.5 cm length, 150 μm high) were also the same in the upper and lower channels. As mold for the channels the inverse channel design was fabricated with photoresist (SU-8 3050, Microchem, Newton, MA) by photolithography on a silicon wafer. The upper and lower layers were created by pouring PDMS pre-polymer (10 : 1 w/w ratio of PDMS to curing agent) on the wafer mold and incubating 4 hours at 65 °C. The membrane was spincoated on silanized glass (10 s, 500 rpm, 100 rpm s–1; 5 min, 3000 rpm, 100 rpm s–1), cured at 65 °C overnight, and placed under an excimer laser to create circular pores of 10 μm. The upper layer and the porous membrane were activated by a plasma asher (Emitech, K1050X, Quorum technologies, UK), and bonded together. After baking for two hours at 65 °C, the membrane was released from the silanized glass with the use of ethanol and the inlets were punched with a biopsy puncher (diameter 1 mm). The membrane bound to the upper layer and the lower layer were activated by plasma, washed with methanol and aligned and bound under a stereomicroscope, and cured overnight at room temperature (RT). Both vacuum channels were etched with tetrabutylammonium fluoride/acetone (1 : 3 v/v; Sigma Aldrich) at a flow rate of 200 μl min–1 for 90 seconds. After etching, channels were directly washed with MilliQ water for 60 seconds at 200 μl min–1, resulting in the completed device (Fig. 1F). Tubing (SCI micromedical polyethylene, 0.86 mm ID 1.32 mm OD) with 20 gauge blunt luer needles (Techcon systems) was connected to the in-and outlets and fixed using PDMS as sealant. This allowed us to separately control the medium flow in both cell culture channels and to regulate the mechanical strain to the cells through the vacuum channels. The microfluidic device was validated and checked for reproducibility by visualizing and measuring the thickness of the PDMS membrane, dimensions and alignment of the device, and the effect of etching by the use of a stereomicroscope (Keyence).
Cell culture
Human aortic vein endothelial cells (HaVECs, Lonza, Switzerland) and human aortic smooth muscle cells (hAoSMCs, Cell Applications Inc., US) were used. HaVECs (hereafter abbreviated as ECs) were cultured in endothelial medium, consisting of Endothelial Cell Growth Medium (ECGM, Lonza), Endothelial Growth Medium-2-SingleQuots (Lonza), 100 U ml–1 penicillin and 100 μg ml–1 streptomycin (PenStrep). hAoSMCs (hereafter abbreviated as VSMCs) were cultured in smooth muscle medium, consisting of Smooth Muscle Growth Medium (Lonza), Smooth muscle Growth Medium-2-SingleQuots (Lonza) and PenStrep. Cells were seeded and expanded on tissue culture polystyrene (TCPS) at 37 °C, 5% CO2 and replenished with fresh media every 3–4 days, until use in the device.
Cell seeding
The device was sterilized and hydrophilised with 70% ethanol for 5 minutes and washed once with phosphate Buffered saline (PBS, Sigma Aldrich, US). After sterilization, the culture channels were coated with a 100 μg ml–1 fibronectin (FN, Sigma Aldrich) in PBS solution for 30 minutes at 37 °C and flushed with medium once. First, VSMCs were seeded at the bottom side of the membrane (bottom culture channel, Fig. 1A and B, 10 000 cells per μl) by inverting the device directly after seeding and letting the VSMCs adhere to the membrane for two hours at 37 °C. Secondly, ECs were seeded in the top culture channel of the membrane (Fig. 1A and B, 10 000 cells per μl) and incubated upright at 37 °C for two hours to adhere. The EC culture channel and vacuum channels were connected to separate Ibidi pump systems (Ibidi, US) while the VSMC culture channel was connected to a syringe pump system. For 24 hours, endothelial and smooth muscle medium was flowing in the same direction for both top and bottom culture channel with a minimal pressure of 1 mbar for ECs and a flow rate of 20 μl per hour for VSMCs. For static culture, the pressure was kept at the minimal pressure (<1 mbar) for both channels. For dynamic culturing (with shear stress and strain), the pressure flow was increased with 1 mbar per hour increments until it reached 15 mbar (≈1–1.5 Pa shear stress) for the endothelial side. Simultaneously the pressure of the vacuum was increased stepwise to –200 mbar (–10 mbar per hour).
Calculations of flow and strain
The fluid velocity within the device and the shear stress on the cells can be calculated theoretically from the Navier–Stokes equation for a pressure-driven fully developed flow within a straight rectangular duct, under the assumptions that (1) the flow is in steady-state, (2) the no-slip condition holds at the walls, and (3) the fluid is Newtonian and incompressible. Then the stream-wise velocity is given by the following equation:
 |
1 |
The width and height of the duct are given by w and h respectively (with w > h). The pressure drop over the duct section of length l is Δp. η is the dynamic viscosity of the fluid. In our case, the floor of the duct is formed by the membrane. The fluid velocity is in the z-direction, x and y are the cross-sectional axes where x is oriented along the membrane and y is oriented vertically upwards from the membrane; the origin is at the center of the membrane. The wall shear stress acting on the membrane, and therefore on the cells cultured on the membrane (i.e. at y = 0), is given by:
 |
2 |
This equation gives the theoretical shear stress acting on the cells cultured on the membrane, as a function of the x-location. Note that the shear stress is maximal at the center of the membrane (x = 0), while it is zero at the edges (x = ±w/2).
To calculate the amount of strain, displacement of the pores in the membrane was measured by the use of a stereomicroscope and divided by the width of the channel. The displacement of the membrane was measured with and without the use of cells. The influence of flow and strain on each other is calculated by the Reynolds and Wombersley number.
Cell viability and organization
For live imaging of the cells, CellTracker Green and CellTracker Orange (Thermo Fisher Scientific) was used. VSMCs were pelleted and incubated with 10 μM Celltracker Orange in smooth muscle medium for 15 minutes at 37 °C. After incubation with the staining solution, cells were washed with PBS twice and seeded in the device. The ECs were stained with Celltracker Green in endothelial medium with the same protocol and seeded in the device. Imaging was performed with the Zeiss LSM META NLO (Zeiss) after seeding and four days of dynamic culturing. Cellular organization was calculated with the directionality plugin of ImageJ software.
Immunocytochemistry
For immunocytochemistry, the microfluidic devices were first washed with PBS, fixed with 4% paraformaldehyde for 10 minutes at RT, and washed with PBS. The samples were cut across the channel direction, permeabilized with 0.5% Triton-X-100 (Sigma Aldrich) in PBS for 3 minutes at RT and washed three times with PBS-0.1% TWEEN® 20 (PBST, Sigma Aldrich). Samples were blocked with 3% Bovine Serum Albumine (BSA, Roche) for 30 minutes at RT and incubated with primary antibody for 90 minutes at RT in 1.5% BSA in PBST. Primary antibodies used were: αSMA, vWF, and CD31 (DAKO, Denmark). After first incubation, the sample was washed three times for 5 minutes with PBST and incubated for 90 minutes with the secondary antibody in PBST at RT. During secondary antibody incubation, devices were also stained with Phalloidin Atto 488 (Sigma-Aldrich), which stains for F-actin. Devices were washed again with PBST twice, incubated with 4′-6-diamidine-2′-phenylindole dihydrochloride (DAPI) for 15 minutes at RT, and washed three times with PBST prior to mounting with Mowiol. As a control, ECs and VSMCs (100 000 per well), separately, were seeded on coverslips spincoated with PDMS and coated with FN and stained together with the devices. Visualisation of the coverslips was performed with a Zeiss Axiovert 200M (Zeiss, Germany) and the microfluidic devices with a Leica TCS SP5X.
Gene expression
Quantitative real-time polymerase chain reaction (qPCR) was performed to analyze the gene expression levels of smooth muscle markers (alpha-smooth muscle actin: ACTA2, calponin: CNN2, connexin43: GJA1 and smoothelin: SMTN), endothelial markers (von Willebrand Factor: VWF and Platelet endothelial cell adhesion molecule/cluster of differentiation 31: PECAM1) and extracellular matrix proteins (fibronectin: FN1, collagen type I: COL1A1 and collagen type III: COL3A1) with reference genes glyceraldehyde 3-phosphate dehydrogenase (GAPDH) and β2 microglobulin (B2M) (Table S1†). First, cells were collected from the devices after one day by washing with PBS, incubation of Trypsin (Sigma-Aldrich) at 37 °C for 7 minutes and flushing with medium for each individual culture channel to obtain ECs and VSMCs separately. After collection, cells were washed with PBS and centrifuged. RNA was isolated using an RNeasy kit (Qiagen) according to manufacturer's protocol. The concentration and purity of the isolated RNA was determined with a Qubit dsRNA High Sensitivity Assay Kit (Thermo Scientific) and a spectrophotometer (NanoDrop 1000™, Thermo Scientific). Complementary DNA (cDNA) was made with random hexadeoxynucleotides (Promega, United States), dNTPs (Invitrogen), and Moloney Murine Leukemia Virus Reverse Transcriptase (M-MLV; Invitrogen), or the Superscript IV reverse transcriptase kit for low RNA yield samples (Thermo Fisher). Quantitative Real-Time Polymerase Chain Reaction (qPCR) was performed using SYBR Green (BioRad, the Netherlands). Gene expression was quantified using the Pfaffl method whereby following equations were used;
| ΔCref gene = Ctcontrol group – Ctsample group | 3 |
| ΔCtarget gene = ΔCtcontrol group – ΔCtsample group | 4 |
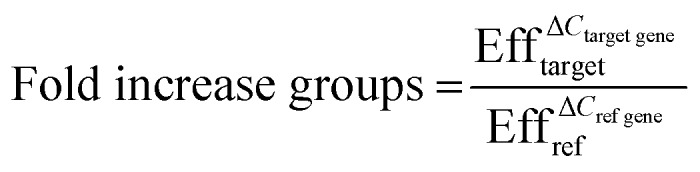 |
5 |
With Ct the average Ct values of the groups and Eff the efficiency of the primers.
Statistical analysis
Data is presented as mean ± standard deviation and statistical analyses were performed using GraphPad Prism and SPSS software. Statistical analysis of the qPCR data was performed by a one-way ANOVA test together with the Tukey post-hoc-test. P values <0.05 were considered statistically significant.
3. Results and discussion
Vascular cells in the biomimetic EC–VSMC signalling niche show physiological morphology and retain expression of endothelial and smooth muscle cells markers
To mimic the tissue architecture and hemodynamic environment of the artery, we developed a biomimetic EC–VSMC signalling niche. The model was designed by incorporation of two separate cell culture channels separated by a thin porous membrane. To validate fabrication of the model, the thickness of the PDMS were visualized. The thickness of the PDMS membrane was 10 μm ± 1 μm (Fig. S1A†), the culture channels ±400 μm width and ±150 μm height and vacuum channels ±200 μm width and ±150 μm height (Fig. S1B†). Etching of the device resulted in successful removal of the PDMS membrane within the vacuum channels (Fig. S1C and D†). Prior to seeding the devices, alignment was examined whereby misaligned devices were excluded. The thin porous membrane was coated with fibronectin, one of the main components of ECM in the vessel wall,21 and seeded with ECs and VSMCs on opposite surfaces of the coated membrane (Fig. 2). The ECs and VSMCs remained separated by the membrane and exhibited a random orientation in the static cultures, as expected. ECs obtained a cobblestone-like shape and formed a confluent compact layer,24 while VSMCs were spindle shaped and formed a more network like structure25 (Fig. 2A–C).
Fig. 2. Brightfield images of the artery-on-a-chip after seeding with cells. ECs and VSMCs are seeded separately (A and B, respectively), resulting in both cell types at each side of the membrane (C and D). The ECs can be seen in the upper layer and VSMCs in the lower layer (C). Scalebar represents 50 μm and inserts represent a higher magnification of ECs and VSMCs.

VSMCs have a wide spectrum of phenotypes, ranging from a contractile to a synthetic phenotype.26 Contractile VSMCs can be distinguished from synthetic SMCs via morphology and phenotype specific protein markers. Contractile VSMCs are spindle shaped and elongated while synthetic VSMCs have a cobble stone morphology and are less elongated. Furthermore, contractile VSMCs express high amounts of alpha-smooth muscle actin (α-SMA), SM22, calponin, smoothelin and several other proteins.26,27 Synthetic VSMCs express low amounts of α-SMA and SM22 and high amounts of collagen I and connexin43.26,28 In the healthy native vessel, VSMCs have a contractile phenotype, meaning that they do not proliferate, migrate and do not produce ECM components. Upon response to injury or inflammation, VSMCs de-differentiate into a more synthetic phenotype. Synthetic VSMCs exhibit higher proliferation, higher migration and produce more ECM proteins.
To determine cell phenotype within the device we performed immunohistochemistry of the cells in the device. Cells were stained for the endothelial specific markers CD31 and von Willebrand Factor (vWF), the smooth muscle specific marker alpha smooth muscle actin (α-SMA), and filamentous actin (F-actin). As control we stained ECs and VSMCs cultured on PDMS and fibronectin coated coverslips. Both cell types expressed F-actin (green) and exhibited a cell morphology comparable with the control cells grown on coverslips spincoated with PDMS and fibronectin coated (Fig. 3). ECs were present in the upper channel and VSMCs in the lower channel of the device, separated by the porous PDMS membrane. Expression of endothelial and smooth muscle specific markers further confirmed the phenotype and organization of the cells in two separate layers. Smooth muscle cells expressed abundant amounts of α-SMA (green) (Fig. 3G and H) and were only present in the VSMCs culture channel, (Fig. 3G). ECs in the device expressed both CD31 (Fig. 3A and B) and vWF (Fig. 3D and E), comparable to the control samples and were only present in the ECs culture channel (Fig. 3A–F). VSMCs did not express these endothelial markers (Fig. 3C). Both cell types remained at their respective sides of the membrane and exhibited a comparable phenotype and morphology to the control cells on coverslips.
Fig. 3. Immunohistochemistry of the artery-on-a-chip device (n = 6) and arterial cells on coverslips coated with PDMS and fibronectin (n = 4). For the devices in the top row, the upper channel is seeded with VSMCs and lower channel with ECs. The middle row represents an overlay of both cell types, except for K. and M., representing ECs and VSMCs only. The bottom row represents 2D cultures of ECs and VSMCs cultured on coverslips coated with PDMS and fibronectin as control. A–C. Images of staining for CD31 (green) of the devices (A and B) and ECs (C). D–F Images of staining for vWF (green) of the devices (D and E) and ECs (F). G–I. Images of staining for α-SMA (green) of the devices (G and H) and VSMCs (I). J–N. Images of staining for F-actin filaments (green) of the devices (J, K and M), ECs (L) and VSMCs (N). Cell nuclei is stained in blue, scalebar represents 50 μm.

Effects of medium on EC and VSMC phenotypes
The immunohistochemical analyses demonstrated that ECs and VSMCs retain their phenotypes in the device. However, as culture conditions and medium supplements have been shown to affect gene expression profiles of ECs and VSMCs,25 we analysed the effect of the different mediums used in the EC and VSMC channels on the cells. As the cells are separated by a porous membrane there is a possibility that medium diffusion occur between the channels if the cells do not form intact monolayers along the whole device. To analyse the impact of medium on the cultures, ECs and VSMCs were cultured in regular polystyrene culture plastics with different combinations of the media used: 100% EC growth medium (ECGM); 50% ECGM + 50% Smooth muscle cell growth medium (SMGM); or 100% SMGM, and analysed for the expression of endothelial markers CD31 (PECAM1) and vWF (VWF) and the smooth muscle cell markers αSMA (ACTA2), smoothelin (SMTN) and calponin (CNN2) for differentiation and the gap junction protein connexin43 (GJA1) (Fig. S2†). The expression of PECAM1, VWF and GJA1 in ECs was not decreased in 50/50 medium, indicating that ECs were not affected by different types of medium. However, expression of GJA1, CNN2, SMTN, and ACTA2 was decreased in VSMCs cultured in 50% ECGM + 50% SMGM or 100% ECGM compared to VSMC cultured in 100% SMGM (Fig. S2†), indicating that expression of VSMCs markers are affected by exchange of medium. It is therefore important to minimize medium leakage between the two channels and to carefully assess the expression profile of each cell population in the device during different stages of the experiments. This can be done using state of the art tools to follow gene and protein expression in living cells, signalling reporters, mRNA expression reporters, and mechanical reporters.29–32
Cells retain expression of endothelial and smooth muscle cell markers
One of the advantages of the device design is the possibility to isolate cell lysates separately for further analyses of gene and protein expression and to characterise distinct responses of ECs and VSMCs.33 We isolated the EC and VSMC lysates separately from the device and extracted mRNA for analyses of gene activity. For this particular experiment lysates were collected after 1 day of static cultures in the device. We performed qPCR for the endothelial markers CD31 (PECAM1) and vWF (VWF) and smooth muscle cell markers αSMA (ACTA2), smoothelin (SMTN) and calponin (CNN2) for differentiation and the gap junction protein connexin43 (GJA1). We also analysed expression of extracellular matrix genes collagen type I (COL1A1), collagen type III (COL3A1) and fibronectin (FN1). In line with the expectations, normalized expression of PECAM1 and VWF is higher in ECs, both in 2D and the devices, compared to VSMCs (PECAM1; p = 0.0011 ECs dev vs. VSMCs dev and p = 0.005 for ECs dev vs. VSMCs 2D. VWF; p = 0.0032 ECs dev vs. VSMCs dev and p = 0.019 for ECs dev vs. VSMCs 2D) (Fig. 4A and B). No difference in PECAM1 was seen between ECs of the device and 2D cultures (p = 0.068). VWF expression was higher in ECs in the device compared to ECs 2D cultures (p = 0.0117). GJA1 is expressed to a higher degree in VSMCs in the devices compared to the VSMCs 2D cultures and higher compared to ECs cultures (p < 0.0001 VSMCs dev vs. VSMCs 2D, p = 0.0052 VSMCs dev vs. ECs dev and p < 0.0001 for VSMCs dev vs. ECs 2D). However, GJA1 is present in both cell types based on the Cq values (Cq = 28.4 for ECs and Cq = 25.21 for VSMCs in the devices and Cq = 30.6 for ECs and Cq = 28.65 for VSMCs in 2D cultures) (Fig. 4C). αSMA expression was significantly lower in 2D cultures compared to VSMC from the device (p < 0.0001 for VSMCs dev vs. VSMCs 2D and p < 0.0001 for VSMCs dev vs. ECs 2D). However, VSMCs compared to ECs from the device do not show a difference in ACTA2 expression (p = 0.0954). For calponin, mRNA expression was significantly lower in 2D cultures compared to cells from the devices (p = 0.0496 for VSMCs dev vs. VSMCs 2D and p = 0.0008 for VSMCs dev vs. ECs 2D) (Fig. 4E). There was no difference in calponin and smoothelin expression between the ECs and VSMCs in the devices (p = 0.1428) and a relative increase of smoothelin occurred in 2D cultures compared with cells in the devices (p = 0.0262 VSMCs dev vs. VSMCs 2D and p = 0.0264 VSMCs dev vs. ECs 2D) (Fig. 4E and F). In conclusion, by achieving separate isolation of the cell lysates from each culture channel we show that ECs in the device demonstrated an endothelial like phenotype, expressing endothelial specific markers. Furthermore, we show a decrease in smooth muscle specific markers for the VSMCs, indicating a dedifferentiated phenotype. VSMCs exhibit a more synthetic-like phenotype under static conditions, and co-culturing of ECs and VSMCs leads to the differentiation of synthetic VSMCs into a more contractile phenotype after 7 days of culturing.25 In addition to hemodynamic load, and culturing time, medium supplements and matrix substrates influence VSMC phenotype, as seen in Fig. S2.† 5,23 Heparin and smooth muscle differentiation serum can be used to induce the contractile phenotype of VSMCs.25
Fig. 4. Gene expression analysis of the microfluidic devices. Expression of endothelial markers PECAM1 (A) and von Willebrand Factor (VWF) (B), Connexin43 (GJA1) (C) and smooth muscle markers alpha-smooth muscle actin (ACTA2) (D), Calponin (CNN2) (E) and Smoothelin (SMTN) (F). ECs 2D indicates ECs cultured on PDMS coated with FN (PDMS-FN) surfaces; VSMCs 2D, VSMCs cultured on PDMS-FN surfaces; ECs dev, ECs from the microfluidic devices and VSMCs dev indicate VSMCs isolated from the microfluidic devices. For the endothelial markers, *p < 0.05, **p < 0.01, ***p < 0.001 on each bar for comparison with control ECs from 2D cultures or the devices, separately. For smooth muscle markers, *p < 0.05, **p < 0.01, ***p < 0.001 on each bar for comparison with control VSMCs from 2D cultures or the devices, separately. *p < 0.05, **p < 0.01, ***p < 0.001 on the lines for comparison between groups, n = 5–8.

We next analysed expression of the extracellular matrix genes collagen type I (COL1A1), collagen type III (COLA13) and fibronectin (FN1) (Fig. 5). Expression of collagen type I and III in ECs was much lower than expression in VSMC in both conditions (COL1A1; p < 0.0001 for ECs dev and p < 0.0001 for ECs 2D and COL3A1; p < 0.0001 for ECs dev and p < 0.0001 for ECs 2D) (Fig. 5A and B). No difference was seen for collagen type I expression between VSMCs in the devices and 2D cultures (p = 0.0712). Expression of collagen type III was significantly higher in the device for VSMCs compared to 2D cultures (p = 0.0001) (Fig. 5B). Fibronectin expression was equal for ECs and VSMCs in the devices (p = 0.1446) and higher in the devices compared to 2D cultures for both cell types (p = 0.0002 VSMCs dev vs. VSMCs 2D and p = 0.0001 VSMCs dev vs. ECs 2D) (Fig. 5C). In conclusion, cells in the devices express several matrix genes already after one day whereby VSMCs are responsible for collagen type I and III expression.
Fig. 5. Gene expression analysis of extracellular matrix genes. Expression of COL1A1 (A), COL3A1 (B) and FN1 (C). ECs 2D indicates ECs cultured on PDMS coated with FN (PDMS-FN) surfaces; VSMCs 2D, VSMCs cultured on PDMS-FN surfaces; ECs dev, ECs from the microfluidic devices and VSMCs dev indicate VSMCs isolated from the microfluidic devices. Boxes in the graphs are separated by a dotted line, meaning two different normalized groups, 2D and device cultures, are present. *p < 0.05, **p < 0.01, ***p < 0.001 on each bar for comparison with control VSMCs for 2D and devices, separately, n = 5–8.

Co-culturing ECs and VSMCs with direct cell–cell contact
In vivo, ECs and VSMCs in the vessel wall protrude through the internal elastic lamina, creating plasma membrane juxtapositions with the opposite cell type.34,35 Cell interactions mediated by myoendothelial junctions (MEJs) are crucial during vascular development and to maintain homeostasis.35 Previous in vitro model systems of co-cultured ECs and VSMCs with direct contact have been developed, however without incorporating mechanical stimuli.33 One of the main advantages of the developed microfluidic device is that it enables cell–cell contact due to the porous membrane. In combination with hemodynamics this constitutes an essential novel aspect of the device. To determine that the cells indeed make contact through the matrix coated porous membrane we seeded EC and VSMC in the regular device and a control device with an intact membrane and stained them for vWF and αSMA with immunohistochemistry. Imaging by confocal microscopy revealed that ECs and VSMCs connected through the pores of the membrane in the regular device while in the control device the cells did not interact with each other (Fig. 6). The in vivo internal basal lamina is around 10–20 nm,35 while the PDMS membrane in the current device is around 10 μm thick. To improve visualization, control the MEJ morphology, and cell contact area the thickness of the porous PDMS and the size of the pores can be reduced.35–37 By further development and optimization of the fabrication process and material properties of PDMS the device can more closely mimic the properties of the in vivo intimal-medial unit.
Fig. 6. Cross section of artery-on-a-chip. Immunohistochemistry staining of the device without pores (control, A) and with porous membrane (B). In green the VSMCs and in red the ECs. Number 1 depicts the VSMC side of the device, number 2 the membrane, and number 3 the ECs side. Scalebar represents 50 μm, n = 3–4.

The EC–VSMCs niche device under hemodynamic loading mimicks vascular cell behaviour
Under physiological conditions, vascular cells experience shear stress caused by the blood flow and undergo strain due to the circumferential dilation of the blood vessel.38 It is known that both hemodynamic forces are important for the regulation of permeability of the endothelial monolayer and play an important role in the formation of new vessels and disturbed mechanical stimuli can lead to endothelial dysfunction and atherosclerosis.39 Therefore, in this model, based on literature, both shear stress and strain are mimicked, resulting in a model closer to the in vivo vessel wall. To study the behaviour of the ECs and VSMCs under hemodynamic forces, ECs and VSMCs were labelled with CellTracker Green and Orange respectively before being loaded into the device. Both cell types were viable after attachment to the membrane, exhibited a random alignment and a cobble-stone like morphology (Fig. 7A–D). When the cells had adhered to the membrane, the cell culture channels of the device were connected to a pressure-driven IBIDI system to flow endothelial media at the EC side of the membrane and a syringe pump system for flow of the smooth muscle media at the VSMCs side of the membrane. Furthermore, the vacuum channels were connected to a pressure-driven IBIDI system for vacuum to induce strain, mimicking the cyclic circumferential strain during the pulsatile blood flow in the vessel. The shear stress experienced by ECs is nearly constant over the arterial part of the cardiovascular network, varying between 1 and 1.5 Pascal (Pa).27,38,40 Due to a pressure difference over the vessel wall, VSMCs experience shear stress from interstitial fluid flow through the vessel wall, ranging from 0.01–0.1 Pa.41 The pressure difference of the chip was measured by sensors and the shear stress calculated using eqn (1)–(3). The shear stress in the device corresponded to the in vivo arterial endothelial shear stress and varied between 1 and 1.5 Pa (10–15 dyn cm–2, Fig. S1E†).27,38,40,42 A Reynolds number (Re) of 2.18 was calculated, indicating that the flow across the membrane was laminar.43 The calculated Womersley number was 0.11, which verified that the flow was not disturbed by stretching the membrane. The VSMCs in the vessel wall experience shear stress from interstitial fluid flow through the vessel wall, ranging from 0.01–0.1 Pa.41 A fluid rate of 20 μl min–1 of smooth muscle medium was used, resulting in very low, non-detectable, shear stress. The in vivo circumferential strain is dependent on the location and mechanical properties of the artery, varying between 10% and no strain at all.27,44,45 Measurements of the displacement of the membrane demonstrated that the cells experienced around 5–8% strain in the devices. After four days of dynamic culturing, ECs and VSMCs were still viable (Fig. 7A–H). No distinct cell alignment was seen for ECs within the device and VSMCs were aligned in a perpendicular direction of the given strain (Fig. 7) and were more elongated and spindle shaped compared to the cells in the static condition (Fig. 7B and F). Next, nucleus and actin fibre orientation was analysed in static and dynamic conditions, whereby the same trend was seen as with the CTG/CTO (Fig. S3†).
Fig. 7. Live staining of vessel wall on a chip device. A–D. Images were taken directly after adhesion of VSMCs (B) and ECs (C) whereby A and D are merged images. E–H. Live cell stainings after 4 days of dynamic culturing, VSMCs (F), ECs (G) and merged images (E and H). ECs are stained in green and VSMCs in red. Scalebar represents 100 μm, n = 3. I. Cell orientation analysis for ECs in static (blue) and dynamic cultures (red). J. Cell orientation analysis for VSMCs in static (blue) and dynamic (red) cultures. Cell orientation analysis is analysed by the CTG/CTO and F-actin images, n = 4–6.

The vessel wall is composed of three distinct layers; the intima, media, and adventitia.21 ECs reside in the intima layer, forming the blood-cell barrier in the vessel wall. In the healthy in vivo vessel wall, ECs orientate longitudinally in the direction of the blood flow and perpendicular to uniaxial strain.21,42,46,47 Ostrowski et al., 2014 found that ECs align parallel to the direction of flow at lower shear stress values (15 dyn cm–2) and perpendicular to the flow direction for higher wall shear stress (>34 dyn cm–2) in vitro.42 Furthermore, Sinha et al., 2016 demonstrated that shear stress in combination with uniaxial strain results in ECs aligned in the direction of the flow.47 The in vivo medial layer consists predominantly of VSMCs which are aligned perpendicular, in a circumferential fashion, to the longitudinal axis of the vessel.21In vitro VSMCs align parallel to the shear stress direction in high shear stress conditions and perpendicular in low shear stress regions without strain. Furthermore, VSMCs align perpendicular to the direction of stretch, without flow, in vitro.27 Contrary, in the presence of physiological shear stresses, co-culture conditions result in VSMCs that align perpendicular and ECs that align in the direction of the flow. In our device, with low VSMCs shear stress and physiological strain, VSMCs aligned with the direction of the flow, perpendicular to the given strain. ECs also aligned in the direction of the flow although the organisation was not as striking as that of VSMCs. Besides hemodynamical cues, interactions between cells and the surrounding matrix can also provide cues for cellular behaviour.7,48
To determine cellular responses of cell-matrix interactions, ECM properties such as composition, architecture, topography and mechanical strength are key parameters.49,50 Besides fibronectin, other extracellular matrix proteins, such as collagen, can be used to coat the membrane and should be studied in future research. Next to the protein used, the orientation of matrix proteins is of high importance as well. Zeng, et al. showed that 3D oriented collagen fibrils increased VSMCs viability and organization.49 More research into micro-topographical features that mimic the alignment of ECM need to be performed to correctly guide the alignment of VSMCs within the microfluidic channel. Furthermore, Formentín, et al. demonstrates that pore size plays a key role in controlling the morphology and growth rate of human aortic endothelial cells.51 To investigate the effect of pore sizes on aortic cells we could vary pore size of the membrane to see effects on cellular orientation or differentiation. In conclusion, more studies are needed to investigate the mechanisms of ECM properties on cell behaviour within the device.
Studying EC–SMC signalling in physiology and pathology under hemodynamic loading
The developed device allows for the study of EC–VSMC cell signalling in both physiological as well as pathological conditions. EC to VSMC signalling is required for the proper functioning of the vascular unit, and defects in the signalling machinery can lead to pathology. Notch signalling is a crucial signalling pathways in vascular development, vascular maturation and homeostasis.52 ECs signalling to VSMCs with Jagged1 triggers lateral induction, a cascade of Notch activation in the VSMCs involved in the correct differentiation of the vessel wall.9 Several vascular pathologies are related to mutations in or dysregulation of Notch components, e.g. in the case of CADASIL (Notch3 mutation), Alagille syndrome23 or in hypertension.22,53 Recently, the role that Notch plays as a mechanosensor in the vasculature has become more evident.19,54,55 Therefore the current device, with the opportunity to modulate and analyse Notch components or Notch regulatory machinery, specifically on either the intimal or medial sides of the signalling unit provides an invaluable tool to study these complex developmental mechanisms. In this context, we investigated whether differences in Notch signalling occur between cells cultured in the device with or without the ability to form cell–cell contacts (Fig. 8A). The ability of the cells to form cell–cell contacts indeed has a mild effect on the activation of Notch signalling, as indicated by the induction of HEY1 in the vascular smooth muscle cells by, as part of the lateral induction cascade (Fig. 8B).56 This setup will in the future be used to study the signalling effect of Notch dependent vascular development, and the interplay of hemodynamics and Notch signalling in physiology and pathology of the IMU (Fig. 8C).
Fig. 8. Investigating notch signalling in vascular development in the vessel wall on a chip. Schematic of an experiment to verify the possibility of studying notch activation in a chip, by culturing cells on opposing sides of membranes either with or without pores (A). Different expression levels of JAG1, NOTCH3 and HEY1 were observed between EC and VSMC, and in the presence of pores separate populations were still identified, with a slight increase in notch activation in the VSMCs as indicated by HEY1 (B). Future investigations in this setup can focus on the interplay between hemodynamics and notch signalling in the vessel wall, and the effect of pathological mutations on signalling and cell fate outcomes (C).

4. Conclusion
The model of the hemodynamic EC–VSMC signalling niche provides a controlled micro-platform to study and perturb EC–VSMC signalling in a physiological or pathophysiological hemodynamic environment. The device supports physiological flow and strain and prolonged EC and VSMC co-culture with physiological cellular phenotypes, organization and interactions. Characterization of the device demonstrated that hemodynamic forces are necessary to induce the cellular alignment and organization of the native arterial vessel wall. The platform will facilitate the understanding of the integration of mechanics and EC–VSMC signalling which is crucial for vascular remodelling and lacks in other vascular models. Further, it will help to identify new mechanism through which mechanical stimuli influence molecular signalling and help understand how mutations in signalling pathways operate in the hemodynamic environment. In conclusion, we generated a novel physiological compact micromodel of EC–VSMC interactions in the vessel wall which can be used to study human vascular physiology and pathology in vitro and can solve some limitations in current vascular models. Furthermore, this microfluidic device permits research of vascular diseases and provides an essential platform in drug screening and for obtaining design guidelines in tissue engineering.
Author contributions
N. C. A. E., C. V. C. B. and C. M. S. conceived and designed the project. N. C. A. E., A. M. A. O. P. and O. M. J. A. S. performed the experiments for the device fabrication. N. C. A. E. and O. M. J. A. S. performed the experiments with the cells and analysed the data. N. C. A. E., A. M. A. O. P., J. M. J. T., O. M. J. A. S. and C. M. S. provided feedback on the experiments and data interpretation. N. C. A. E. and C. M. S. wrote the manuscript. All authors discussed and commented on the manuscript and approved of its content.
Conflicts of interest
There are no conflicts to declare.
Supplementary Material
Acknowledgments
The authors thank Eline van Haaften for her help in the lab with the creation of the devices, Jelle Sleeboom for his help with the masks and the calculations of flow and strain. The work was supported by the Academy of Finland grant # 307133 (Cecilia Sahlgren), and the European Commission Marie-Curie CIG grant # 618623 and the ERC-CoG 771168-ForceMorph. N. C. A. van Engeland was supported by the Doctoral Network of Molecular Biosciences at Åbo Akademi University. Oscar M. J. A. Stassen was supported by project ImaValve, funded by the European Union's Seventh Framework Programme for research, technological development and demonstration under grant agreement no 604514.
Footnotes
†Electronic supplementary information (ESI) available. See DOI: 10.1039/c8lc00286j
References
- Cyron C. J., Humphrey J. D. Int. J. Eng. Sci. 2014;85:203–223. doi: 10.1016/j.ijengsci.2014.08.003. [DOI] [PMC free article] [PubMed] [Google Scholar]
- Mammoto T., Mammoto A., Ingber D. E. Annu. Rev. Cell Dev. Biol. 2013;29:27–61. doi: 10.1146/annurev-cellbio-101512-122340. [DOI] [PubMed] [Google Scholar]
- Humphrey J. D. Nat. Rev. Mol. Cell Biol. 2014;15:802–812. doi: 10.1038/nrm3896. [DOI] [PMC free article] [PubMed] [Google Scholar]
- Kutys M. L., Chen C. S. Curr. Opin. Cell Biol. 2016;42:73–79. doi: 10.1016/j.ceb.2016.04.011. [DOI] [PMC free article] [PubMed] [Google Scholar]
- Cyron C. J., Humphrey J. D. Meccanica. 2017;52(3):645–664. doi: 10.1007/s11012-016-0472-5. [DOI] [PMC free article] [PubMed] [Google Scholar]
- Humphrey J. D. Cell Biochem. Biophys. 2008:53–78. doi: 10.1007/s12013-007-9002-3. [DOI] [PubMed] [Google Scholar]
- van Haaften E. E., Bouten C. V. C., Kurniawan N. A. Cells. 2017;6:1–24. doi: 10.3390/cells6030019. [DOI] [PMC free article] [PubMed] [Google Scholar]
- Rostama B., Peterson S. M., Vary C. P. H., Liaw L. Vasc. Pharmacol. 2014;63:97–104. doi: 10.1016/j.vph.2014.10.003. [DOI] [PMC free article] [PubMed] [Google Scholar]
- Manderfield L. J. Circulation. 2012;125:314–323. doi: 10.1161/CIRCULATIONAHA.111.047159. [DOI] [PMC free article] [PubMed] [Google Scholar]
- Tan A., Fujisawa K., Yukawa Y., Matsunaga Y. T. Biomater. Sci. 2016;4:1503–1514. doi: 10.1039/c6bm00340k. [DOI] [PubMed] [Google Scholar]
- Navab M. J. Clin. Invest. 1988;82:1853–1863. doi: 10.1172/JCI113802. [DOI] [PMC free article] [PubMed] [Google Scholar]
- Westhorpe C. L. V. Biophys. Chem. 2012;93:220–226. [Google Scholar]
- Takaku M. Arterioscler., Thromb., Vasc. Biol. 1999;19:2330–2339. doi: 10.1161/01.atv.19.10.2330. [DOI] [PubMed] [Google Scholar]
- Cicha I., Urschel K., Daniel W. G., Garlichs C. D. Clin. Hemorheol. Microcirc. 2011;48:65–73. doi: 10.3233/CH-2011-1394. [DOI] [PubMed] [Google Scholar]
- Hamon M., Hong J. W. Mol. Cells. 2013;36:485–506. doi: 10.1007/s10059-013-0333-1. [DOI] [PMC free article] [PubMed] [Google Scholar]
- Lavender M. D., Pang Z., Wallace C. S., Niklason L. E., Truskey G. A. Biomaterials. 2005;26:4642–4653. doi: 10.1016/j.biomaterials.2004.11.045. [DOI] [PMC free article] [PubMed] [Google Scholar]
- Robert J. PLoS One. 2013;8:e79821. doi: 10.1371/journal.pone.0079821. [DOI] [PMC free article] [PubMed] [Google Scholar]
- Huh D. Nat. Protoc. 2013 doi: 10.1038/nprot.2013.137. [DOI] [PubMed] [Google Scholar]
- Polacheck W. J. Nature. 2017;552:258–262. doi: 10.1038/nature24998. [DOI] [PMC free article] [PubMed] [Google Scholar]
- Huh D., Hamilton G. A., Ingber D. E. Trends Cell Biol. 2011;21:745–754. doi: 10.1016/j.tcb.2011.09.005. [DOI] [PMC free article] [PubMed] [Google Scholar]
- Martinez-Lemus L. A. Basic Clin. Pharmacol. Toxicol. 2012;110:5–11. doi: 10.1111/j.1742-7843.2011.00813.x. [DOI] [PMC free article] [PubMed] [Google Scholar]
- Rippe C. Sci. Rep. 2017;7:1–13. doi: 10.1038/s41598-017-01392-1. [DOI] [PMC free article] [PubMed] [Google Scholar]
- Kamath B. M. Circulation. 2004;109:1354–1358. doi: 10.1161/01.CIR.0000121361.01862.A4. [DOI] [PubMed] [Google Scholar]
- Bouïs D., Hospers G. A. P., Meijer C., Molema G., Mulder N. H. Angiogenesis. 2001;4:91–102. doi: 10.1023/a:1012259529167. [DOI] [PubMed] [Google Scholar]
- Ganesan M., Finsterwalder R., Leb H., Resch U., Neumüller K., de Martin R., Petzelbauer P. Tissue Eng., Part C. 2017;23:38–49. doi: 10.1089/ten.tec.2016.0299. [DOI] [PMC free article] [PubMed] [Google Scholar]
- Rensen S. S. M., Doevendans P. A. F. M., van Eys G. J. J. M. Neth. Heart J. 2007;15:100–108. doi: 10.1007/BF03085963. [DOI] [PMC free article] [PubMed] [Google Scholar]
- Qiu J. J. R. Soc., Interface. 2014;11:20130852. doi: 10.1098/rsif.2013.0852. [DOI] [PMC free article] [PubMed] [Google Scholar]
- Nguyen A. T. Circ. Res. 2013;112:17–22. doi: 10.1161/CIRCRESAHA.112.281048. [DOI] [PMC free article] [PubMed] [Google Scholar]
- Seo D. Cell. 2016;165:1507–1518. doi: 10.1016/j.cell.2016.04.045. [DOI] [PMC free article] [PubMed] [Google Scholar]
- Yu J., Xiao J., Ren X., Lao K., Xie X. S. Science. 2006;311:1600–1604. doi: 10.1126/science.1119623. [DOI] [PubMed] [Google Scholar]
- Bharde A. A., Palankar R., Fritsch C., Klaver A., Kanger J. S. PLoS One. 2013;8:e68879. doi: 10.1371/journal.pone.0068879. [DOI] [PMC free article] [PubMed] [Google Scholar]
- Toettcher J. E., Voigt C. A., Weiner O. D., Lim W. A. Nat. Methods. 2011;8:35–38. doi: 10.1038/nmeth.f.326. [DOI] [PMC free article] [PubMed] [Google Scholar]
- Wallace C. S., Truskey G. A. Am. J. Physiol. 2010;299:H338–H346. doi: 10.1152/ajpheart.01029.2009. [DOI] [PMC free article] [PubMed] [Google Scholar]
- Heberlein K. R., Straub A. C., Isakson B. E. Microcirculation. 2009;16:307–322. doi: 10.1080/10739680902744404. [DOI] [PMC free article] [PubMed] [Google Scholar]
- Sandow S. L., Hill C. E. Circ. Res. 2000;86:341–346. doi: 10.1161/01.res.86.3.341. [DOI] [PubMed] [Google Scholar]
- Shaya O. Dev. Cell. 2017;40:505–511. doi: 10.1016/j.devcel.2017.02.009. [DOI] [PMC free article] [PubMed] [Google Scholar]
- Wei H. Lab Chip. 2010;11:238–245. doi: 10.1039/c0lc00121j. [DOI] [PubMed] [Google Scholar]
- Koutsiaris A. G., Tachmitzi S. V., Batis N. Microvasc. Res. 2013;85:34–39. doi: 10.1016/j.mvr.2012.11.003. [DOI] [PubMed] [Google Scholar]
- Gray K. M., Stroka K. M. Cell Dev. Biol. 2017:106–117. doi: 10.1016/j.semcdb.2017.06.002. [DOI] [PubMed] [Google Scholar]
- Balcells M. Circulation. 2010;121:2192–2199. doi: 10.1161/CIRCULATIONAHA.109.877282. [DOI] [PMC free article] [PubMed] [Google Scholar]
- Shi Z.-D., Tarbell J. M. Ann. Biomed. Eng. 2011;39:1608–1619. doi: 10.1007/s10439-011-0309-2. [DOI] [PMC free article] [PubMed] [Google Scholar]
- Ostrowski M. A. Biophys. J. 2014;106:366–374. doi: 10.1016/j.bpj.2013.11.4502. [DOI] [PMC free article] [PubMed] [Google Scholar]
- Oh K. W., Lee K., Ahn B., Furlani E. P. Lab Chip. 2012;12:515–545. doi: 10.1039/c2lc20799k. [DOI] [PubMed] [Google Scholar]
- Morrison T. M., Choi G., Zarins C. K., Taylor C. A. J. Vasc. Surg. 2009;144:724–732. doi: 10.1016/j.jvs.2008.11.056. [DOI] [PMC free article] [PubMed] [Google Scholar]
- Yuda S. Echocardiography. 2011;28:899–906. doi: 10.1111/j.1540-8175.2011.01443.x. [DOI] [PubMed] [Google Scholar]
- Chiu J.-J., Chien S. Physiol. Rev. 2013;91(1):327–387. doi: 10.1152/physrev.00047.2009. [DOI] [PMC free article] [PubMed] [Google Scholar]
- Sinha R., Gac S., Verdonschot N., Van Den Berg A., Koopman B. Sci. Rep. 2016:1–12. doi: 10.1038/srep29510. [DOI] [PMC free article] [PubMed] [Google Scholar]
- Metavarayuth K., Sitasuwan P., Zhao X., Lin Y., Wang Q. ACS Biomater. Sci. Eng. 2016;2(2):142–151. doi: 10.1021/acsbiomaterials.5b00377. [DOI] [PubMed] [Google Scholar]
- Zeng Y., Kang Y., Rau L., Hsu F., Tsai S. Biomed. Mater. 2017;12:045019. doi: 10.1088/1748-605X/aa766d. [DOI] [PubMed] [Google Scholar]
- Werner M. Adv. Sci. 2017;4:1600347. doi: 10.1002/advs.201600347. [DOI] [PMC free article] [PubMed] [Google Scholar]
- Formentín P. J. Biomater. Appl. 2015;30:398–408. doi: 10.1177/0885328215588414. [DOI] [PubMed] [Google Scholar]
- Gridley T. Curr. Top. Dev. Biol. 2010;2153:2709–2718. doi: 10.1016/S0070-2153(10)92009-7. [DOI] [PMC free article] [PubMed] [Google Scholar]
- Li X. Nat. Med. 2009;15:1289–1297. doi: 10.1038/nm.2021. [DOI] [PMC free article] [PubMed] [Google Scholar]
- Mack J. J. Nat. Commun. 2017;8:1–18. [Google Scholar]
- Loerakker S., Stassen O. M. J. A., ter Huurne F. M., Boareto M., Bouten C. V. C., Sahlgren C. M. Proc. Natl. Acad. Sci. U. S. A. 2018:1715277115. doi: 10.1073/pnas.1715277115. [DOI] [PMC free article] [PubMed] [Google Scholar]
- Liu H., Kennard S., Lilly B. Vascular. 2009;104:466–475. doi: 10.1161/CIRCRESAHA.108.184846. [DOI] [PMC free article] [PubMed] [Google Scholar]
Associated Data
This section collects any data citations, data availability statements, or supplementary materials included in this article.