Abstract
Objective:
To explore psychometrics of the Romanian version of the Hospital Survey on Patient Safety Culture (HSOPS) released by the US Agency for Healthcare Research and Quality in 2004.
Material and methods:
The original US survey with 12 composites and 42 items was translated (back translation method), pre-tested on a few staff and then minimally adjusted. A qualitative cross-sectional study was carried out in units from six hospitals in four Romanian regions, based on the census of medical and non-medical staff (n. 969). Participants completed a paper-based self-administered questionnaire. The main outcome measures were: descriptive statistics, confirmatory factor analysis (CFA), internal reliability and intercorrelations among survey composites.
Results:
Nurses accounted for 67% of respondents, and doctors for 23%. Most work units were surgery (24%) and medical specialties (22%). After individual-level CFA on half of the sample, Staffing and Overall perceptions of patient safety composites were dropped and Feedback & communication about error and Communication openness composite items were aggregated to a single Communication composite. Subsequent CFA on the second half of the sample indicated that the novel composite structure adequately fitted the data: comparative fit index=0.90; root mean square error of approximation=0.06; standardized root mean square residual=0.06. Internal consistency was .0.70 for most composites. Spearman intercorrelations among the patient safety composites at the individual level averaged 0.28.
Conclusion:
Psychometrics of the Romanian version of the HSOPS tested in Romania was acceptable for nine composites with 31 items. Integration of this survey with items more pertinent for Romania is suggested.
Keywords:patient safety, psychometrics, HSOPS, hospitals, Romania.
INTRODUCTION
Patient safety can be viewed as “the mechanisms, tools, underlying resources and required actions to reduce and ultimately avoid unintentional harm to patients” (1). The World Health Organization estimated that one in ten patients is harmed while receiving hospital care in developed countries (2). The extent of the phenomenon remains unclear in developing and transitional countries, such as Romania (Box 1) (3), due to little objective and reliable evidence available on the frequency of adverse events (4). Despite of almost three decade continuous reforms, Romania has to cope with serious issues in responding to the population’s healthcare needs. In a recent analysis of 35 European countries, Romania exhibited the poorest Euro Health Consumer Index (i.e., a measure to what extent a country meets expectations of good, consumer-friendly healthcare), while the publicly funded healthcare systems of Europe have steadily improved in the last ten years (5). Obsolete healthcare buildings, shortage of material resources and personnel (mainly due to “brain drain”), important territorial discrepancies in the healthcare service provision and corruption are critical issues in this country, as a result of chronic underfunding (deeper after the economic crisis), poor legislation and management (5-9).
Patient safety is a fundamental component of quality in healthcare and it represents a critical challenge in Romania. In a recent European Union survey based on 28 countries (EU28), 73% of Romanians (as opposed to an average of 28% among EU28 citizens) consider the quality of health services as being poor (10). At least five out of ten Romanians think that patients could be harmed by hospital adverse events in Romania (e.g., incorrect, missed or delayed diagnoses: 68%; healthcare acquired infections: 66%; medication related errors: 60%; surgical errors: 59%; medical device or equipment-related errors: 52%). Sixteen percent of the Romanians declare having experienced an adverse event when receiving healthcare (11).
The EU Network for Patient Safety and Quality of Care (PaSQ) project has given Romania an important opportunity to exchange information and experiences on best practices for promoting patient safety and quality in healthcare with the other EU countries. A key topic addressed in this project is promoting a culture of patient safety, since there is some evidence suggesting that improvement in safety culture has a positive impact on patient and staff outcomes. Safety culture is a multidimensional concept intended to capture the way patient safety is thought about, structured and implemented in an organisation, including staff attitudes about patient safety (12). Measuring it is a prerequisite for promoting a culture of patient safety. This area of patient safety has been yet little explored in Romania, by contrast with other EU countries. In the present study, we experimented in Romania one of the most popular patient safety culture questionnaires currently available, which is also one of the three highest recommended by the EU to its member states (13), i.e., the US Hospital Survey on Patient Safety Culture (HSOPS), designed by the Agency for Healthcare Research and Quality (AHRQ) in 2004. The aim of this paper is to explore psychometric properties of the Romanian version of the US HSOPS.
MATERIAL AND METHODS
Development of the Romanian Hospital SOPS
The AHRQ HSOPS assesses staff opinions about patient safety issues. It includes 42 items that measure 12 composites of patient safety culture. The Hospital SOPS was translated into Romanian, with the back translation method, by two independent researchers fluent in English. It was checked with hospital staff for accuracy and clarity.
The translation process was based on the AHRQ guidance, available at: https://www.ahrq. gov/sops/quality-patient-safety/patientsafetyculture/ pscintusers.html#guidelines. Since it is uncommon to hire temporary staff in Romanian hospitals, as suggested by the participants in the pre-test of the survey, the item A7 asking if the hospital uses “more agency/temporary staff than is best for patient care” was excluded. Thus, the Romanian version of the HSOPS included 41 items.
Sample and Response Statistics
Paper surveys were distributed to 1,184 staff in six different size hospitals (range 250- 1,500 beds) across four Romanian regions: South-West (Craiova), South (Bucharest), Center (Brasov) and North-West (Cluj-Napoca). Hospitals were involved in the study based on feasibility criteria; three of them administered the survey to all staff; the remaining three surveyed specific units. We received back 999 surveys. Data were cleaned for blank records (where responses to all composite items were missing) and straight-lining (where responses to all items in Sections A, B, C, D and F were the same). Thirty records were excluded during the data cleaning process. The final data set consisted of 969 surveys for an overall adjusted response rate of 82%. All items had good variability with low rates of missing (ranging from 0 to 2% missing responses per item).
Measures
Most of the items ask respondents to answer using five-point Likert-type scale in terms of agreement (Strongly agree to Strongly disagree) or frequency (Always to Never). In all, three of the 12 patient safety culture composites use the frequency response option (‘Feedback and communication about error’, ‘Communication openness’ and ‘Frequency of events reported’), while the other nine composites use the agreement response option. ‘Patient safety grade’ was measured with a five-point scale ranging from Excellent to Failing. Negatively worded items were reverse-coded, because an answer on a negatively worded item indicates a positive response (14). Data were analyzed examining item response variability, reliability and confirmatory individual-level factor analysis of the patient safety culture composites.
Confirmatory Factor Analysis
The purpose of conducting Confirmatory Factor Analysis (CFA) is to confirm a particular pattern of relationships among survey items predicated on past research and theory (15). The survey composites and items in the HSOPS have already been validated in the US. However, researchers have recommended changes to the composite structure after completing CFAs of HSOPS translations (16-20). Therefore, we randomly split the Romania sample in half, stratifying by hospital and position so that any recommended changes to the survey could be confirmed on an unbiased Romanian sample (first sample n = 480, second sample n = 489).
Given that all of the composite items are in Likert-type scales with five response options, we used robust maximum likelihood parameter estimates because it downweights outliers (21). Factor loadings that are 0.40 or higher indicate that the item’s relationship to the a priori composite is acceptable (22). Estimated correlations between factors, which are unbiased estimates of the true correlation between the underlying latent composites and are generally higher than the constructed Pearson correlations, should be below 0.85 (23).
Several indices were examined to determine model fit. First, the chi-square goodness-of-fit statistic was examined. For chi-square statistics lower and non-significant chi-squares indicate good fit. Chi-square, however, is influenced by sample size such that the larger the sample size, the more likely it is that the chi-square will be significant. A large chi-square may emerge even when the model fits the data well; therefore, other fit statistics were also examined. Some researchers examine the chi-square index divided by the degrees of freedom, which might be less sensitive to sample size; the criterion is < 5 (24).
The comparative fit index (CFI) compares the existing model fit with a null model, which assumes that the latent variables in the model are uncorrelated. That is, it gauges the percent of lack of fit that is accounted for by going from the null model to the proposed model. A popular criterion is that the factor structure has adequate fit if the CFI is at least 0.90; however, other researchers have suggested a more stringent criterion of at least 0.95 (25).
We also examined the standardized root mean square residual (SRMR), which is the standardized difference between the observed covariance and predicted covariance. A value of zero for the SRMR indicates perfect fit, but a value <0.08 is considered a good fit (26).
The fourth and final statistic examined to determine the adequacy of fit is the root mean square error of approximation (RMSEA). The RMSEA is a parsimony-adjusted index that favors the simplest model possible (23). It is also a ‘badness-of-fit’ index in that a value of zero indicates the best fit and higher values indicate worse fit. Some researchers have arbitrarily suggested that a value greater than 0.06 suggests poor fit. However, recent empirical evaluation suggests that it is impossible to identify a universal cutoff point for RMSEA (27). Rather, RMSEA should be used in conjunction with other fit indices to determine model fit.
RESULTS
Descriptive Statistics
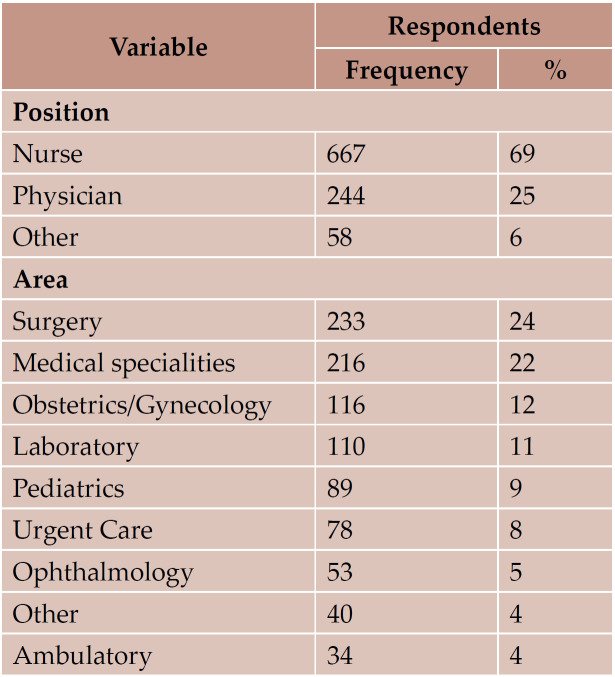
Table 1 shows the respondents positions and work areas. Nurses constituted the largest proportion of respondents (67%), followed by doctors (23%). Most respondents were from surgery (24%) and medical specialties (22%); 90% had direct interaction with patients.
Individual-level CFA
Initial CFA results on the first half of the sample, which included the 12 patient safety culture composites and 41 items, indicated that the Romanian version of the HSOPS did not adequately fit the a priori US structure.
The latent composite correlations between the "Teamwork across units" and "Handoffs & transitions" (0.90), "Feedback & communication about error" and "Communication openness" (0.88), and "Organizational learning – continuous improvement" and "Overall perceptions of patient safety” (0.87) were excessively high. In addition, three items, two within the “Staffing” composite (A2 and A5) and one within the "Overall perceptions of patient safety" composite (A15), had standardized factor loadings below the 0.40 criterion (0.31, 0.13, and 0.36, respectively).
The "Overall perceptions of patient safety" composite was dropped from the CFA model because it was theoretically the more ambiguous of the two composites. Principal factor analysis of "Feedback & communication about error" and "Communication openness” composite items with Varimax rotation – to maximize factor loadings and discriminate between potential factors – resulted in a single factor without rotation of all six items. Therefore, we aggregated the two composites to a single "Communication" composite. The same factor analysis approach was used for the "Teamwork across units" and "Handoffs & transitions” composite items. A Varimax rotated factor pattern indicated two factors. Three “Teamwork across units" items (F2, F4, and F10) had factor loadings >0.6 on the first factor and loadings <0.4 on the second rotated factor (22). Only two “Handoffs & transitions" items (F5 and F11) met the aforementioned loading criteria on the second factor.
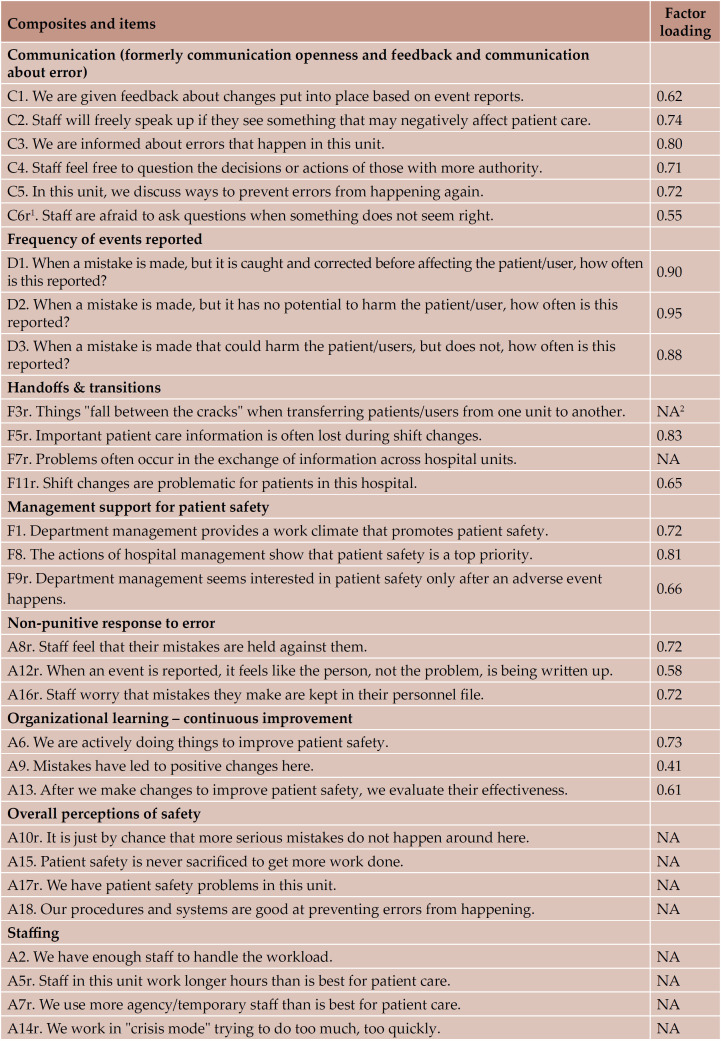
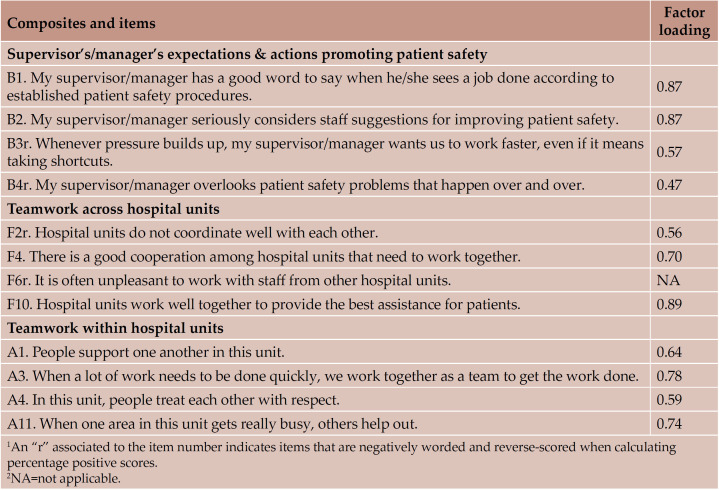
Based on the CFA results of the a priori US structure on the first half of the Romanian sample, we amended the structure to nine safety composites and 31 items. Subsequent CFA results on the second half of the Romanian sample indicated that the novel composite structure adequately fit the data. All factor loadings were above criterion (.0.40) (Table 2). All latent correlations were below our criterion of 0.85 (range 0.02.0.84).
As can be seen in Table 3, the model fit indices for the individual CFA on the second half of the sample were acceptable. The chi-square test (÷2 = 979.24, df = 390, p < 0.0001) was significant (ideally, a non-significant chi-square indicates good fit). However, since the chi-square value is substantially affected by sample size (the greater the sample size, the more likely chi-square will be significant), we also examined the chisquare index divided by the degrees of freedom, which was 2.51, below the criterion of 5. The CFI was 0.90, meeting our criterion and indicating acceptable fit. The SRMR score also showed relatively good fit with a value of 0.06. An SRMR of 0.08 or lower indicates good model fit. The RMSEA was below the criterion of 0.06.
Reliability analysis
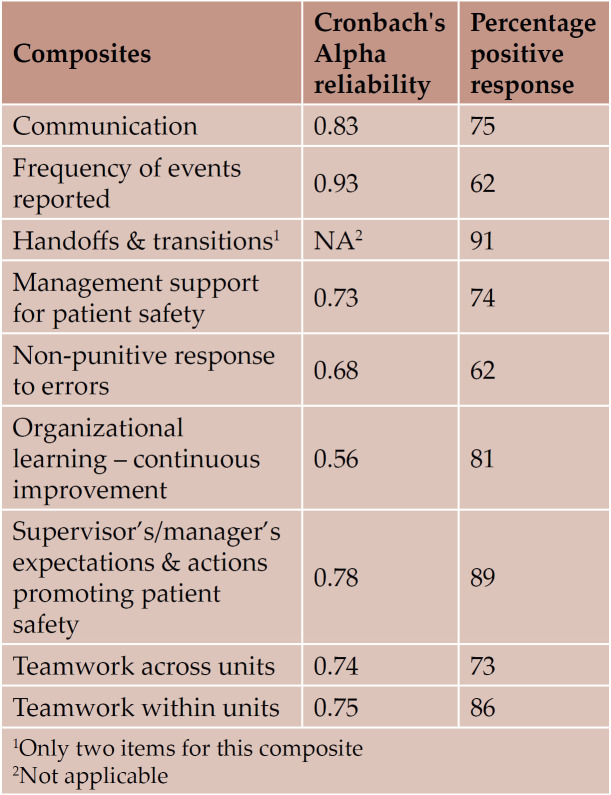
Cronbach’s alphas were calculated on the second half of the sample for the nine composites retained in the final Romanian HSOPS CFA model (Table 4). Two reliabilities fell below the criterion of 0.70: “Organizational learning – continuous improvement” and “Non-punitive response to errors”. The percentage of positive responses per composite ranged from 62 to 91%.
Intercorrelations among the Patient Safety Composites
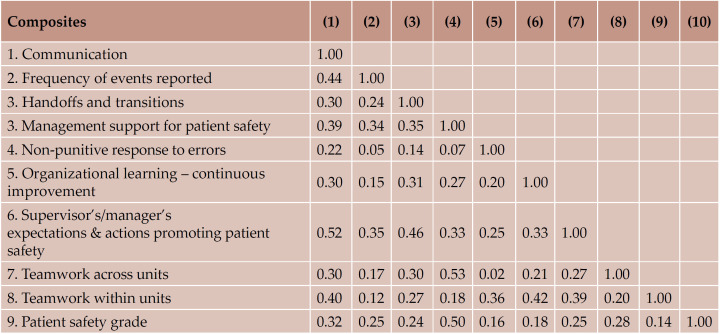
Table 5 displays Spearman intercorrelations among the patient safety composites at the individual level. Individual-level correlations averaged 0.28 (range 0.02–0.53). The lowest intercorrelation was between “Teamwork across units” and “Organizational learning - continuous improvement”, while the highest was between ‘Teamwork across units’ and ‘Non-punitive response to errors’, which included all items from the original ‘Communication openness’ and ‘Feedback & communication about error’. Spearman intercorrelations between patient safety composites and “Patient safety grade” at the individual level were also explored to determine whether the composites were related to the self-reported outcome and were all statistically significant (p < 0.01); the average composite correlation was 0.26 (range: 0.14–0.50).
DISCUSSION
In this study, we assessed the psychometric properties of the Romanian version of the US HSOPS. It was applied for the first time in Romania, in six hospitals. Analyses carried out on a wdata set of n. 969 valid records revealed that the original structure of the US survey, with 12 factors and 42 items, did not perform well. The Romanian version of the HSOPS was acceptable for a 9-factor structure based on 31 items.
The composites “Overall perceptions of safety” and “Staffing” exhibited problematic psychometrics and were excluded from the final Romanian version. In other studies, they were merged in a single composite (26). Two formerly separate composites, i.e., “Communication openness” and “Feedback and communication about error”, performed better after they were merged, in line with findings by other studies (17-19). No item shift from one composite to another was necessary, unlike other authors’ reports (20).
During the psychometric validation of ten items, nine of them were negatively worded. In our opinion, it could be due to insufficient attention paid or time allocated by the Romanian respondents to correctly read or understand the item meaning, rather than to redundancy or ambiguity in the translation. It is well known that Romania is one of the countries with the lowest staff/patient ratio in the EU (3).
Overall, percentages of positive response rate by composite were higher than in many other countries (ranged from 59% for “Frequency of events reported” to 91% for “Hand-offs and transitions”). This was rather unexpected, given the impressive gap between Romania and the EU28 average in terms of healthcare budget, personnel and availability of equipment and medicines and the prevailing dissatisfaction of the population with the performance of the healthcare system. Therefore, we believe that both qualitative and further quantitative research would be necessary to explore more in depth the reasons for these findings. Since material and personnel shortage is a consolidated issue in their practice, staff currently working in the hospitals in our study might be more sensitive to hazards and anticipate errors or incidents through major awareness, collaboration, communication and learning from problem solving. Management/ supervisors might really act as a supporting resource for their staff. The units assessed volunteered to participate in the study, so staff might have been more receptive and open to patient safety initiatives than staff in other units which would have declined participation. On the other hand, some authors observed that, in some circumstances, people would avoid to report negative things about their workplace, and therefore, they may rate items of the survey higher (18). Finally, as for most self-reported surveys with numerous items, it is likely that respondents loose interest and give hurried and social acceptable rather than accurate responses (18).
“Frequency of events reported” (59%) and “Non-punitive responses to error” (61%) were the lowest positively scored composites in our study, yet higher than in other countries. Romanian staff fears of being “named and blamed” when errors or adverse events occur in their practice. The most emphasised current reporting systems in the country concern healthcare associated infections and adverse drug reactions. Unfortunately, they are highly characterised by under-reporting (28-30). We believe that cultural barriers to reporting could be overcome through continuous education (starting with graduating medical students), increased leadership and a regulatory framework encouraging learning from errors, as well as updated standards for hospital accreditation.
Patient safety culture should be interpreted and benchmarked taking into consideration broader cultural characteristics of the respondents. Many studies based on developing countries highlighted that the social, economic and political context are important factors influencing organisational culture. HSOPS and other currently available tools, most of which were designed by developed countries, converge toward seven subcultures of patient safety culture: leadership, teamwork, evidence-based, communication, learning, just, and patient-centred (31). In the tools that developing countries use to measure patient safety culture, they may need to include peculiar aspects which are not common in developed countries such as availability of hospital resources (consumables, drugs, equipment), infrastructure and hierarchical dynamics, etc (32). Moreover, safety culture is in part reflective of societal practices and habits for communicating and acting, and relies on the national culture of the worker. According to the study of Noort et al (33), safety culture is inversely proportional with the uncertainty avoidance index of a nation, which rises further concerns about the appropriateness of inter-country benchmarking.
There are several limitations to our study. Due to participation of voluntary units only, selection bias could not be avoided. Despite low cost and rapidity, self-administered survey might not accurately reflect the respondents’ perceptions. Although the participant hospitals were located in different regions and all of them were public, we cannot generalize results to all the public hospitals in the country. Participants in our study were assured of the anonymity of their responses; however, the paper surveys were distributed in the unit by the head nurse, which might have raised doubts about confidentiality (in our sample, nurses accounted for 67% of the respondents).
Despite these limitations, our study remains the first of this type in Romania. It completes the knowledge on the validation of the HSOPS in the EU with information on the Central and Eastern countries.
There is evidence that safety culture impacts on staff safety behaviours, patient outcomes and injury rates among staff (12). Further research to better understand patient safety culture in the hospitals in our study could focus on collecting data on morbidity and readmission rates as proxy variables for possible adverse events among patients, as well as on injury rates among staff. Since only nine of the 12 factors of the US model confirmed their psychometric properties in the Romanian version, further qualitative research is needed to understand which aspects, different from those studied in developed countries, should be included in a better tailored tool to measure patient safety culture in Romania.
CONCLUSION
Promoting patients’ safety by establishing a positive safety culture in the healthcare staff is a key challenge for healthcare organizations. In developing countries, a mix of numerous unfavourable factors attributed to limited financial resources (such as understaffing, inadequate structures and overcrowding, lack of health-care commodities and shortage of basic equipment, poor hygiene and sanitation) contribute to unsafe patient care. Given that healthcare systems are constantly evolving, creating and maintaining a culture of patient safety is of increasing importance. We believe that measuring and continually developing this culture can prevent patient injury and avoid lawsuits involving clinicians and nursing staff. An appropriate tool to measure the baseline culture and monitor it in time would be necessary. The Romanian version of the HSOPS is acceptable, but with less factors than the original US version. It is likely that it needs to be integrated with items more pertinent for developing countries.
Conflicts of interest: none declared.
Financial support: none declared.
Acknowledgments: The authors thank the management of the hospitals participating in the study and all the staff who responded to the questionnaire. The authors are grateful to the Latin Association for Analysis of Healthcare Systems (www.alass.org) for their patronage for the IRIS Project.
TABLE 1.
Respondent distribution by professional position and work area
TABLE 2.
Romanian hospital survey on patient safety: factor loadings obtained with final individual confirmatory factor analysis
TABLE 2.
Romanian hospital survey on patient safety: factor loadings obtained with final individual confirmatory factor analysis
TABLE 3.
Romanian hospital survey on patient safety: final individual confirmatory factor analysis model fit indices
TABLE 4.
Romanian hospital survey on patient safety: Cronbach’s alpha reliability and percentage of positive response
TABLE 5.
Romanian hospital survey on patient safety: intercorrelations among patient safety composites at the individual level
Contributor Information
Carmen TEREANU, Department of Hygiene and Prevention, Agenzia di Tutela della Salute, Bergamo, Italy.
Scott Alan SMITH, Westat, Rockville, Maryland, USA.
Mugurel Stefan GHELASE, Department of Public Health and Healthcare Management, University of Medicine and Pharmacy of Craiova, Romania.
Giuseppe SAMPIETRO, Epidemiological Service, Agenzia di Tutela della Salute, Bergamo, Italy.
Adrian MOLNAR, Management, “Niculae Stancioiu” Heart Institute, Cluj-Napoca, Romania.
Antoaneta DRAGOESCU, Department of Public Health and Healthcare Management, University of Medicine and Pharmacy of Bucharest, Romania.
Florentina Ligia FURTUNESCU, Department of Public Health and Healthcare Management, University of Medicine and Pharmacy of Bucharest, Romania.
Camelia STANESCU, System Engineer, “Niculae Stancioiu” Heart Institute, Cluj-Napoca, Romania.
Olguta Alice GAVRILA, Management, Filantropia Hospital, Craiova, Romania.
Anca PATRASCU, Head Obstetrics and Gynaecologic Unit, Filantropia Hospital, Craiova, Romania.
Andreea Loredana GOLLI, Department of Public Health and Healthcare Management, University of Medicine and Pharmacy of Craiova, Romania.
Manuela DRAGOMIR, Department of Public Health and Healthcare Management, University of Medicine and Pharmacy of Craiova, Romania.
REFERENCES
- WHO Patient Safety Research. . A brief synopsis on patient safety: http://www.euro.who.int/__data/assets/ pdf_file/0015/111507/E93833.pdf?ua=1 (Sept. 2017, date last accessed). 2010; [Google Scholar]
- WHO Patient Safety Research. . Global Priorities for Patient Safety Research. Better knowledge for safer care: http://whqlibdoc. who.int/publications/2009/9789241598620_ eng.pdf (September 26th 2017). 2009; [Google Scholar]
- WHO European Health for All database . (HFA-DB): https://gateway.euro.who.int/ en/data-sources/european-health-for-alldatabase (Sept. 2017, date last accessed). 2017; [Google Scholar]
- Carpenter KB, Duevel MA, Lee PW, et al. Measures of patient safety in developing and emerging countries: a review of the literature. Qual Saf Health Care. 2010;1:48–54. doi: 10.1136/qshc.2008.031088. [DOI] [PubMed] [Google Scholar]
- Björnberg A. . Euro Health Consumer Index 2016 Report, Health Consumer Powerhouse Ltd., 2017: https://healthpowerhouse.com/ files/EHCI_2016/EHCI_2016_report.pdf (Sept. 2017, date last accessed). 2016; [Google Scholar]
- Suciu SM, Popescu CA, Ciumageanu MD, Buzoianu AD. Physician migration at its roots: a study on the emigration preferences and plans among medical students in Romania. Hum Resour Health. 2017;1:6. doi: 10.1186/s12960-017-0181-8. [DOI] [PMC free article] [PubMed] [Google Scholar]
- Butiu CA. Butiu CA. Social Change Review. 2016;1:3–23. [Google Scholar]
- Dumitrache L, Nae M, Dumbrãveanu D, et al. Contrasting Clustering in Health Care Provision in Romania: Spatial and Aspatial Limitations Procedia. Environmental Sciences. 2016;32:290–299. [Google Scholar]
- Vladescu C, Scîntee SG, Olsavszky V, et al. Romania: Health system review. Health Systems in Transition. http://www.healthobservatory.eu (Sept. 2017, date last accessed). 2016;4:1–170. [PubMed] [Google Scholar]
- European Union. “Patient Safety and Quality of Care”. Special Eurobarometer 411, 2014: http://ec.europa.eu/commfrontoffice/ publicopinion/archives/ebs/ebs_411_en.pdf (Sept. 2017, date last accessed). 2014;411 [Google Scholar]
- European Union. “Patient safety and quality of healthcare”. Special Eurobarometer 327, 2010: http://ec.europa.eu/commfrontoffice/ publicopinion/archives/ebs/ebs_327_ en.pdf (Sept. 2017, date last accessed). 2010;327 [Google Scholar]
- Health Foundation 2011. Does improving safety culture affect patient outcomes? http://www.health.org.uk/sites/health/files/ DoesImprovingSafetyCultureAffectPatientOutcomes. pdf (Sept. 2017, date last accessed). 2017; [Google Scholar]
- The European Network for Patient Safety (EUNetPaS). Use of Patient Safety Culture Instruments and Recommendations, European Society for Quality in Healthcare] Office for Quality Indicators Denmark. http://www.pasq.eu/DesktopModules/ BlinkQuestionnaires/QFiles/448_WP4_ REPORT%20%20Use%20of%20%20 PSCI%20and%20recommandations%20 -%20March%20%202010.pdf (Sept. 2017, date last accessed). 2010; [Google Scholar]
- Hospital Survey on Patient Safety Culture 2014 User Comparative Database Report. (Prepared by Westat, Rockville, MD, under Contract No. HHSA 290201300003C). Psoriasis in association with prolactinoma: three cases. Rockville, MD: Agency for Healthcare Research and Quality; March 2014. AHRQ Publication No. 14-0019-EF. https://www. ahrq.gov/sites/default/files/wysiwyg/ professionals/quality-patient-safety/ patientsafetyculture/hospital/2014/ hsops14pt1.pdf. (Sept. 2017, date last accessed). 2014; [Google Scholar]
- De Vellis RF. Scale Development Theory and Applications. Thousand Oaks, CA: Sage. 2003; [Google Scholar]
- Waterson P, Griffiths P, Stride C, et al. Psychometric properties of the Hospital Survey on Patient Safety Culture: findings from the UK. Qual Saf Health Care. 2010;19:e2. doi: 10.1136/qshc.2008.031625. [DOI] [PubMed] [Google Scholar]
- Perneger TV, Staines A, Kundig F. Internal consistency, factor structure and construct validity of the French version of the Hospital Survey on Patient Safety Culture. BMJ Qual Saf. 2014;23:389–397. doi: 10.1136/bmjqs-2013-002024. [DOI] [PubMed] [Google Scholar]
- Bodur S, Filiz E. Validity and reliability of Turkish version of “Hospital Survey on Patient Safety Culture” and perception of patient safety in public hospitals in Turkey. BMC Health Serv Res. 2010;10:28. doi: 10.1186/1472-6963-10-28. [DOI] [PMC free article] [PubMed] [Google Scholar]
- Sarac C, Flin R, Mearns K, et al. Hospital survey on patients safety culture: psychometric analysis on a Scottish sample. BMJ Qual Saf. 2011;20:842–848. doi: 10.1136/bmjqs.2010.047720. [DOI] [PubMed] [Google Scholar]
- Occelli P, Quenon JL, Kret M, et al. Validation of the French version of the Hospital Survey on Patient Safety Culture questionnaire. Int J Qual Health Care. 2013;4:459–468. doi: 10.1093/intqhc/mzt047. [DOI] [PubMed] [Google Scholar]
- SAS Institute Inc. SAS/STAT® 14.1. User’s Guide. Cary, NC: SAS Institute Inc. 2015; [Google Scholar]
- Matsunaga M. How to factor-analyze your data right: Do’s, Don’ts, and How-to’s. Int J Psych Res. 2010;1:97–110. [Google Scholar]
- Kline RB. Principles and Practice of Structural Equation Modeling. NewYork: Guilford Press. 2005; [Google Scholar]
- Schumacker RE, Lomax RG. A Beginner’s Guide to Structural Equation Modeling. Mahwah, NJ: Lawrence Erlbaum Associates. 2004; [Google Scholar]
- Hu LT, Bentler PM. Evaluating model fit. In: Hoyle RH. Structural Equation Modeling: Concepts, Issues, and Applications. Thousand Oaks, CA: Sage. 1995; :76–99. [Google Scholar]
- Kenny DA. Measuring Model Fit. http://davidakenny.net/cm/fit.htm. 2017; [Google Scholar]
- Chen F, Curran PJ, Bollen KA, et al. An empirical evaluation of the use of fixed cutoff points in RMSEA test statistic in structural equation models. Sociol Methods Res. 2008;36:462–494. doi: 10.1177/0049124108314720. [DOI] [PMC free article] [PubMed] [Google Scholar]
- Farcas A, Macavei C, Bojita M. Physician’s attitude towards voluntary reporting adverse drug reactions. Farmacia. 2008;5:563–570. [Google Scholar]
- Mada L. Hospital Acquired Infection: Advantages of a Computerized Surveillance. Annals Computer Science Series. 2008;1:135–143. [Google Scholar]
- Paveliu MS, Bengea-Luculescu S, Toma M, et al. Perception on adverse drug reaction reporting by physicians working in Southern Romania. Maedica J Clin Med. 2013;1:17–25. [PMC free article] [PubMed] [Google Scholar]
- Sammer CE, Lykens K, Singh KP, et al. What is Patient Safety Culture? A Review of the Literature. J Nurs Scholarsh. 2010;2:156–165. doi: 10.1111/j.1547-5069.2009.01330.x. [DOI] [PubMed] [Google Scholar]
- Aveling EL, Kayonga Y, Nega A, et al. Why is patient safety so hard in lowincome countries? A qualitative study of healthcare workers’ views in two African hospitals. Globalization and Health. 2015;11:6. doi: 10.1186/s12992-015-0096-x. [DOI] [PMC free article] [PubMed] [Google Scholar]
- Noort MC, Reader WT, Shorrock S, et al. The relationship between national culture and safety: implications for international safety culture assessments. J Occup Organ Psychol. 2016;89:515–538. doi: 10.1111/joop.12139. [DOI] [PMC free article] [PubMed] [Google Scholar]


