

Abstract
Sensory symptoms, including auditory processing deficits, are common in autism spectrum disorder (ASD). Processing of temporal aspects of auditory input is understudied, yet deficits in this domain could contribute to language-related impairments. In children with ASD and well-matched controls, this study examined electrophysiological response to silent gaps in auditory stimuli. Results revealed attenuated amplitude of the P2 event-related potential (ERP) component in ASD. P2 amplitude reduction also associated with sensory, language, and diagnostic features. These results suggest that neural response during auditory gap detection is a promising ASD biomarker that could be useful for stratifying subgroups and evaluating treatment response.
Sensory abnormalities are a key feature of autism spectrum disorder (ASD), spanning multiple modalities, and occurring with such prevalence and impact that they are now included in the diagnostic criteria for ASD (American Psychiatric Association, 2013). Substantial evidence suggests atypical auditory processing in ASD (Kellerman, Fan, & Gorman, 2005), affecting both processing of speech sounds and more complex language (Rapin & Dunn, 2003; Tager-Flusberg & Caronna, 2007), as well as more basic, non-speech sounds (see Foss-Feig, Stone, & Wallace, 2012 for review). Increasing evidence suggests that individuals with ASD have particular difficulty with temporal aspects of auditory processing, which include detection of timing-aspects of auditory stimuli, such as their duration, onset and offset, and rapid changes within them (Lepisto et al., 2006; Oram Cardy, Flagg, Roberts, Brian, & Roberts, 2005; Orekhova et al., 2009).
Perception of rapid (i.e., on the order of milliseconds) changes in auditory stimuli is central to distinguishing phonemes and parsing speech (Poldrack et al., 2001). Atypical neural responses to speech sounds (Jeste & Nelson, 2009; Kujala et al., 2013) have been related to the extent of language impairments in children with ASD (Oram Cardy, Flagg, Roberts, & Roberts, 2008; Roberts et al., 2011); however, neural response during more basic aspects of auditory temporal processing has rarely been explored.
Recent work exploring auditory temporal processing in ASD has capitalized on classic psychophysical paradigms that show sensitivity to low-level deficits in other populations for whom language impairments are fundamental (Tallal, 1980; Tallal & Piercy, 1973; Wright et al., 1997). In particular, deficits in auditory temporal processing have been shown using temporal order judgment (TOJ) tasks (Kwakye, Foss-Feig, Cascio, Stone, & Wallace, 2011), as well as with gap detection paradigms (Bhatara, Babikian, Laugeson, Tachdjian, & Sininger, 2013; Foss-Feig, Schauder, Key, Wallace, & Stone, in press). These findings suggest that individuals with ASD both require longer to detect presentation order of two sequential stimuli and have more difficulty detecting brief silent “gaps” in ongoing sounds. Moreover, the latter two studies show an association between poorer gap detection abilities and weaker speech perception and language processing skills in ASD samples.
Understanding the neural processes associated with impaired auditory temporal processing abilities in children with ASD may be helpful for several reasons. First, it may shed light on the biological underpinnings of the deficits, perhaps pointing to specific brain functions or regions that might underlie observed deficits. Second, it may suggest ways in which impaired detection of silent gaps in auditory stimuli fits with the broader clinical and neurobiological picture associated with ASD, positioning it as a potential biomarker related to ASD pathology and associated with particular clinical symptoms. Finally, it may indicate broader abnormalities in the timing or extent of the brain response to sensory stimuli that could help differentiate ASD from other disorders and perhaps inform novel interventions. Event-related potentials (ERPs), extracted from ongoing electroencephalography (EEG) data during task performance, offer a window into underlying neural activity associated with specific brain processing with high (i.e., on the order of milliseconds) temporal resolution. Thus, recording of ERPs during gap detection presents a key method for understanding the neural basis of impaired auditory temporal processing in ASD.
A handful of studies have used EEG to explore timing of the brain response to gaps in auditory stimuli in both typical and hearing-impaired populations. Bertoli, Heimberg, Smurzynski, and Probst (2001) examined the mismatch negativity (MMN; i.e., an index of pre-attentive deviance detection) in response to silent gaps in pure tone stimuli, finding frontal and central MMN responses to long-duration (i.e., 9 or 15ms) gaps, but no MMN when gap sizes were at or below behavioral detection thresholds determined in a sample of participants with intact hearing. Critically, MMN amplitude was larger and latency was earlier for longer gap durations, suggesting sensitivity of the ERP response to the relative detectability of gap stimuli. Also, in elderly adults with normal hearing relative to younger adults, delayed latency and reduced amplitude of MMN response to silent gaps were reported in the absence of behavioral differences in gap detection (Bertoli, Smurzynski, & Probst, 2002). These findings suggest that ERP response to silent gaps in auditory stimuli reveals information regarding temporal processing deficits above and beyond that provided by behavioral procedures alone.
Michalewski, Starr, Nguyen, Kong, and Zeng (2005) examined the neural response associated with gap detection in broadband noise stimuli by assessing frontal and central N1 and P2 responses to gaps of various sub- and supra-threshold durations, during both active and passive listening conditions. N1 is an early negative-going peak that indexes selective attention to physical properties of sensory stimuli; P2 is the subsequent positive-going peak that reflects feature detection and stimulus classification. In healthy adults, N1 and P2 responses were elicited consistently for gap sizes 5ms or longer in duration, but were absent in response to a 2ms gap, which participants were unable to detect behaviorally. N1, and particularly P2, amplitudes were smaller when behavioral detection rates were lower (i.e., for shorter duration gaps) relative to their amplitudes for longer gap conditions, where behavioral detection rates were almost 100%. This finding lends additional support to the notion that behavioral detectability is reflected in the magnitude of early ERP components in response to near-threshold stimuli. However, EEG procedures to explore brain response during auditory gap detection have not yet been applied in ASD.
The present study examined the dynamics of N1 and P2 ERP components indexing neural response to near-threshold silent gaps in auditory stimuli among children with ASD and TD. In particular, this study sought to determine whether the underlying neural processes differed as a function of whether a near-threshold gap was consciously detected, and as a function of diagnostic group. We predicted that N1 and P2 amplitudes would be attenuated and latencies delayed in ASD relative to TD, and in both groups for Undetected versus Detected gaps. In addition, in order to examine the clinical relevance of neural response during gap detection, this study related ERP indices that best differentiated ASD from TD to clinical symptomatology in the ASD sample. Here, we predicted that ERP markers of gap detection abnormalities in ASD would be associated with behavioral sensory features of ASD as well as language-related vulnerabilities. Ultimately, clarification of the nature of neural alterations in ASD may contribute to a better understanding of the fundamental brain abnormalities associated with particular symptom clusters, which may in turn inform novel avenues for intervention development.
Method
Participants
This study included 15 children with ASD and 17 children with TD, between 10 and 13 years of age. All participants had: (a) normal or corrected-to-normal vision (by parent report) and hearing (confirmed in the study with pure tone audiometric hearing screenings at 20 dB); (b) intact cognitive skills (IQ > 70); (c) absence of genetic or neurological disorders, history of seizures, or past head injury; (d) no current use of psychotropic medication (i.e., to ensure group differences in medication status would not confound interpretation of ERP results). Prior ASD diagnosis in children with ASD was confirmed with the Autism Diagnostic Observation Schedule (Lord et al., 2000) and Autism Diagnostic Interview-Revised (Lord, Rutter, & Le Couteur, 1994); all participants in the ASD group met diagnostic criteria on both measures. Children with TD had no family history of ASD in first- or second-degree relatives and no current or past diagnosis of learning or psychological disorder. All scored below the at-risk cutoff on the Social Communication Questionnaire (SCQ; Rutter, Bailey, & Lord, 2003). An additional five children with ASD and seven with TD completed the ERP tasks, but their data were excluded because of poor performance on the behavioral component of the ERP task (ASD: n=2; TD: n=1), or excessive motion artifacts in the EEG signal (ASD: n=3; TD: n=6). Parents of participants gave informed consent, and children gave assent. Procedures were approved by the Institutional Review Board.
Final groups did not differ on age, gender, handedness, or IQ score, as measured by the Wechsler Abbreviated Scales of Intelligence (Weschsler, 1999) (Table 1). However, psychophysically-determined gap detection thresholds (methods reported in Foss-Feig et al., in press) were higher in the ASD than TD group, as has previously been reported (Bhatara et al., 2013; Foss-Feig et al., in press). This confirms that, when procedures were used to determine the minimum gap size individual participants could reliably detect, as a group children with ASD in our sample had worse gap detection abilities than those with TD.
Table 1.
Participant Demographics
| Variable | Group Means | Statistics | ||
|---|---|---|---|---|
| ASD | TD | Statistic | p-value | |
| Age (years) | 11.86 ± 1.4 | 12.23 ± 1.2 | t = 1.20 | 0.24 |
| Full Scale IQ | 118.27 ± 13.8 | 112.56 ± 12.6 | t = −0.82 | 0.42 |
| Handednessa | 12 R; 3 L | 14 R; 1 L | χ2 = 1.15 | 0.30 |
| Gender | 14 M; 1 F | 17 M; 0 F | χ2 = 0.28 | 0.47 |
| Gap Detection Threshold | 4.25 ± 1.5 | 3.11 ± 0.7 | t = 2.82 | 0.008* |
Handedness information not available for 2 children with TD;
p < 0.05
Clinical Assessments
All participants were administered a broad range of standardized assessments evaluating their sensory, language, and social functioning.
Sensory functioning was assessed with the Sensory Profile (SP; Dunn, 1999), a 125-item caregiver-report questionnaire that yields section and factor scores (e.g., auditory, visual; sensory sensitivity, sensory seeking) related to sensory symptoms and atypical sensory experiences. Raw scores are totaled for each factor and section, with lower scores on scales indicating greater sensory abnormalities. For this study, the Auditory section score and the Registration factor score were targeted, as they were most conceptually related to auditory gap detection. The Auditory section includes questions such as “Is distracted or has trouble functioning if there is a lot of noise around,” and “Appears not to hear what you say.” The Registration factor encompasses questions including “Does not seem to smell strong odors” and “Decreased awareness of pain and temperatre.”
Language functioning was evaluated with two direct assessments administered to children. Specifically, all participants completed receptive language subtests from the Clinical Evaluation of Language Fundamentals, Fourth Edition (CELF-4; Semel, Wiig, & Secord, 2003) and phonological processing tasks from the Comprehensive Test of Phonological Processing (CTOPP; Wagner, Torgesen, & Rashotte, 1999). The CTOPP assesses phonological awareness, phonological memory, and rapid naming. Here, we focus on the Phonological Awareness and Phonological Memory composites, which are each derived from two separate subtests and yield standard scores (Mean = 100, SD = 15). From the CELF-4, we were most interested in the Receptive Language Index (RLI), which is derived from the Word Classes - Receptive and Concepts and Following Directions subtest and yields a standard score (Mean = 100, SD = 15). For both CTOPP and CELF-4 composites, higher scores reflect better language skills as compared to age-based norms.
Social functioning related to ASD symptoms was assessed in all children with the Social Responsiveness Scale (SRS; Constantino & Gruber, 2007), a 65-item caregiver-report questionnaire designed to measure ASD-related symptoms as viewed in everyday social environments. Item scores combine to yield a Total Score, with higher scores reflecting more ASD-related symptoms. Raw SRS Total score was used as a continuous measure of ASD symptomatology, rather than using a cutoff score to dichotomize level of impairment. ADOS and ADI-R scores were also used to index social and diagnostic symptoms in the ASD group; for both measures, higher scores indicate more ASD-related symptoms.
Procedure
Participants were seated in a dark room in front of a high refresh rate (100Hz) PC monitor, on which visual cues to guide task progression (e.g., when participants should respond, when breaks occurred) were presented. Auditory stimuli were presented via Etymotic Research ER-3A insert earphones to both ears. Volume of auditory stimuli was constant (80 dB SPL) across participants. Stimulus timing and behavioral response recording were controlled by E-Prime 2.0 (Psychology Software Tools Inc., Pittsburgh, PA, USA). Children were reminded to keep their eyes open and focused on the fixation cross on the computer screen to minimize motion artifact. Participants were monitored via two closed-circuit video cameras and, when necessary, a researcher remained in the room to cue on-task behaviors or remind children to remain still.
Experimental task
Stimuli were white noise (20 Hz-20 kHz) bursts, created in Adobe Audition (Adobe Systems, Mountain View, CA, USA) at a sampling rate of 44100 Hz, containing silent gaps of various durations. Stimuli were presented individually on sequential trials, and participants’ task was to indicate whether or not each stimulus contained a gap using a button press response on a hand-held Serial Response SRT box. Buttons corresponding to “yes gap” and “no gap” were counter-balanced across participants. All participants completed 10 practice trials to confirm task comprehension prior to beginning recordings for the full task.
Each trial comprised presentation of a single 1000ms auditory stimulus. A white fixation cross remained on the computer screen for the duration of the trial. Gap onset occurred 400ms into the overall stimulus duration for all gap-size conditions. At the end of the auditory stimulus, the fixation cross turned red, prompting participants to respond. Each trial contained a 3000ms response window following auditory stimulus offset; this response window was terminated by the participant’s button press response, thereby initiating onset of the next trial. Inter-trial intervals varied randomly between 800ms and 1500ms, during which time the white fixation cross remained on the screen.
Trial types included a no-gap condition, as well as conditions with varied gap durations (i.e., 1ms, 3ms, 6ms, 10ms, 30ms gaps). The gap size of primary interest was 3ms, which was similar to gap detection thresholds in the parallel psychophysical study (Foss-Feig et al., in press). This near-threshold condition was of particular interest for determining whether the neural response to a gap in noise differs as a function of whether participants do or do not perceive the gap (i.e., despite the physical stimulus being identical). Overall, stimuli from the no-gap condition represented 28.6% of all trials, while the other gap sizes each comprised 14.3% of trials. The experiment was conducted in two runs of 280 trials each (approximately 12 minutes per run). Trial types were evenly distributed across the two runs and randomly interleaved throughout the experiment.
Data analysis
ERP acquisition and data pre-processing
EEG data were acquired in NetStation 4.3 (EGI, Inc., Eugene, OR, USA) using 128-channel high-density arrays (Geodesic Sensor Net, EGI, Inc., Eugene, OR, USA). Electrode impedances were kept below 40kOhms and checked before and after testing, as well as at breaks in task. Data were sampled at 1000Hz with filters set to 0.1–100Hz. All electrodes were referred to vertex during data collection, and then re-referenced to an average reference during post-processing. After data collection, a 60 Hz notch filter was applied to individual subject data files. Individual trials for near-threshold (3ms) gap stimuli were then segmented into 700ms epochs including 100ms baseline and a 600ms post-stimulus interval, beginning at the onset of the silent gap (i.e., 400ms after initial stimulus onset). Single trial ERPs were screened for artifacts using automated procedures in NetStation. Trials contaminated by ocular or movement artifacts or with more than 15% “bad” channels (i.e., those having poor signal quality) were rejected. For the remaining trials, any electrodes identified as bad were replaced by reconstructing data using spherical spline interpolation procedures. The number of remaining 3ms gap trials was comparable across groups (Detected: ASD: 21.21 ± 15.4; TD: 19.88 ± 15.0; t(28) = 0.24, p = .81; Undetected: ASD: 24.71 ± 17.6; TD: 32.69 ± 16.4; t(28) = −1.29, p = .21). Artifact-free trials were averaged together across the two sessions per participant, re-referenced to an average reference (i.e., the mean across all 128 electrodes), and baseline corrected by subtracting the average microvolt value across the 100ms baseline period from the post-gap segment.
ERP data analysis
To reduce the number of electrodes in the analysis, data from 128 electrodes were submitted to a spatial principal components analysis (sPCA; Spencer, Dien, & Donchin, 1999). This analysis was conducted in order to determine a small set of “virtual electrodes,” each representing a spatially contiguous cluster of electrodes that yielded similar ERP waveforms. Specific electrodes comprising each cluster were identified as having factor loadings of |.6| or greater, with those electrodes meeting criteria for inclusion in multiple clusters being placed in the cluster where the factor loading score was greater. Data for electrodes within each resulting cluster were averaged for analyses. Frontal and central clusters emerging from sPCA procedures (Figure 1) were selected in order to examine ERP responses to auditory events.
Figure 1.

Frontal and Central electrode clusters, as determined via spatial PCA, overlaid on the EGI Geodesic Censor Net 128-channel map.
Next, mean amplitude and latency measures were computed for frontal and central N1 (70–130ms) and P2 (150–200ms) components using an automated scoring tool in NetStation 4.4. Mean (as opposed to peak) amplitude was chosen for measurement because it is less sensitive to noise, is unaffected if maximum peak amplitude falls outside the selected window for some participants and/or electrodes, and is a linear measure (Luck, 2005). Time windows were selected based on a combination of intervals used in previously published studies of auditory gap detection (Bertoli et al., 2002; Michalewski et al., 2005) and on visual inspection of the grand average waveforms from the present dataset. ERP components were scored for response to 3ms gap onset separately for Detected (participant indicated s/he heard a gap) vs. Undetected (participant indicated s/he did not hear a gap) trials.
Four separate 2×2×2 repeated measures ANOVAs were conducted. For each component (N1, P2), ANOVAs were conducted for both amplitude and latency, with Cluster (Frontal, Central) and Gap Detection Accuracy (Detected, Undetected) as the within-subjects factors and Group (ASD, TD) as the between-subjects factors. Additional analyses using pairwise t-tests corrected for multiple comparisons with Bonferroni corrections were employed to clarify the specific scalp sites, task conditions, and neural markers that best differentiated children with ASD from those with TD. To examine associations between neural indices of auditory gap detection and behavioral metrics of sensory, language, and social functioning, we selected the ERP marker that best differentiated ASD from TD in between-group analyses and conducted bivariate correlations with summary scores from clinical measures using a two-tailed significance value of alpha=0.05.
Results
Behavioral results for near-threshold 3ms gaps
Accuracy and reaction time for correct gap detections were compared between groups. As expected, gap detection performance was near chance for both ASD and TD children (Mean percent correct: ASD: 45.57% ± 26.3; TD: 36.69% ± 26.9), and no significant group difference was detected (t(28) = 0.94, p = .35). Signal detection analyses were also conducted, where Hit rate was defined as the proportion of trials on which participants correctly detected the gap (i.e., 3ms Gap Detected/(3ms Gap Detected + 3ms Gap Undetected)) and False Alarms were defined as the proportion of trials in the No Gap condition for which participants incorrectly responded that a gap was present (i.e., No Gap Error/(No Gap Correct + No Gap Error)). Z-scores were computed for Hit and False Alarm rates and d-prime was calculated. Independent-samples t-tests revealed response bias was similar between the two groups (d′: ASD: −0.21 ± 1.2; TD: 0.19 ± 1.0; t(30) = −1.03, p = .31). Mean reaction time also did not differ between ASD and TD groups from either correctly detected (ASD: 569.48ms ± 209.5; TD: 666.95 ± 231.3; t(30) = −1.24, p = .22) or undetected (ASD: 586.05ms ± 196.0; TD: 568.70 ± 194.6; t(30) = 0.25, p = .80) gap trials.
ERP response to near-threshold 3ms gaps
Analyses were conducted to evaluate group differences in the ERP responses as a function of whether participants could detect the gap behaviorally (Figure 2).
Figure 2.
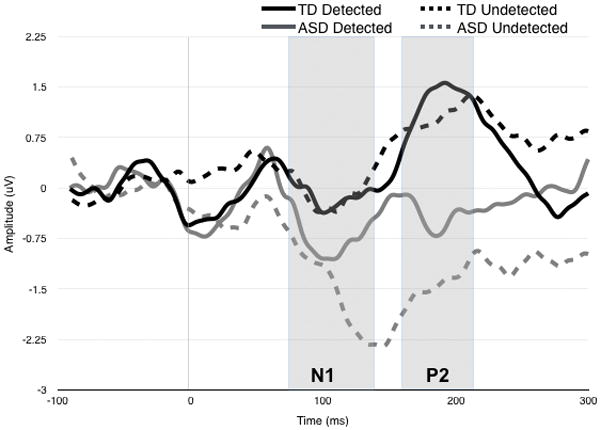
Grand Average waveform for ERP response over central electrodes to 3ms gap stimulus. ERP responses are plotted separately for ASD (red) and TD (black), as a function of whether gaps were behaviorally Detected (darker line) or Undetected (lighter colored line). Gray boxes show time frames within N1 and P2 mean amplitude and latency were extracted.
For N1 amplitude, there was a marginal 3-way interaction between Cluster, Accuracy, and Group, F(1,30) = 3.45, p = .073. This interaction was driven by a significant effect of Group in the Central region for Undetected gaps. Specifically, central N1 was larger for ASD vs. TD participants (t = −2.19, p = .036; Cohen’s d = 0.98) when 3ms gaps went undetected. No other main effects or interactions were observed. Omnibus ANOVAs for N1 latency yielded no significant main effects or interactions.
For P2 amplitude, there was a marginal main effect of group, F(1,30) = 3.83, p = .06, suggesting that across clusters and conditions, P2 amplitude was attenuated in ASD relative to TD. There was also a significant interaction between Cluster and Group was observed, F(1,30) = 5.71, p = .023. Follow-up tests indicated that this interaction was driven by a significant Group effect in the Central region, such that the P2 amplitude was larger in TD versus ASD at this scalp location (F(1,30) = 8.57, p = .006; Cohen’s d = 0.66). No other main effects or interactions were observed.
For P2 latency, a marginal 3-way interaction between Group, Accuracy, and Cluster was found, F(1,30) = 3.77, p = .062. Follow-up tests indicate this interaction was driven by a marginal effect of Accuracy for the TD group: within the Frontal region, Detected gaps resulted in faster P2 latencies than Undetected gaps (p = .10). No other pairwise comparisons were significant after Bonferroni correction.
Brain-Behavior Correlations
To explore the relationship between brain response to near threshold gaps and clinical symptomatology, we conducted correlations between behavioral measures of interest and P2 amplitude, given that this was the only index that significantly differentiated ASD from TD. Central P2 amplitude for Detected trials was used based on results from between group comparisons as well as inspection of the grand average waveforms, where P2 amplitude to Undetected gaps was so attenuated in the ASD group that it almost appeared absent, making this metric non-preferred.
In the combined ASD and TD group, there were significant correlations between Central P2 amplitude to Detected Gaps and measures of sensory, language, and social functioning (Figure 3). Specifically, attenuated P2 amplitude was associated with more Auditory processing abnormalities (r(21) = .45, p = .043) and poorer Registration of sensory input (r(21) = .63, p = .002), as assessed with the Sensory Profile. Trend-level associations between attenuated P2 amplitude and both weaker receptive language skills assessed with the CELF-4 RLI (r(19) = .44, p = .057) and poorer phonological memory assessed with the CTOPP (r(31) = .34, p = .058), though not with phonological awareness assessed by the CTOPP (p = .44).
Figure 3.
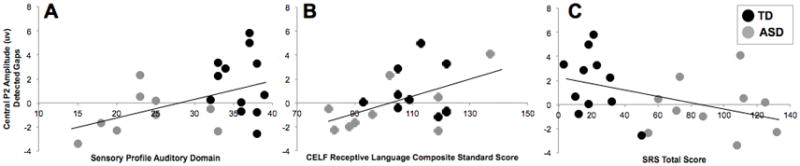
Correlations between Central P2 Amplitude to Detected gaps and clinical measures of sensory (Panel A), Language (Panel B), and Social (Panel C) functioning across both ASD (red dots) and TD (black dots) children.
Across groups, there was a trend for an association between attenuated P2 amplitude over central scalp to Detected gaps and greater ASD-related features, as rated by parents on the SRS (r(21) = −.42, p = .059). In the ASD group, attenuation of P2 amplitude was associated with a higher overall score on the ADOS (r(15) = −.57, p = .026). This association was driven by a strong correlation between P2 amplitude and language/communication-related ASD symptoms assessed by the ADOS (r(15) = −.54, p = .04) (Figure 4), whereas the relation with ASD-related deficits in reciprocal social interaction was weaker (r(15) = −.25, p = .37). Attenuated P2 amplitude was significantly correlated with parent reported ASD symptoms on the ADI-R diagnostic algorithm across social (r(14) =−.56, p = .036), language/communication (r(14) = −.53, p = .05), and restricted and repetitive behavior (r(14) =−.62, p = .019) domains.
Figure 4.
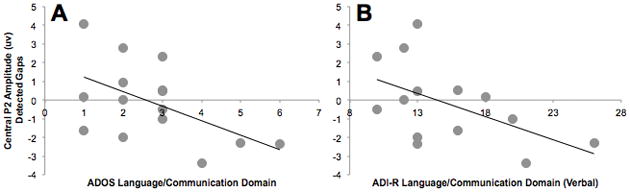
Correlations between Central P2 Amplitude to Detected gaps and scores on language/communication domain scores from direct observation (ADOS; left panel) and caregiver interview (ADI-R; right panel) diagnostic measures for ASD. ADOS and ADI-R scores were available for participants with ASD (red dots) only.
Discussion
This study evaluated the neural response to near-threshold gaps in auditory stimuli in children with ASD and TD. In particular, it focused on differences in the ERP response to near-threshold gaps as a function of whether they were detected behaviorally, as well as whether neural indices of auditory gap detection related to clinical features associated with ASD. Behavioral results did not reveal differences between groups in accuracy or response time to near-threshold silent gaps in white noise stimuli; as expected, children in both groups performed near chance on the behavioral detection task. However, as hypothesized, neural response differed between children with ASD and TD. In particular, P2 amplitude attenuation in ASD was statistically significant and most pronounced over central scalp, regardless of whether gaps were behaviorally detected. Though grand average waveforms pointed to N1 latency delay and marked absence of P2 when the near-threshold gap was behaviorally undetected in ASD children, these effects were not statistically significant and, overall, ERP responses did not significantly differ as a function of whether gaps were detected in either group. Thus, atypical neural response during auditory gap detection in ASD is most reliably indexed by P2 amplitude attenuation. Moreover, degree of P2 amplitude attenuation was highly associated with clinical features, including more prominent sensory symptoms (e.g., auditory processing abnormalities and failure to register sensory input) and weaker language skills across ASD and TD groups and more significant ASD-related symptoms in the ASD group. This final finding suggests that P2 amplitude during gap detection could represent an important biomarker associated with ASD.
Our finding of P2 amplitude alterations associating with temporal processing weaknesses is consistent with previous literature. In particular, Michalewski and colleagues (2005) reported absent N1 and P2 responses to sub-threshold (i.e., 2ms) gaps among healthy adults, with both components emerging in response to a 5ms gap. Both components also had smaller amplitude to 5ms gap size relative to amplitudes seen for longer gap durations. This observation was particularly true for the P2 response, which is consistent with our finding that the P2 response appears especially sensitive to detectability of near-threshold gaps and to alterations in the ASD population, where behavioral studies have demonstrated impairments in gap detection abilities (Bhatara et al., 2013; Foss-Feig et al., in press).
The P2 component is thought to be associated with attention modulation and stimulus classification (Key, Dove, & Maguire, 2005). Whereas the earlier N1 response reflects more basic sensory registration of a stimulus, the P2 response may reflect perceptual processing closer to conscious registration and attention. Thus, our finding of diminished P2 response to near-threshold gaps in ASD suggests that when the physical presence of the gap becomes more difficult to detect at a primary/sensory level, subsequent perceptual processes may fail to engage for children with ASD. The behavioral manifestation of this atypical neural response might be that individuals with ASD are ultimately hypo-responsive to near-threshold temporal changes in auditory stimuli. In support of this hypothesis, our results showed that, across groups, smaller P2 amplitude to near-threshold gaps is associated with more atypical auditory processing and poorer registration of sensory input broadly.
Our findings of diminished P2 responses to rapid temporal changes in auditory stimuli support the notion of atypical neural response to timing information within auditory stimuli among individuals with ASD. They are also consistent with previous studies on the topic. For example, Lepisto and colleagues reported reduced amplitude of the MMN response to duration deviants in both children with autism (Lepisto et al., 2005) and with Asperger’s Disorder (Lepisto et al., 2006). Interestingly, our P2 findings may offer some insight into the functional significance of MMN reductions seen in the Lepisto et al. studies. Because the task used by Lepisto and colleagues did not require that participants indicate behaviorally whether or not they detected deviance in stimulus duration for each trial, it is impossible to know whether their observed MMN reductions reflected failure to behaviorally (or consciously) detect duration deviants, or whether these reductions would be seen regardless of behavioral detection. The fact that, in our sample, P2 amplitude attenuations remained present in ASD regardless of behavioral gap detection suggests that the altered neural response to temporal aspects of auditory stimuli reflects a central deficit in the processing of physical qualities of the stimulus, rather than being associated with a particular behavioral response or state of cognitive/conscious awareness. As such, our findings suggest that results obtained from passive tasks that do not require behavioral response likely index processes similar to those that are linked to behavioral performance. This issue is a critical one in considering how to adapt paradigms and interpret results from studies such as ours for individuals with ASD who are minimally verbal or who have significant cognitive impairment.
In general, the ability to detect a brief silent gap in noise reflects the ability of the brain to detect and respond to rapid on-off-on sequences within an auditory stream. Thus, the differences we observed in the ERP response to near-threshold gaps in ASD suggest that broader difficulties responding to auditory events occurring in rapid temporal sequence can be indexed with electrophysiology. In their examination of the M50 and M100 responses to paired auditory stimuli separated by a 150 ms gap, Oram Cardy et al. (2005b) have reported findings that support this notion. Whereas no group differences were seen between children with ASD and TD in either the M50 or the M100 response to the first tone within a pair, significantly fewer children with autism showed an M50 response to the second tone. This result approached significance for the M100 response as well. Thus, children with ASD were unable to produce a robust response to a second “on” stimulus, following a brief “off” interval. Interestingly, Oram Cardy and colleagues (2005b) also observed this pattern in children with Specific Language Impairment, which mirrors our finding that reduced P2 amplitude to near-threshold gaps is associated with weaker receptive language and phonological memory skills.
Reduced P2 response to near-threshold gaps in ASD points to differences in brain responses originating in auditory cortex. In particular, the P2 component is associated with sources in auditory association areas and planum temporale (Crowley & Colrain, 2004; Godey, Schwartz, de Graaf, Chauvel, & Liégeois-Chauvel, 2001), which has been shown in fMRI studies to be involved in processing rapid temporal information in the auditory signal (Vigneau et al., 2006). In the left hemisphere, the planum temporale is the location of Wernicke’s area, which is associated with processing and understanding of spoken language (Griffiths & Warren, 2002). Atypical planum temporale asymmetry and reduced left hemisphere planum temporale volume have been reported in both children (Rojas, Camou, Reite, & Rogers, 2005) and adults (Rojas, Bawn, Benkers, Reite, & Rogers, 2002) with ASD. Our results showing links between P2 amplitude attenuation and receptive language and phonological processing abilities across groups as well as ASD-specific language/communication symptoms within ASD children support a link from aberrant planum temporale function and/or structure, to impaired auditory gap detection, to a specific profile of language-related weaknesses in the clinical phenotypes. Given the association between P2 amplitude attenuation and atypical registration and processing of auditory input more broadly, processing, attention, and orienting to sensory input could play an important role in this pathway as well. Future studies using multimodal neuroimaging must confirm this link more directly. However, our results suggest that P2 amplitude during auditory gap detection may offer a robust biomarker for “reading out” brain-based alterations that are associated with specific perceptual processing deficits and may underlie specific clinical manifestations in ASD.
Indeed, perhaps the most promising aspect of our findings is the robust and consistent correlations between P2 amplitude to near-threshold gap stimuli and measures of related clinical symptomatology. Our initial hypotheses were that ERP during gap detection would index auditory processing abnormalities in ASD and would be most associated with language-related features, given that the ability to detect (and more completely process) temporal aspects of auditory stimuli on the order of few milliseconds is necessary for accurate speech perception (Poldrack et al., 2001; Rosen, 1992) and that a strong literature supports impaired gap detection and auditory temporal processing in other clinical populations with language-related deficits (Tallal, 1980; Tallal & Piercy, 1973; Wright et al., 1997). Here, we find that a canonical ERP response during a simple experimental paradigm was associated with parent-reported sensory symptoms, including auditory processing abnormalities and poor registration of sensory input, as well as with directly-measured receptive language and phonological memory abilities and parent-reported social responsiveness across both ASD and TD children. Moreover, in children with ASD, this same ERP index also associated with both parent-reported and directly-measured ASD symptoms, most prominently in the language/communication domain.
Combined, these findings suggest the P2 amplitude during gap detection offers an exciting possible biomarker for ASD. As defined by the National Institute of Health’s Biomarkers Definitions Working Group, a biomarker is a “characteristic that is objectively measured and evaluated as an indicator of normal biological processes, pathogenic processes, or pharmacologic responses to a therapeutic intervention” (Colburn et al., 2001). In the context of ASD, it has been proposed that biomarkers could be useful for diagnostic purposes, but also for stratification of subgroups, applying treatments in a targeted fashion, and measuring the impact of interventions (Walsh, Elsabbagh, Bolton, & Singh, 2011). Moreover, association between biomarkers and particular functional processing or symptoms domains may be a more reasonable proximal goal. In his summary of considerations for biomarker development for neurodevelopmental disorders, McPartland highlighted the need for measures that were relatively easy to use across the full ASD spectrum, inexpensive and scalable, sensitive to subtle changes, and objective in their methodology (McPartland, 2016). Electrophysiological methods offer a promising avenue for identifying biomarkers that could meet these criteria (McPartland, Bernier, & South, 2015). Here, we use a method that is objective, sensitive, scalable, and adaptable across the age and functioning spectrum and reveal a measure that is both sensitive to diagnostic group and associated with specific functional processes and symptom domains within and across diagnostic groups. Future work should replicate our P2 amplitude findings in additional age groups and in minimally verbal populations and should test the sensitivity of this metric for predicting and quantifying treatment response, particularly in the sensory and language domains.
This study has several limitations. First, although the 3ms gap condition was close to the gap detection threshold observed for both groups in a previous study (Foss-Feig et al., in press), gap sizes for this task were pre-selected rather than customized for each individual’s particular gap detection threshold. However, across ASD and TD, the association between P2 amplitude to Detected 3ms gaps and auditory gap detection threshold, as determined individually using psychophysical thresholds described in Foss-Feig et al. (in press) approached statistical significance (r(32) = −.33, p = .061), and the study was successful in identifying group differences in neural processes associated with detecting near-threshold auditory events. Second, following exclusion of participants for behavioral performance and motion artifact, this study may have been underpowered to detect significant group differences. The presence of moderate effect sizes in the context of near-significant p-values suggests that, with a larger sample size, we might detect more significant findings in line with those reported here.
Despite these limitations, results of the current study suggest differences between children with ASD and TD, with regard to their brain response to a near-threshold silent gap. In so doing, these findings provide neurophysiological evidence in support of behaviorally-observed rapid auditory temporal processing deficits in ASD. Moreover, the strong associations between neural response and both parent-report and direct assessment measures of sensory, language, and social functions suggest that P2 amplitude during gap detection may offer an exciting biomarker for ASD that is associated with particular clinical symptoms. Such a biomarker could be used to identify targets for treatment and to measure changes in the context of ASD-focused treatments targeting sensory and/or language and communication function.
In summary, this study used electrophysiology to identify neural alterations associated with impaired ability of children with ASD to resolve rapid temporal information within auditory input. These findings lend additional support to a large body of literature on atypical auditory processing in ASD, while offering the first evidence of a neural correlate associated with difficulty detecting small changes (gaps) within sounds and pointing toward specific alterations in auditory cortex driving these differences. Associations between ERP response during gap detection and variability in key sensory, language, and diagnostic features of ASD suggest that P2 amplitude during auditory gap detection is a promising biomarker for ASD, particularly as related to marking sensory and language-related symptoms. Thus, this work offers new insight into the neurobiology of ASD as well as an exciting avenue toward developing a robust ASD biomarker that could be useful for patient stratification and for informing and evaluating treatment selection and response.
Acknowledgments
This study was supported by a Dennis Weatherstone Predoctoral Fellowship from Autism Speaks to JHF and a Marino Autism Research Institute grant to APK and JHF. Jennifer Foss-Feig’s effort was also funded in part by a Brain and Behavior Research Foundation NARSAD Young Investigator Award to JHF, an Autism Science Foundation Accelerator grant to JHF, and the Seaver Foundation. The authors would like to acknowledge Rebecca Johnston, Kimberly Schauder, Caroline Oates, and Holly Black for their assistance with recruitment and data collection. They also would like to thank the children and families who participated in this study.
Literature cited
- Association, A. P. DSM 5. American Psychiatric Association; 2013. [Google Scholar]
- Bertoli S, Heimberg S, Smurzynski J, Probst R. Mismatch negativity and psychoacoustic measures of gap detection in normally hearing subjects. Psychophysiology. 2001;38(2):334–342. doi: 10.1111/1469-8986.3820334. [DOI] [PubMed] [Google Scholar]
- Bertoli S, Smurzynski J, Probst R. Temporal resolution in young and elderly subjects as measured by mismatch negativity and a psychoacoustic gap detection task. Clin Neurophysiol. 2002;113(3):396–406. doi: 10.1016/s1388-2457(02)00013-5. S1388245702000135 [pii] [DOI] [PubMed] [Google Scholar]
- Bhatara A, Babikian T, Laugeson E, Tachdjian R, Sininger YS. Impaired timing and frequency discrimination in high-functioning autism spectrum disorders. J Autism Dev Disord. 2013;43(10):2312–2328. doi: 10.1007/s10803-013-1778-y. [DOI] [PubMed] [Google Scholar]
- Colburn W, DeGruttola VG, DeMets DL, Downing GJ, Hoth DF, Oates JA, … Woodcock J. Biomarkers and surrogate endpoints: Preferred definitions and conceptual framework. Biomarkers Definitions Working Group. Clinical Pharmacol & Therapeutics. 2001;69:89–95. doi: 10.1067/mcp.2001.113989. [DOI] [PubMed] [Google Scholar]
- Constantino JN, Gruber CP. Social responsiveness scale (SRS) Western Psychological Services; Los Angeles, CA: 2007. [Google Scholar]
- Crowley KE, Colrain IM. A review of the evidence for P2 being an independent component process: age, sleep and modality. Clin Neurophysiol. 2004;115(4):732–744. doi: 10.1016/j.clinph.2003.11.021. S1388245703004279 [pii] [DOI] [PubMed] [Google Scholar]
- Dunn W. The Sensory Profile Manual. San Antonio, TX: Psychological Corporation; 1999. [Google Scholar]
- Foss-Feig JH, Schauder KB, Key AP, Wallace MT, Stone WL. Audition-specific temporal processing deficits associated with language function in children with autism spectrum disorder. Autism Res. doi: 10.1002/aur.1820. in press. [DOI] [PMC free article] [PubMed] [Google Scholar]
- Foss-Feig JH, Stone WL, Wallace MT. International Review of Research in Developmental Disabilities. Vol. 43. Elsevier; 2012. Processing of Non-Speech Auditory Stimuli in Individuals with Autism Spectrum Disorders: The Impact of Stimulus Characteristics; pp. 87–145. [Google Scholar]
- Godey B, Schwartz D, de Graaf JB, Chauvel P, Liégeois-Chauvel C. Neuromagnetic source localization of auditory evoked fields and intracerebral evoked potentials: a comparison of data in the same patients. Clin Neurophysiol. 2001;112(10):1850–1859. doi: 10.1016/s1388-2457(01)00636-8. [DOI] [PubMed] [Google Scholar]
- Griffiths TD, Warren JD. The planum temporale as a computational hub. Trends Neurosci. 2002;25(7):348–353. doi: 10.1016/s0166-2236(02)02191-4. S0166-2236(02)02191-4 [pii] [DOI] [PubMed] [Google Scholar]
- Jeste SS, Nelson CA. Event related potentials in the understanding of autism spectrum disorders: an analytical review. Journal of autism and developmental disorders. 2009;39(3):495. doi: 10.1007/s10803-008-0652-9. [DOI] [PMC free article] [PubMed] [Google Scholar]
- Kellerman G, Fan J, Gorman J. Auditory abnormalities in autism: toward functional distinctions among findings. CNS Spectr. 2005;10(9):748–756. doi: 10.1017/s1092852900019738. [DOI] [PubMed] [Google Scholar]
- Key AP, Dove GO, Maguire MJ. Linking brainwaves to the brain: an ERP primer. Dev Neuropsychol. 2005;27(2):183–215. doi: 10.1207/s15326942dn2702_1. [DOI] [PubMed] [Google Scholar]
- Kujala T, Lepistö T, Näätänen R. The neural basis of aberrant speech and audition in autism spectrum disorders. Neuroscience & Biobehavioral Reviews. 2013;37(4):697–704. doi: 10.1016/j.neubiorev.2013.01.006. [DOI] [PubMed] [Google Scholar]
- Kwakye LD, Foss-Feig JH, Cascio CJ, Stone WL, Wallace MT. Altered auditory and multisensory temporal processing in autism spectrum disorders. Front Integr Neurosci. 2011;4:129. doi: 10.3389/fnint.2010.00129. [DOI] [PMC free article] [PubMed] [Google Scholar]
- Lepisto T, Kujala T, Vanhala R, Alku P, Huotilainen M, Naatanen R. The discrimination of and orienting to speech and non-speech sounds in children with autism. Brain Res. 2005;1066(1–2):147–157. doi: 10.1016/j.brainres.2005.10.052. S0006-8993(05)01500-3 [pii] [DOI] [PubMed] [Google Scholar]
- Lepisto T, Silokallio S, Nieminen-von Wendt T, Alku P, Naatanen R, Kujala T. Auditory perception and attention as reflected by the brain event-related potentials in children with Asperger syndrome. Clin Neurophysiol. 2006;117(10):2161–2171. doi: 10.1016/j.clinph.2006.06.709. S1388-2457(06)00973-4 [pii] [DOI] [PubMed] [Google Scholar]
- Lord C, Risi S, Lambrecht L, Cook EH, Jr, Leventhal BL, DiLavore PC, … Rutter M. The autism diagnostic observation schedule-generic: a standard measure of social and communication deficits associated with the spectrum of autism. J Autism Dev Disord. 2000;30(3):205–223. [PubMed] [Google Scholar]
- Lord C, Rutter M, Le Couteur A. Autism Diagnostic Interview-Revised: a revised version of a diagnostic interview for caregivers of individuals with possible pervasive developmental disorders. J Autism Dev Disord. 1994;24(5):659–685. doi: 10.1007/BF02172145. [DOI] [PubMed] [Google Scholar]
- Luck S. An Introduction to the Event-Related Potential Technique. 2005. [Google Scholar]
- McPartland J, Bernier R, South M. Realizing the Translational Promise of Psychophysiological Research in ASD. J Autism Dev Disord. 2015;45(2):277. doi: 10.1007/s10803-014-2325-1. [DOI] [PMC free article] [PubMed] [Google Scholar]
- McPartland JC. Considerations in biomarker development for neurodevelopmental disorders. Current opinion in neurology. 2016;29(2):118–122. doi: 10.1097/WCO.0000000000000300. [DOI] [PMC free article] [PubMed] [Google Scholar]
- Michalewski H, Starr A, Nguyen T, Kong Y, Zeng F. Auditory temporal processes in normal-hearing individuals and in patients with auditory neuropathy. Clin Neurophysiol. 2005;116(3):669–680. doi: 10.1016/j.clinph.2004.09.027. S1388-2457(04)00388-8 [pii] [DOI] [PubMed] [Google Scholar]
- Oram Cardy J, Flagg EJ, Roberts W, Brian J, Roberts TP. Magnetoencephalography identifies rapid temporal processing deficit in autism and language impairment. Neuroreport. 2005;16(4):329–332. doi: 10.1097/00001756-200503150-00005. doi:00001756-200503150-00005. [DOI] [PubMed] [Google Scholar]
- Oram Cardy J, Flagg EJ, Roberts W, Roberts TPL. Auditory evoked fields predict language ability and impairment in children. Int J Psychophysiol. 2008;68(2):170–175. doi: 10.1016/j.ijpsycho.2007.10.015. [DOI] [PubMed] [Google Scholar]
- Orekhova EV, Stroganova TA, Prokofiev AO, Nygren G, Gillberg C, Elam M. The right hemisphere fails to respond to temporal novelty in autism: evidence from an ERP study. Clin Neurophysiol. 2009;120(3):520–529. doi: 10.1016/j.clinph.2008.12.034. [DOI] [PubMed] [Google Scholar]
- Poldrack RA, Temple E, Protopapas A, Nagarajan S, Tallal P, Merzenich M, Gabrieli JD. Relations between the neural bases of dynamic auditory processing and phonological processing: evidence from fMRI. J Cogn Neurosci. 2001;13(5):687–697. doi: 10.1162/089892901750363235. [DOI] [PubMed] [Google Scholar]
- Rapin I, Dunn M. Update on the language disorders of individuals on the autistic spectrum. Brain Dev. 2003;25(3):166–172. doi: 10.1016/S0387-7604(02)00191-2. [DOI] [PubMed] [Google Scholar]
- Roberts TPL, Cannon KM, Tavabi K, Blaskey L, Khan SY, Monroe JF, … Edgar JC. Auditory Magnetic Mismatch Field Latency: A Biomarker for Language Impairment in Autism. Biol Psychiat. 2011;70(3):263–269. doi: 10.1016/j.biopsych.2011.01.015. [DOI] [PMC free article] [PubMed] [Google Scholar]
- Rojas DC, Bawn SD, Benkers TL, Reite ML, Rogers SJ. Smaller left hemisphere planum temporale in adults with autistic disorder. Neurosci Lett. 2002;328(3):237–240. doi: 10.1016/s0304-3940(02)00521-9. S0304394002005219 [pii] [DOI] [PubMed] [Google Scholar]
- Rojas DC, Camou SL, Reite ML, Rogers SJ. Planum temporale volume in children and adolescents with autism. J Autism Dev Disord. 2005;35(4):479–486. doi: 10.1007/s10803-005-5038-7. [DOI] [PubMed] [Google Scholar]
- Rosen S. Temporal information in speech: acoustic, auditory and linguistic aspects. Philos Trans R Soc Lond B Biol Sci. 1992;336(1278):367–373. doi: 10.1098/rstb.1992.0070. [DOI] [PubMed] [Google Scholar]
- Rutter M, Bailey A, Lord C. SCQ: Social Communication Quetionnaire. 2003. [Google Scholar]
- Semel E, Wiig EH, Secord WA. Clinical evaluation of lanauge fundementals, fourth edition (CELF-4) Toronto, Canada: The Psychological Corporation; 2003. [Google Scholar]
- Spencer K, Dien J, Donchin E. A componential analysis of the ERP elicited by novel events using a dense electrode array. Psychophysiology. 1999;36(3):409–414. doi: 10.1017/s0048577299981180. [DOI] [PubMed] [Google Scholar]
- Tager-Flusberg H, Caronna E. Language disorders: autism and other pervasive developmental disorders. Pediatr Clin North Am. 2007;54(3):469–481. vi. doi: 10.1016/j.pcl.2007.02.011. S0031-3955(07)00040-5 [pii] [DOI] [PubMed] [Google Scholar]
- Tallal P. Auditory temporal perception, phonics, and reading disabilities in children. Brain Lang. 1980;9(2):182–198. doi: 10.1016/0093-934x(80)90139-x. [DOI] [PubMed] [Google Scholar]
- Tallal P, Piercy M. Developmental aphasia: impaired rate of non-verbal processing as a function of sensory modality. Neuropsychologia. 1973;11(4):389–398. doi: 10.1016/0028-3932(73)90025-0. [DOI] [PubMed] [Google Scholar]
- Vigneau M, Beaucousin V, Herve PY, Duffau H, Crivello F, Houde O, … Tzourio-Mazoyer N. Meta-analyzing left hemisphere language areas: phonology, semantics, and sentence processing. Neuroimage. 2006;30(4):1414–1432. doi: 10.1016/j.neuroimage.2005.11.002. S1053-8119(05)02451-1 [pii] [DOI] [PubMed] [Google Scholar]
- Wagner R, Torgesen J, Rashotte C. Comprehensive test of phonological processing. 1999. [Google Scholar]
- Walsh P, Elsabbagh M, Bolton P, Singh I. In search of biomarkers for autism: scientific, social and ethical challenges. Nature Reviews Neuroscience. 2011;12(10):603–612. doi: 10.1038/nrn3113. [DOI] [PubMed] [Google Scholar]
- Weschsler D. WASI: Wechsler Abbreviated Scale of Intelligence. San Antonio, TX: Harcourt Assessment, Inc; 1999. [Google Scholar]
- Wright BA, Lombardino LJ, King WM, Puranik CS, Leonard CM, Merzenich MM. Deficits in auditory temporal and spectral resolution in language-impaired children. Nature. 1997;387(6629):176–178. doi: 10.1038/387176a0. [DOI] [PubMed] [Google Scholar]