Abstract
Retinal imaging with an adaptive optics system usually requires that the eye be centered and stable relative to the exit pupil of the system. Aberrations are then typically corrected inside a fixed circular pupil. This approach can be restrictive when imaging some subjects since the pupil may not be round and maintaining a stable head position can be difficult. In this paper we present an automatic algorithm that relaxes these constraints. An image quality metric is computed for each spot of the Shack Hartmann image to detect the pupil and its boundary and the control algorithm is applied only to regions within the subject’s pupil. Images on a model eye as well as for five subjects were obtained to show that a system exit pupil larger than the subject’s eye pupil could be used for AO retinal imaging without a reduction in image quality. This algorithm automates the task of selecting pupil size. It also may relax constrains on centering the subject’s pupil and on the shape of the pupil.
1. INTRODUCTION
Adaptive optics (AO) correction of the aberrations of the eye to obtain high resolution images of the retina was first demonstrated in a flood illuminated system [1] and was soon combined with Scanning Laser Ophthalmoscopy [2], Time Domain Optical Coherence Tomography (OCT) [3] and Spectral Domain OCT [4]. The main components of an AO system typically include a wavefront sensor, a wavefront corrector, and a control algorithm. In most retinal imaging systems, the wavefront sensor is a Shack Hartmann type wavefront sensor (SH) and the wavefront corrector is a deformable mirror (DM). The purpose of the control algorithm is to use the information measured by the wavefront sensor to calculate the signal that is sent to the corrector. While in astronomical applications, the control algorithm uses knowledge of the statistics of the time-varying source of aberrations, atmospheric turbulence, this is not the case in retinal imaging AO systems where the control algorithm is usually an integral controller.
There are several problems that arise in maintaining wavefront control during adaptive optics retinal imaging. Improved control structures, such as using a Smith predictor [5], a tuned adaptive controller [6] or a waffle or Kolmogorov’s model penalty [7] have been proposed in the literature, but it is not clear which is the best strategy to apply, especially in clinical applications where AO imaging in some patients can be challenging due to high aberrations, irregular pupils and eye movements.
Typically an active control loop is used to correct dynamics in the aberration themselves. However eye movements can also generate temporal variations in the wavefront control since movements of the eye in relation to the AO-correction can cause changes in the required AO-correction due to shifts in the aberration pattern and changes in aberrations with visual angle. Eye movements have been addressed by systems that either correct the pupil position on the fly [8]. While an eye tracker can be coupled to the imaging system, some studies have demonstrated that the Shack Hartmann images can be used to track the pupil position either measuring the overall centroid of the whole aberrometric image [9] or fitting an ellipse to the illuminated lenslets [10].
In all of these approaches the measurement of the wavefront at the pupil boundary is not precise because the SH lenslets of the corresponding positions are not fully illuminated. Errors at these boundary locations affect the wavefront reconstruction dramatically, even in the measurement of the low order aberration [11], thus degrading the image quality quickly. Typically this problem is solved by shrinking the size of the pupil controlled to an area smaller than the subject’s pupil size [1]. Some commercial systems [12] are designed to correct the aberrations in an area smaller than the average pupil size. This smaller size increases the robustness of the system, but resolution would be increased by increasing the system pupil to match each individual’s eye pupil. With a system that allowed changing the system control pupil it was shown that the best image was obtained when the size of the system control was slightly smaller than the pupil of the eye [13]. An algorithm was used to enlarge the controlled area extrapolating the phase measurements [13] but still it was necessary to select the right pupil size and to maintain the subject’s pupil position at the correct location.
Most control algorithms are designed to correct the images in an eye with a circular pupil, often of a fixed size during the measurement. However, even with pharmacological dilation, some subjects’ pupil can change size or are irregular in their shape due to factors such as cataracts or intraocular lenses. The usual approach when dealing with an irregular size pupil or imaging very eccentric locations in the retina, where pupil shape is elliptical, is to choose the maximum circle size that fits inside the subject’s pupil. Although larger pupils result in better lateral resolution, a smaller pupil that avoids the boundary effects can produce better quality images. However, an algorithm that could dynamically adapt to irregular pupil shapes should improve the image quality in these situations.
Instead of fixing programmatically the area where the aberrations will be measured and corrected, we propose an approach which monitors the wavefront sensor which subtends an area larger than the subject’s pupil and uses the Shack Hartmann images to dynamically detect the pupil shape and position. In this paper we test this approach by defining a metric to quantify the quality of the image formed by each lenslet of a Shack Hartmann sensor and use this metric to detect the shape and location of the pupil, defined as areas which provide reasonable quality spots. Then, using simple neighborhood rules the algorithm detects the pupil boundary, and bases wavefront control on areas within the pupil. The hypothesis is that we can use strategies for adapting to the “missing” slope estimates within the control loop to perform as well as the situation when we use an optimum match between the system pupil and the individual’s own pupil. Results with these strategies are compared for both a model eye and young normal subjects.
2. METHODS
A. Imaging System
We collected images with an Adaptive Optics Scanning Laser Ophthalmoscope that has been previously described [14]. Briefly, a laser beam is focused and scanned across the retina in a raster pattern and the light reflected and scattered from the retina is acquired sequentially with an avalanche photodiode to construct a retinal image. The aberrations are calculated using a custom Shack Hartmann wavefront sensor with microlenses of 0.3 mm diameter (0.375 mm at the eye’s pupil). Each lenslet had a 7.6 mm focal length and imaged the retina onto a CCD camera (Uniq Vision Inc. UP-1830CL). In this system, two deformable mirrors in a woofer-tweeter configuration (Imagine Eyes MIRAO DM, 52 actuators and Boston Micromachines MEMS DM, 140 actuators) are used to correct the aberrations of the eye. The eye pupil, the scanners, the two DMs, and the lenslet array of the wavefront sensor are optically conjugated.
The spots formed by the lenslets on the SH camera were searched for within the 45×45 pixels area subtended by each lenslet on the CCD. The spot location was calculated using a shrinking box approach [15] with a two-step algorithm: first the pixel with the highest intensity was located, and then the centroid of the surrounding area (square of 20×20 pixels) was calculated.
The images of the model eye were obtained with the typical system configuration whose exit pupil is 8 mm. For the human testing the pupil of the system was magnified to allow us to test the ability of the algorithm to automatically select the largest available pupil within the SH imaging pupil we moved the final spherical mirror of the system to expand the system exit pupil to 9.3 mm. This resulted in a slightly smaller retinal scanned area and also changed the system aberrations somewhat, but allowed us to better test the ability of the algorithms when the subject’s pupil moved within a larger system pupil.
B. Lenslet Quality Metric
We defined a metric to estimate the quality of the spot formed by each lenslet on the CCD of the Shack Hartmann to identify those whose conjugated position was inside the subject’s pupil. The metric was defined as the ratio between the light in the area close to the centroid (20×20 pixels square) and the total intensity over the entire CCD area subtended by each lenslet (45×45 pixels square). The spots formed with light reflected from the retina through relatively clear ocular media are focused onto the camera surface, and as a result the corresponding lenslet will result in a high metric value. In the areas conjugated to positions outside the subject’s pupil, or where light is backscattered from the cornea or from lenticular opacities the SH lenslet will poorly focus the light, resulting in spread of light at the plane of the CCD, and these lenslets will score a low metric value.
A threshold was established to discriminate the areas where lenslets formed concentrated spots. The lenslets whose metric was lower than this threshold were marked as “rejected” and classified for exclusion.
C. Boundary of the pupil
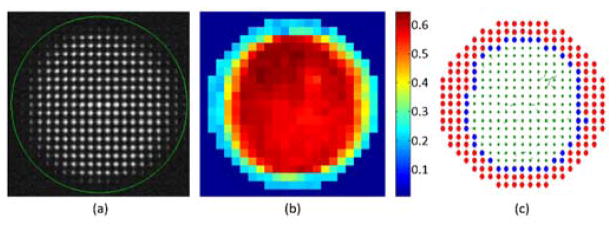
Once all of the lenslets were classified for inclusion or exclusion using the spot quality metric, the boundary of the pupil was calculated using neighborhood rules. In the rectangular array of the SH used, each lenslet has eight neighbors. A lenslet was marked as boundary if it had at least two neighboring lenslets marked as rejected, i.e. if at least two neighbor lenses’ metric was below the threshold. An example for one of the subjects can be seen in Figure 1.
Fig. 1.
(a) CCD image of the Shack Hartmann wavefront sensor. The green circle indicates the area monitored by the Adaptive Optics control algorithm. (b) Metric value of all the spots of the image. (c) Lenslets with metric above 0.5 were accepted (in green), and those with metric below 0.5 (in red) or in the pupil boundary (in blue) were marked for rejection. In the last image the local slope errors for accepted lenslets are drawn as vectors.
D. Adaptive Optics Control Algorithm
We used the direct slope algorithm that attempts to correct the wavefront by zeroing the local slope vector measured by the Shack Hartmann [16]. A linear relationship is assumed between the movement of the m mirror actuator and the n SH spot displacement in both horizontal and vertical directions with the equation
where Aii,x and Aij,y are the influence of the actuator j on the components x and y of the spot i. To calculate actuator commands with each measurement of slopes obtained with the Shack Hartmann, the inverse relationship is needed and a pseudoinverse is typically computed using a singular value decomposition. However, the direct use of the pseudoinverse, m = A+s is not stable and typically some modes are removed [7, 17] or muffled using a damped least-squares approach [18, 19]:
The resulting matrix that is used to calculate the actuator commands with the slopes measured in the Shack Hartmann, m = C s, is known as the control matrix [20].
E. Processing of rejected lenslets
In this study we compared two approaches to deal with rejected lenslets within the AO control loop. The first approach, referred to as “zeroing rejected”, is to set the slope of the rejected lenslets such that there is no need to change the deformable mirror, i.e., set si,x=0 and si,y=0 for lenslet i if it is rejected. This approach then calculates the actuator command using the same control matrix during the whole imaging session. Zeroing the slopes removes what may be noisy measurements, improving system stability. However this operation may impose constraints on nearby areas of the deformable mirror since the finite size of the influence function of each mirror actuator will cause them to balance the apparently perfect wavefront outside the pupil with errors inside the pupil. After zeroing the slopes of the rejected lenslets, we smoothed the transition between the area with valid measurements and the area where the slopes had been set to zero by applying a 2×2 median filter to the rejected lenslets slopes, providing a transition to the area of zeros, but leaving accepted lenslet errors unchanged.
We refer to the second approach as “removing rejected”. This approach removes the rejected lenslets from the vector of slopes and from the corresponding rows of the influence matrix, i.e., eliminate si,x, si,y and Aij,x and Aij,y for j = 1, 2, …, m if the lenslet i is rejected. With this approach a new control matrix has to be calculated after each Shack Hartmann image acquisition. By recalculating the control matrix without the rows corresponding to rejected lenslets we eliminate the influence of these positions and effectively allow the control to act only on non-rejected lenslets. Even with the rows deleted, the system of equations will not be underdetermined for reasonable pupil sizes since in the AO systems used for ophthalmological applications the number of SH spots is usually larger than the number of actuators [21]. The algorithm to perform this calculations in each iteration (remove the rows of influence matrix and calculate the control matrix with the damped least-squares method) was programmed in C++ with Eigen [22].
F. Data collection in model eye and healthy subjects
To test the performance of these algorithms in the absence of eye movements we imaged a model eye composed of an 80-mm focal length lens and a printed paper target. The physical pupil diameter of the model eye was set to 6 mm, which corresponded to 16×16 lenslets in the Shack Hartmann plane. The control pupil, i.e. the region of the SH sensor available for the computation of slopes, was varied between 4.2 and 7.9 mm (11×11 to 21×21 lenslets on the SH plane respectively) and sequences of 100 video frames covering a 2×2 degree region of paper target were collected.
The Adaptive Optics corrected image quality was calculated as the average intensity of the images obtained about 15 seconds after starting the AO loop when the mirror position had converged on its final value. The convergence speed was estimated as the change in the intensity of the video frames with time after Adaptive Optics control was initiated. A sigmoid function of time was fit to the measured intensities and the time to a value corresponding to 90% of the final intensity was used as a measure of convergence speed.
In 5 young healthy subjects whose pupil was dilated with one drop of 1% tropicamide, images of the cone photoreceptor layer of the retina were obtained at 2, 5 and 9 degrees eccentricity. Three short videos (100 frames, 3 seconds) were obtained at each retinal location. Images of the system controlling a pupil larger than those of the subjects were collected with the two approaches described previously for the model eye. The results were compared to a more standard approach, commonly used in AO retinal imaging systems, which restricts the control pupil size to be slightly smaller than the subject’s pupil [23].
The captured videos were processed using software written in Matlab (The Mathworks, Natick, MA). Essentially the eye movements were removed from the images aligning the frames with a reference frame, and a video with a stable image of the retina was created. The same area of the image of the retina, of around 1×1 degrees without blood vessels, was located in all the videos and the image quality in terms of both average intensity and integrated power contained under the Fourier Transform (FT) of the image up to the diffraction limit, omitting the DC power, was calculated in the selected area for each frame in the video and averaged.
3. Results
A fixed lenslet metric threshold of 0.5 was sufficient to detect the pupil in both the model eye and all human subjects. The quality metric of the lenslets conjugated with points inside the pupil was approximately 0.6–0.7 and the quality metric of the lenslets outside the pupil of the subject was about 0.2–0.3.
A. Image quality in the model eye
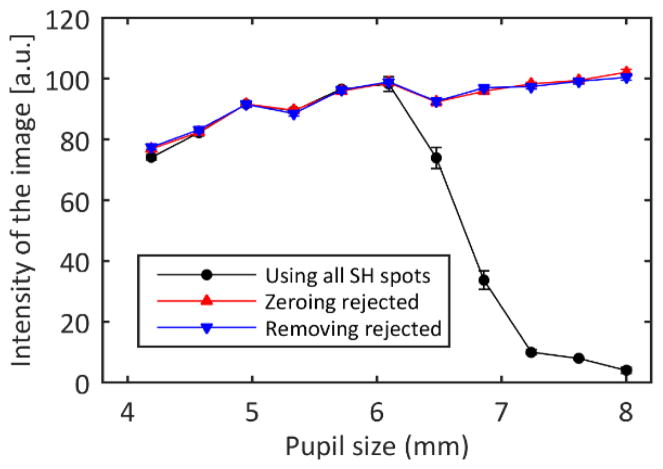
The average intensity of the final images varied with the size of the control pupil and the algorithm (Figure 2). As expected, when controlling pupils smaller than the pupil of the model eye the image quality increased with increasing control pupil size. However, when the control pupil was larger than the model eye pupil the image quality dropped dramatically when all the Shack Hartmann spots were used. Applying the modified control algorithm where lenslets that did not meet the metric criterion were rejected eliminated this drop in image quality. There was no difference in terms of image quality between zeroing the slopes of the rejected lenslets and removing their information from the influence matrix.
Fig. 2.
Final intensity of the model eye images as a function of the control pupil size for each of the control algorithms. If all the SH spots are used to control the AO loop, the best practice is to choose a pupil slightly smaller than the eye pupil since the misinformation from areas outside the eye pupil decreases the image quality. When the rejected spots are excluded, the image quality is maintained, even when controlling pupil sizes larger than the eye’s pupil, which was 6 mm. The error bars represent the standard deviation of three repeated measurements.
B. Convergence in the model eye
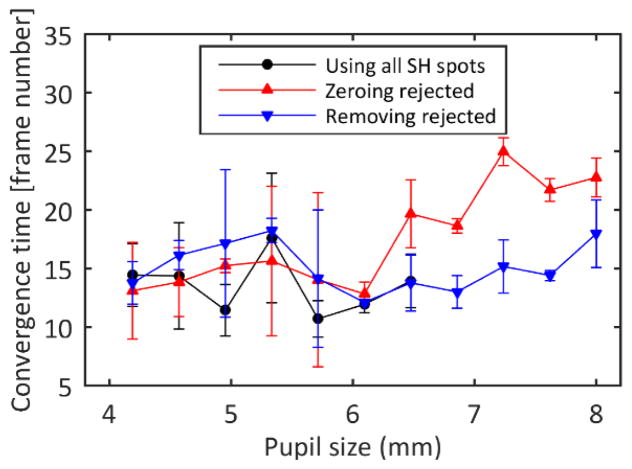
Convergence time was approximately constant for the small control pupils, but was quite variable perhaps due to the smaller number of lenslets contributing to the control. However, convergence time varied depending on the control algorithm for control regions larger than the eye’s pupil (Figure 3). For larger control areas, removing the spots from the influence matrix maintained the convergence time, but zeroing the slopes of the rejected lenslets was slower.
Fig. 3.
Convergence time estimated as the time elapsed between the initiation of the Adaptive Optics algorithm and the moment when the intensity on the images is 90% of the final intensity. The error bars represent the standard deviation of three repeated measurements.
C. Automatic pupil selection and image quality in subjects
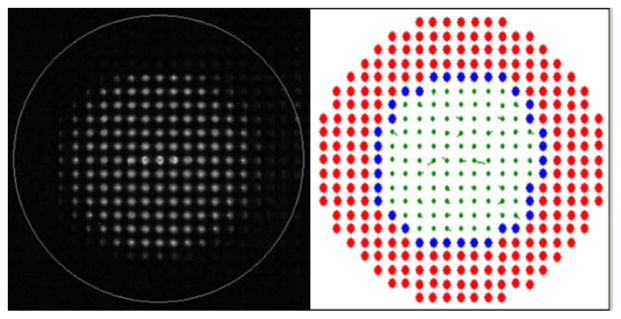
The metric threshold algorithm selected an area of the SH image that visually corresponded to the area of the pupil in the SH images (Figure 4). To visualize the results of the algorithm, the lenslets with lenslet quality metrics below the threshold value were marked as rejected with red color and within the unmarked lenslets, the edge was identified and marked as blue spots. While the images were recorded, changes in the pupil size of the subject as well as blinks were detected in real time (see Visualization 1).
Fig. 4.
Raw SH image (left) with a circle indicating the area of the system pupil subtended by the AO system and processed image (right) where the rejected lenslets are marked in red and the lenslets identified as pupil boundary are marked in blue. For the accepted lenslets (green), the residual slopes are plotted as vectors. Changes in pupil position, pupil size and blinks were detected in real time (see Visualization 1).
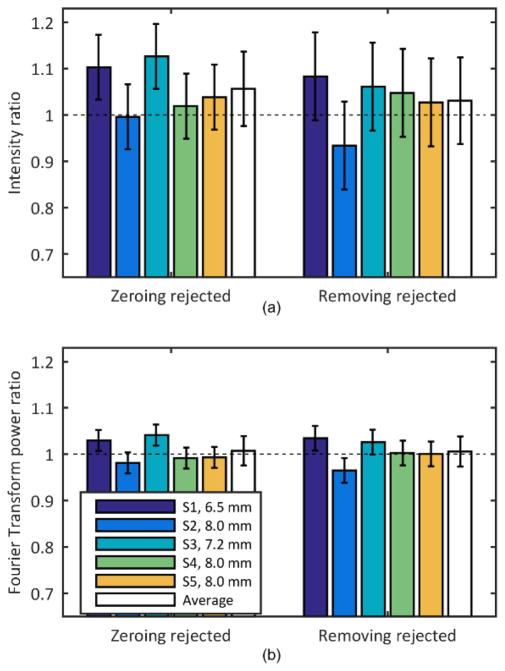
The diameter of the pupil of the subjects following dilation ranged from 6.5 to 8 mm which corresponded to 16×16 and 18×18 lenslets respectively. The average image quality of the frames of the video captured using the proposed algorithms (setting the slope of the rejected lenslets to zero and removing the corresponding rows from the influence matrix) was compared with the average image quality of the video recorded using a fixed pupil of size slightly smaller than the subject’s pupil. Figure 5 shows the average of the ratio of intensities and frequency content for the three locations on each subject, as well as the average across subjects for the two approaches. Values for the restricted pupil condition were used to normalize each subject’s reflectance and thus were all 1.0.
Fig. 5.
(a) Intensity and (b) frequency content change in the images when controlling a pupil larger than the subject’s pupil and rejecting lenslets by either zeroing their slopes (Zeroing rejected, left) or removing them from the influence matrix (Removing rejected, right). The condition where the pupil size is restricted to the subject’s pupil is used as reference. The error bars represent the standard deviation of three repeated measurements.
A ratio less than 1 would indicate that the new approaches did not generate better image quality than was obtained when using the standard algorithm. The average ratio value was not significantly different than 1 for any individual subject, however on average image quality was slightly improved with the metric based control. The average intensity ratio for zeroing rejected lenslets and applying the median filter to transition across the pupil edge was 1.06±0.08 and for removing rejected lenslets from the control algorithm was 1.03±0.09. The average frequency content ratio was 1.01±0.03 for both the zeroing rejected and removing rejected lenslets approach. The difference between the two algorithms in terms of average image quality was not significant. Due to blinks and eye motions the convergence times for the human subjects were variable and were not analyzed.
4. Discussion
A spot quality metric combined with neighborhood rules for detecting the pupil boundary, allows detection of the pupil using the SH images and improves the practical control of AO retinal imaging in real time. The quality of the retinal images obtained when controlling the wavefront aberration over an area larger than the eye’s pupil, was similar to the quality of the images obtained when the system’s pupil was restricted to an area slightly smaller than the subject’s actual pupil. This supports the value of the proposed algorithm for reducing aberrations while still using the maximum pupil size for a given subject without requiring intervention by the experimenter. In principle this may allow the experimenter, and the system designer, to relax constraints on maintaining head position during imaging, making images more convenient to obtain and increasing subject’s comfort. While we have not implemented a full system with a large system pupil, we have used the algorithm with patients with only a chin rest to good effect. The algorithm also automatically adjusts for drooping eye lids and blinks, as well as irregular pupil shapes.
The use of Shack Hartmann images to track the location and the movement of the pupil has been used previously [9, 10]. In our approach we do not explicitly calculate the movement or the size of the pupil but rather we directly control for the impact of eye and head motions, as well as pupil size fluctuations, maintaining AO control during the pupil changes. While most AO systems for retinal imaging have an algorithm to deal with the missing spots in the SH and to stop the loop when no light reaches the sensor, the literature on the algorithms used is very scarce. Burns [18] proposed setting the slopes of the lenslets at locations with missing or very weak spots to zero. Here we use a metric based on the ratio between the sum of the intensity of the area surrounding the spot and the sum of the intensity of the whole area corresponding to the lenslet. By applying neighborhood rules to detect the pupil boundary and by providing some conditioning of the pupil margin we automatically obtained good imaging conditions. Since these calculations can be performed in each iteration, a snapshot of the visible area of the pupil of the eye is obtained in every iteration of the loop automatically. In principle this would allow the system to be built with a sufficiently large pupil to include the maximum pupil size across subjects and the algorithm should quickly accommodate small head movements or eye rotations.
More complex rules are possible but the two we used which either set the rejected lenslet slope errors to zero and use a constant control matrix, or generate a new control matrix at each iteration of the loop by removing the rows corresponding to the rejected lenslets produced results similar to shrinking the control pupil to match the subject’s pupil. In addition, at least for the model eye, convergence speed of the control was not negatively affected for the second method. We did not observe a reliable change in convergence speed for the human subjects, probably because changes in the aberration pattern due to eye movements have a larger impact than the minor improvement in convergence time. It is also important to note that our mirror control algorithm is relatively simple, responding only proportionally to the current error, and not incorporating the rate of change in wavefront error nor long term changes.
The final image quality of the videos in human subjects was quantified using both the average intensity of the images, since in a confocal system the intensity of the images is related to the quality of the adaptive optics control [7, 13, 24], and the area under the image FT up to the cutoff frequency up to the cutoff frequency of the eye’s pupil (about 0.45 cycle/μm) and obtained similar results. That is, once converged, all of the algorithms produced equivalent image quality, and thus, the major advantage of the new algorithm was in the ease of use.
We also investigated a more complex control. It has been argued that the intensity of the image of each of the SH spots can be used as a weight (estimating the measurement quality) to obtain a better fit of the wavefront aberration [25]. We implemented a similar approach, but found that in our AO control system it actually increased convergence times without significantly improving the final image quality. Informally, this seemed to occur because the weighting caused the correction algorithm to first concentrate on the areas of the pupil with the highest pupil metrics and the lowest wavefront errors (i.e. areas with good optical quality, usually in the center of the pupil) and in practice the most important region of the pupil to concentrate correction on are the regions with the largest wavefront errors. We thus also implemented a weighting scheme that was inversely related to the metric but this did not improve the images although we implemented only a simple linear relationship between metric and weight and other relationship may improve the control. Finally it is important to note that with the current algorithm, the aberrations are not corrected in the areas where the lenslets were rejected, i.e. pupil boundary and obscured areas, and that this may affect the quality of the retinal imaging. Probably an extrapolation of the phase measurements from inside the pupil [13] could further improve the images.
Another possible improvement would be to consider a full model of the impact of the coupling between nearby actuators. It is possible that part of the increased convergence time for zeroing the wavefront error outside the pupil (Figure 3) is that points outside the eye’s pupil are dragging the movement of the deformable mirror in areas conjugated to the pupil. The median filter is designed to help with this problem by providing a signal to change actuators around the edges without influencing directly the measurements inside the pupil.
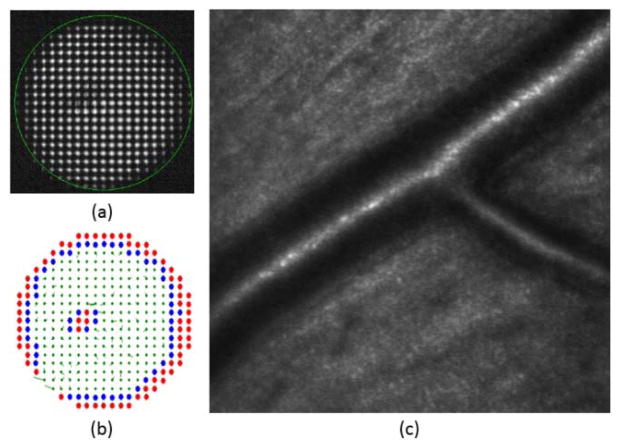
In the human measurements, we found that a single metric threshold was sufficient for all the subjects, i.e. recalculation of the threshold was not needed for different subjects or when imaging different retinal locations. This threshold could require adjustment in an eye with very low optical quality or in an eye that reflects very little light but to date this change has not been required. Though we have not performed a rigorous comparison of the results using the algorithm and manually selecting the pupil size, we have used this algorithm with the remove rejected approach to image more than 60 diabetic patients which included some eyes with intraocular lenses or small cortical or posterior subcapsular cataracts. An example for a patient with a localized subcapsular cataract is shown in Figure 6, where it can be observed that the regions inside and around the cataract were correctly identified for rejection. While a full clinical investigation is beyond the scope of the current paper, we think that the ability to use whatever portions of the pupil are “good enough” makes this approach promising for clinical applications. In our system we found that relaxing the need to select the right pupil size and center the pupil on the system helped streamline the collection of images.
Fig. 6.
Example of the automatic pupil detection algorithm in a 6-mm diameter pupil diabetic patient with a localized posterior subcapsular cataract. (a) SH image (b) depending on its metric rejected spots are marked in red, boundary spots in blue, accepted lenslets with its local slope are marked in green (c) retinal imaging showing artery walls.
One possible limitation of enlarging the field of view of the SH wavefront sensor to sizes larger than the average eye’s pupil is that this would imply that, for a given pupil size, fewer lenslets will be used to determine the wavefront error and a smaller area of the deformable mirror would be used for correction. While this can be considered a drawback, error budget studies show that the limiting factor on the AO systems used in ophthalmology is not usually the number of lenslets [26] and technological changes are allowing the construction of deformable mirrors with higher number of actuators.
Acknowledgments
Funding Information. NIH R01-EY04395, R01 EY024315 and P30EY019008 and Foundation Fighting Blindness TA-CL-0613-0617-IND.
Footnotes
OCIS codes: (010.1080) Active or Adaptive Optics; (170.0110) Imaging systems; (170.4470) Opththalmology.
References
- 1.Liang J, Williams DR, Miller DT. Supernormal vision and high-resolution retinal imaging through adaptive optics. J Opt Soc Am A Opt Image Sci Vis. 1997;14:2884–2892. doi: 10.1364/josaa.14.002884. [DOI] [PubMed] [Google Scholar]
- 2.Roorda A, Romero-Borja F, Donnelly W, III, Queener H, Hebert T, Campbell M. Adaptive optics scanning laser ophthalmoscopy. Opt Express. 2002;10:405–412. doi: 10.1364/oe.10.000405. [DOI] [PubMed] [Google Scholar]
- 3.Hermann B, Fernández EJ, Unterhuber A, Sattmann H, Fercher AF, Drexler W, Prieto PM, Artal P. Adaptive-optics ultrahigh-resolution optical coherence tomography. Opt Lett. 2004;29:2142–2144. doi: 10.1364/ol.29.002142. [DOI] [PubMed] [Google Scholar]
- 4.Zhang Y, Rha J, Jonnal R, Miller D. Adaptive optics parallel spectral domain optical coherence tomography for imaging the living retina. Opt Express. 2005;13:4792–4811. doi: 10.1364/opex.13.004792. [DOI] [PubMed] [Google Scholar]
- 5.Niu S, Shen J, Liang C, Zhang Y, Li B. High-resolution retinal imaging with micro adaptive optics system. Appl Opt. 2011;50:4365–4375. doi: 10.1364/AO.50.004365. [DOI] [PubMed] [Google Scholar]
- 6.Ficocelli M, Amara FB. Online Tuning of Retinal Imaging Adaptive Optics Systems. IEEE Transactions on Control Systems Technology. 2011;20:747–754. [Google Scholar]
- 7.Li KY, Mishra S, Tiruveedhula P, Roorda A. Comparison of Control Algorithms for a MEMS-based Adaptive Optics Scanning Laser Ophthalmoscope. Proc Am Control Conf. 2009;2009:3848–3853. doi: 10.1109/ACC.2009.5159832. [DOI] [PMC free article] [PubMed] [Google Scholar]
- 8.Sahin B, Lamory B, Levecq X, Harms F, Dainty C. Adaptive optics with pupil tracking for high resolution retinal imaging. Biomed Opt Express. 2012;3:225–239. doi: 10.1364/BOE.3.000225. [DOI] [PMC free article] [PubMed] [Google Scholar]
- 9.Arines J, Prado P, Bará S. Pupil tracking with a Hartmann-Shack wavefront sensor. J Biomed Opt. 2010;15:036022. doi: 10.1117/1.3447922. [DOI] [PubMed] [Google Scholar]
- 10.Meimon S, Jarosz J, Petit C, Salas EG, Grieve K, Conan J-M, Emica B, Paques M, Irsch K. Pupil motion analysis and tracking in ophthalmic systems equipped with wavefront sensing technology. Appl Opt. 2017;56:D66–D71. doi: 10.1364/AO.56.000D66. [DOI] [PubMed] [Google Scholar]
- 11.Roddier C, Roddier Fo. Wave-front reconstruction from defocused images and the testing of ground-based optical telescopes. J Opt Soc Am A. 1993;10:2277–2287. [Google Scholar]
- 12.Miloudi C, Rossant F, Bloch I, Chaumette C, Leseigneur A, Sahel JA, Meimon S, Mrejen S, Paques M. The Negative Cone Mosaic: A New Manifestation of the Optical Stiles-Crawford Effect in Normal Eyes. Invest Ophthalmol Vis Sci. 2015;56:7043–7050. doi: 10.1167/iovs.15-17022. [DOI] [PubMed] [Google Scholar]
- 13.Zou W, Qi X, Huang G, Burns SA. Improving wavefront boundary condition for in vivo high resolution adaptive optics ophthalmic imaging. Biomed Opt Express. 2011;2:3309–3320. doi: 10.1364/BOE.2.003309. [DOI] [PMC free article] [PubMed] [Google Scholar]
- 14.Ferguson RD, Zhong Z, Hammer DX, Mujat M, Patel AH, Deng C, Zou W, Burns SA. Adaptive optics scanning laser ophthalmoscope with integrated wide-field retinal imaging and tracking. J Opt Soc Am A Opt Image Sci Vis. 2010;27:A265–A277. doi: 10.1364/JOSAA.27.00A265. [DOI] [PMC free article] [PubMed] [Google Scholar]
- 15.Prieto PM, Vargas-Martín F, Goelz S, Artal P. Analysis of the performance of the Hartmann-Shack sensor in the human eye. J Opt Soc Am A Opt Image Sci Vis. 2000;17:1388–1398. doi: 10.1364/josaa.17.001388. [DOI] [PubMed] [Google Scholar]
- 16.Li C, Sredar N, Ivers KM, Queener H, Porter J. A correction algorithm to simultaneously control dual deformable mirrors in a woofer-tweeter adaptive optics system. Opt Express. 2010;18:16671–16684. doi: 10.1364/OE.18.016671. [DOI] [PMC free article] [PubMed] [Google Scholar]
- 17.Marcos S, Werner JS, Burns SA, Merigan WH, Artal P, Atchison DA, Hampson KM, Legras R, Lundstrom L, Yoon G, Carroll J, Choi SS, Doble N, Dubis AM, Dubra A, Elsner A, Jonnal R, Miller DT, Paques M, Smithson HE, Young LK, Zhang Y, Campbell M, Hunter J, Metha A, Palczewska G, Schallek J, Sincich LC. Vision science and adaptive optics, the state of the field. Vision Res. 2017;132:3–33. doi: 10.1016/j.visres.2017.01.006. [DOI] [PMC free article] [PubMed] [Google Scholar]
- 18.Burns SA, Tumbar R, Elsner AE, Ferguson D, Hammer DX. Large-field-of-view, modular, stabilized, adaptive-optics-based scanning laser ophthalmoscope. J Opt Soc Am A Opt Image Sci Vis. 2007;24:1313–1326. doi: 10.1364/josaa.24.001313. [DOI] [PMC free article] [PubMed] [Google Scholar]
- 19.Zou W, Qi X, Burns SA. Woofer-tweeter adaptive optics scanning laser ophthalmoscopic imaging based on Lagrange-multiplier damped least-squares algorithm. Biomed Opt Express. 2011;2:1986–2004. doi: 10.1364/BOE.2.001986. [DOI] [PMC free article] [PubMed] [Google Scholar]
- 20.Porter J, Queener H, Lin J, Thorn KE, Awwal AAS. Adaptive Optics for Vision Science: Principles, Practices, Design and Applications. John Wiley & Sons; 2006. [Google Scholar]
- 21.Dubra A. Wavefront sensor and wavefront corrector matching in adaptive optics. Opt Express. 2007;15:2762–2769. doi: 10.1364/oe.15.002762. [DOI] [PMC free article] [PubMed] [Google Scholar]
- 22.Guennebaud G, Jacob B, et al. Eigen v3. 2010 ( http://eigen.tuxfamily.org.
- 23.Hofer H, Chen L, Yoon GY, Singer B, Yamauchi Y, Williams DR. Improvement in retinal image quality with dynamic correction of the eye’s aberrations. Opt Express. 2001;8:631–643. doi: 10.1364/oe.8.000631. [DOI] [PubMed] [Google Scholar]
- 24.Sulai YN, Dubra A. Non-common path aberration correction in an adaptive optics scanning ophthalmoscope. Biomed Opt Express. 2014;5:3059–3073. doi: 10.1364/BOE.5.003059. [DOI] [PMC free article] [PubMed] [Google Scholar]
- 25.Panagopoulou SI, Neal DR. Zonal matrix iterative method for wavefront reconstruction from gradient measurements. J Refract Surg. 2005;21:S563–S569. doi: 10.3928/1081-597X-20050901-28. [DOI] [PubMed] [Google Scholar]
- 26.Evans JW, Zawadzki RJ, Jones SM, Olivier SS, Werner JS. Error budget analysis for an adaptive optics optical coherence tomography system. Opt Express. 2009;17:13768–13784. doi: 10.1364/oe.17.013768. [DOI] [PMC free article] [PubMed] [Google Scholar]


