Abstract
Here, we investigated EEG-based source-level spectral differences between adolescents with sports-related concussions and healthy age matched controls. We transformed resting state EEG collected in both groups to the source domain using Independent Component Analysis (ICA) and computed the component process power spectra. For group-level analysis in the source domain, we used a probabilistic framework, Measure Projection Analysis (MPA), that has advantages over parametric k-means clustering of brain sources. MPA revealed that some frontal brain sources in the concussed group had significantly more power in the beta band (p<0.005) and significantly less delta (p<0.01) and theta band power (p<0.05) than the healthy control group. These results suggest that a shift in spectral profile toward higher frequencies in some frontal brain regions might distinguish individuals with concussion from healthy controls.
I. Introduction
Sports activities are a major cause of concussions. It has been estimated that 1.6–3.8 million sports and recreation related concussions occur each year in the United States [1]. A major challenge in the field of neurology is that current neuropsychological, behavioral and standard neuroimaging tools are not sensitive to subtle changes in brain structure and function, thus making the initial diagnosis of concussion difficult. As a result, many adolescents may resume sports activities well before full recovery has occurred, leaving them vulnerable to the potentially serious effects of repeated brain trauma during their critical period of brain development.
In the last few years there have been new developments in imaging methods and analyses. Novel imaging methods are emerging that enable the assessment of the brain structure and function following injury and that may help predict or monitor recovery. An important challenge is to identify imaging biomarkers that provide accurate and meaningful diagnostic information.
A major issue in EEG signal processing is that signals measured on the scalp surface do not each index a single source of brain activity. Each electrode channel records a sum of signals from many different brain areas [2]. Accurate separation and localization of the underlying brain sources is the so-called EEG inverse problem. High-density EEG systems that uniformly cover the scalp surface with a large number of electrodes, combined with modern source imaging procedures is increasingly recognized as a powerful tool for source-resolved brain activity imaging [3], [4].
Most studies investigating the EEG correlates of concussion have analyzed the scalp channel data directly [5], [6], [7]. However, because of volume conduction to and source mixing at the electrodes, the EEG sensor signals are simultaneous mixtures of sources located in various parts of the cortex. In addition, non-brain source processes including eye movements, scalp muscles, head movements, and electrical line noise also contribute to EEG signals. On the assumption that the brain and non-brain source activity time series are statistically independent, independent component analysis (ICA) can separate individual brain and non-brain sources from the scalp mixtures [8]. In this study, we used a powerful ICA method, AMICA [9], that has been shown to provide more dipolar brain sources together with higher independence compared to other algorithms [10].
Although ICA can extract the source activities and facilitate source localization, group-level ICA analysis is nontrivial because of variations across brains and the brain sources extracted for each subject. A recent ICA-based concussion study [11] used k-means clustering of individual subject independent components (ICs) to investigate brain source cluster differences between concussed and non-concussed subjects. Using k-means clustering requires choosing a target number of clusters and relative weights for more than one measure of IC similarity. Here we made use of a recently developed framework, Measure Projection Analysis (MPA), that attempts to avoid these uncertainties[12], [11]. In contrast to [11], which used the standard clinical 19-channel scalp montage, we recorded and analyzed 64-channel EEG data. A lower number of channels limit the number of brain and non-brain sources that can be separated and the accuracy of subsequent source localization [13].
II. Methods
A. Participants
Twenty-one adolescent athletes (all male; mean age, 16.5 years) with a clinical diagnosis of subacute (≤ 3 months previously) sports-related concussion participated in this study. Healthy subjects comprised 33 adolescent soccer players (all male; mean age, 16 years). Subject exclusion criteria included focal neurologic deficits and diagnosis or prescription medications for neurological or psychiatric conditions. All participants were right-handed. Parents of each subject signed an informed consent form that was approved by the University of British Columbia.
B. EEG acquisition protocol
Resting data were collected for five minutes while subjects had their eyes closed. A 64-channel Hydrogel Geodesic SensorNet (EGI, Eugene, OR) with a Net Amps 300 amplifier was used for EEG recording at a sampling rate of 250 Hz. Electrode impedances were typically below 50 kΩ.
C. Data processing
1) Preprocessing
Each subject’s EEG signals were bandpass filtered between 0.5 Hz and 45 Hz. Channels whose time series were not consistently correlated with any other channel (r< 0.8) were discarded. On average, 2–3 channels per subject were rejected. Randomly occurring large amplitude artifacts (with power ≥ 3σ w.r.t clean EEG) were cleaned using ASR [14].
2) Independent Component Analysis
AMICA [9] was used to separate the scalp channel mixtures into maximally independent brain and non-brain sources. Mathematically, ICA decomposes EEG channel time series, denoted by Y(t) as Y(t) = AX(t), where X(t) is the set of time series representing source activations and A is a square matrix storing in its i-th column ai relative projection weights of the i-th source to each scalp channel. ICA optimizes A such that X(t) = A−1Y (t), the component time series, are statistically as independent as possible. Columns of A can then be used to locate each source while rows of X can be used to calculate EEG source activity measures such as ERPs, ERSPs or spectra.
The DIPFIT 1 toolbox in EEGLAB [15] was used to locate the equivalent dipole for each IC (independent component) in the MNI (Montreal Neurological Institute) head model. ICs whose best-fitting dipole accounted for less than %85 of the spatial variance in their scalp projection (column of A), as well as sources whose equivalent dipoles were outside the brain were regarded as non-brain sources and excluded from further analysis. All IC’s were initially clustered with respect to their power spectra for the sole purpose of batch rejection of artifact IC’s. Visual inspection of power spectra of the resulting cluster centroid and the cluster IC scalp maps identified ICs associated with muscle/movement artifacts which were also excluded from further analysis. In total, 665 ICs were retained, on average ~12 ICs per subject.
III. Measure Projection
A. K-means IC clustering
In most EEG studies, the properties of individual subject ICs, including their scalp projection patterns (scalp maps) and associated dipole locations, are never the same and thus require some form of clustering to identify equivalency classes across subjects. As pointed out in [11], [12] common approaches for multi-subject source-level analysis, such as k-means IC clustering, have some drawbacks. It is not clear which IC features or measures to use for clustering or how different measures should be weighted. In [11], it was shown that clustering on source equivalent dipole locations, on IC spatial extents as estimated by sLORETA, or on IC scalp maps gave component clusters exhibiting different spectral group differences. Assuming some fixed number of clusters is another requirement of k-means clustering that can dramatically affect the nature of the resulting clusters and the numbers of ICs included/excluded.
B. Measure Projection
Measure Projection Analysis (MPA) framework [12] was developed to reduce some drawbacks of other clustering methods. First, MPA divides the (MNI) template head model into a cubic grid with 8-mm spacing comprising 3,908 brain voxels. MPA automatically identifies ICs accounting for eye movement artifact using EyeCatch [16] and excludes them from the analysis. Then, given some activity measure for each IC localized with an equivalent current dipole, each such measure is first smoothed out across neighboring voxels to take into account expected inaccuracy in source dipole locations and between-subject anatomical differences. Here, we used mean-subtracted log spectra as the MPA measure. Subtracting the mean log spectrum is equivalent to inversely scaling each IC time-series by its mean log power.
Denoting the set of voxels in the MNI model by V and one such voxel by v, MPA calculates the projected measure 𝔽[M(v)] at every v ∈ V as
| (1) |
where n is the number of ICs in the study. Thus, a spatially-weighted average measure is calculated for each brain voxel, for which the contribution of each IC is determined by the distance between the voxel and the IC equivalent dipole (truncated Gaussian Pi centered at equivalent dipole vi). Next, brain voxels whose projected measure values are consistent with those at nearby voxels are identified using measure convergence C(v), defined in [12] as
| (2) |
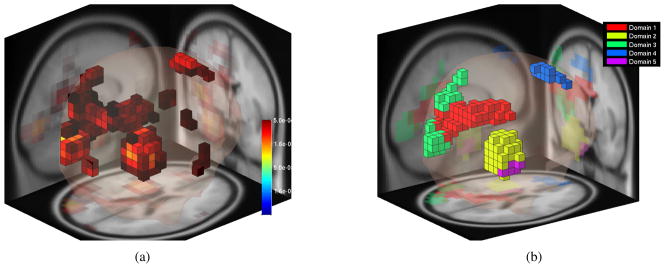
where Si,j is a pairwise IC similarity measure. Estimated measure convergence values C(v) are assigned significance values after bootstrapping using a surrogate distribution of estimates obtained by randomly re-assigning (with replacement) measure vectors to IC dipole locations. Here, we used a statistical consistency threshold of (p<0.05). See Fig. 1a. Significantly consistent voxels may then be clustered into ”domains” using affinity propagation [17] based on the similarity of their projected measures. Affinity propagation automatically determines the number of clusters and outliers consistent with a given domain disparity threshold. Here, we set the maximum similarity threshold between domains to 0.9. Finally, locations or other properties of the identified regional domains of interest may be investigated to assess group-level measure differences.
Fig. 1.
(a) Voxels that show significantly consistent spectra among nearby source locations (p < 0.05). (b) Domains created by affinity propagation clustering with maximum similarity threshold across domains set to 0.9. Domain 4 is the only domain in the frontal part of the brain.
IV. Results
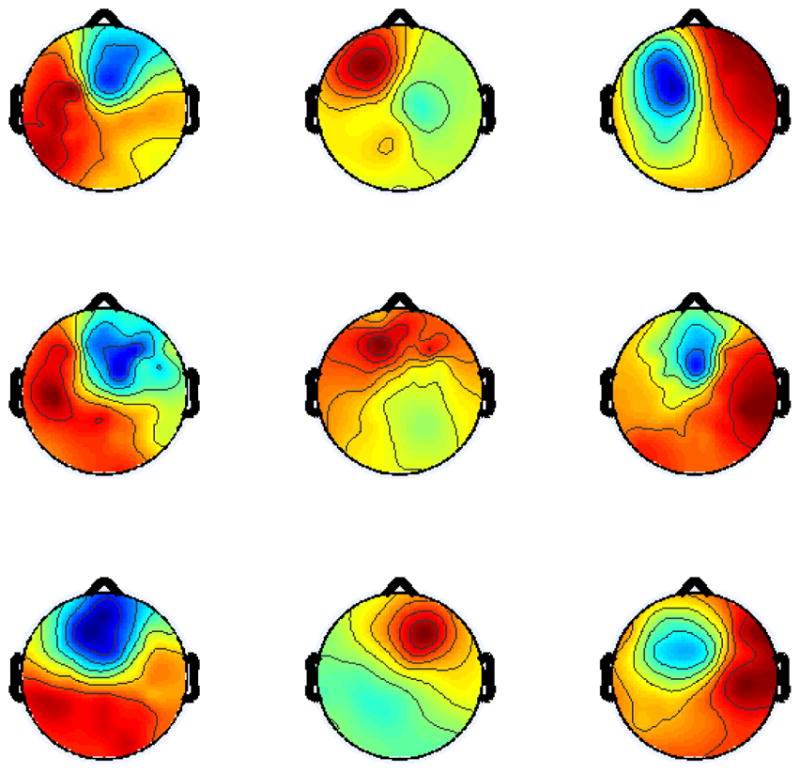
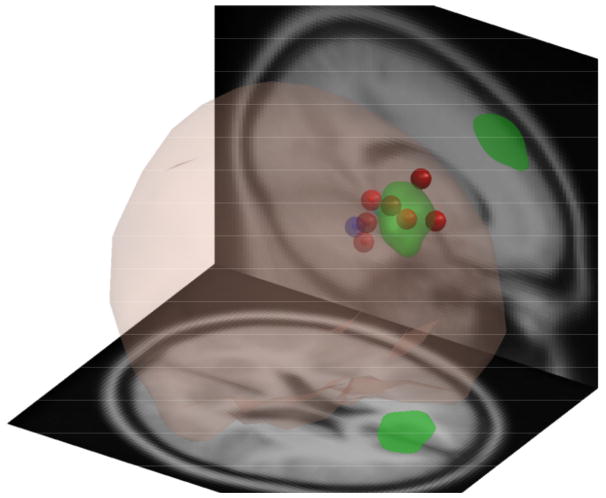
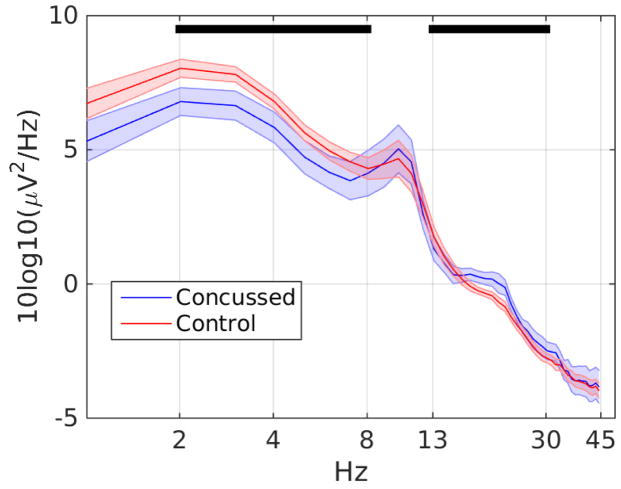
Affinity propagation clustering initially produced 15 domains. Only 5 domains remained after removal of very small domains including less than 6 voxels. See Fig. 1b. The previous IC-based spectral analysis of concussion reported significant group differences in some frontal brain areas [11]. Similarly, we found a cluster located in frontal cortex (Domain 4, centered in the superior frontal gyrus), that contained 48 ICs, 13 ICs from 10 or the 21 concussed subjects (%47.61), and 36 ICs from 21 (%63.63) of the control subjects. Scalp maps of some of the ICs contributing to the domain, as well as their associated equivalent dipole locations, are shown in Figs. 3 and 4. This domain includes voxels from both the right and left hemispheres of the MNI model, although the majority (%85) are on the left side. Mean projected domain spectra for both groups are shown in Fig. 2.
Fig. 3.

Scalp maps of highest contributing 9 sources to Domain 4.
Fig. 4.
DIPFIT localized equivalent dipoles for 9 highest contributing IC’s for Domain 4.
Fig. 2.
Measure-projected IC log spectra for the concussed and control groups at the maximally centered exemplar IC for Domain 4. Shaded regions indicate the standard error of the mean. Black lines correspond to spectral bands with a significant group difference. ICs from the concussed group had significantly less power in the delta and theta bands during eyes-closed rest (p < 0.01 and p < 0.05 respectively) as well as more power in the beta band (p < 0.005) relative to control subjects.
We divided the spectrum into frequency bands delta (2–4Hz), theta (4–8Hz), alpha (8–13Hz), beta (13–30Hz), gamma (30–45Hz) and calculated mean log power in these bands for the ICs contributing to each domain. Bootstrap statistics (using 5,000 iterations) revealed significant group differences for Domain 4 in the delta, theta and beta bands. Contributing ICs from the concussed group had significantly less delta and theta band power (p <0.01, p <0.05 respectively) but higher beta power (p <0.005) than contributing ICs from the control group.
V. Discussion
Our findings partly overlap results of the previous ICA-based concussion study [11]. We also found significantly more beta band power in or near frontopolar cortex in the concussed group during resting state EEG. However, unlike the previous study, we observed significantly less delta and theta power in the concussed group, although EEG spectral slowing has been a commonly reported finding in traumatic brain injury patients. Our finding of power increases and decreases in specific bands in the frontal cortex parallels previous fMRI studies on concussed adolescents that have shown both increases and decreases in functional connectivity within the frontal regions of the brain [18]. These region specific changes in the frontal areas may reflect parallel processes of response to injury and recovery and may be signature of acute concussion. Decreased power at the lower end of the EEG spectrum, together with higher beta power are associated with increased alertness and attentional focus. As pointed out in [19], this can be explained by a mechanism that mTBI patients use to compensate for cognitive deficits arising from their brain injury. Possibly this frequency profile might be used to define a single measure that could differentiate individuals with concussion from still-healthy controls at time of injury, and/or might be used as an index of recovery from mild traumatic brain injury (mTBI).
VI. Conclusions
In this study, we investigated the effects of sports-related concussion on source-resolved EEG spectral measures during eyes-closed rest. Unlike most studies in this field, we used ICA decomposition of high-density scalp data to clean EEG data of artifacts and to transform our analysis domain from scalp sensors to brain sources. Rather than using k-means clustering methods for group-level source analysis, we used a probabilistic framework, Measure Projection Analysis, that takes into account expected inaccuracy in source location estimates and inter-subject differences in brain anatomy. Our results suggested that the concussed group had significantly less delta and theta band power and higher beta power in or near a medial frontal brain area.
Footnotes
Available at http://sccn.ucsd.edu/wiki/A08: DIPFIT
This work was supported by a grant from ”Calit2 Strategic Research Opportunities Program” and ”Center for Brain and Activity Mapping,” UCSD
References
- 1.Faul M, Xu L, Wald MM, Coronado VG. Traumatic brain injury in the United States: emergency department visits, hospitalizations and deaths 20022006. Centers for Disease Control, National Center for Injury Prevention and Control; Atlanta, GA: 2010. [Google Scholar]
- 2.Michel Christoph M, Murray Micah M, Lantz Göran, Gonzalez Sara, Spinelli Laurent, Grave de Peralta Rolando. Eeg source imaging. Clinical neurophysiology. 2004;115(10):2195–2222. doi: 10.1016/j.clinph.2004.06.001. [DOI] [PubMed] [Google Scholar]
- 3.Hoechstetter Karsten, Bornfleth Harald, Weckesser Dieter, Ille Nicole, Berg Patrick, Scherg Michael. Besa source coherence: a new method to study cortical oscillatory coupling. Brain topography. 2004;16(4):233–238. doi: 10.1023/b:brat.0000032857.55223.5d. [DOI] [PubMed] [Google Scholar]
- 4.Makeig Scott, Debener Stefan, Onton Julie, Delorme Arnaud. Mining event-related brain dynamics. Trends in cognitive sciences. 2004;8(5):204–210. doi: 10.1016/j.tics.2004.03.008. [DOI] [PubMed] [Google Scholar]
- 5.Thatcher RW, Biver C, Gomez JF, North D, Curtin R, Walker RA, Salazar A. Estimation of the eeg power spectrum using mri t 2 relaxation time in traumatic brain injury. Clinical Neurophysiology. 2001;112(9):1729–1745. doi: 10.1016/s1388-2457(01)00609-5. [DOI] [PubMed] [Google Scholar]
- 6.Barr William B, Prichep Leslie S, Chabot Robert, Powell Matthew R, McCrea Michael. Measuring brain electrical activity to track recovery from sport-related concussion. Brain Injury. 2012;26(1):58–66. doi: 10.3109/02699052.2011.608216. [DOI] [PubMed] [Google Scholar]
- 7.Slobounov Semyon, Sebastianelli Wayne, Hallett Mark. Residual brain dysfunction observed one year post-mild traumatic brain injury: combined eeg and balance study. Clinical Neurophysiology. 2012;123(9):1755–1761. doi: 10.1016/j.clinph.2011.12.022. [DOI] [PMC free article] [PubMed] [Google Scholar]
- 8.Makeig Scott, Bell Anthony J, Jung Tzyy-Ping, Sejnowski Terrence J, et al. Independent component analysis of electroencephalographic data. Advances in neural information processing systems. 1996:145–151. [Google Scholar]
- 9.Palmer Jason A, Makeig Scott, Kreutz-Delgado Kenneth, Rao Bhaskar D. ICASSP. IEEE; 2008. Newton method for the ica mixture model; pp. 1805–1808. [Google Scholar]
- 10.Delorme Arnaud, Palmer Jason, Onton Julie, Oostenveld Robert, Makeig Scott. Independent eeg sources are dipolar. PLoS ONE. 2012;7:02. doi: 10.1371/journal.pone.0030135. [DOI] [PMC free article] [PubMed] [Google Scholar]
- 11.Ponomarev VA, Gurskaia OE, Kropotov IuD, Artiushkova LV, Muller A. the comparison of clustering methods of eeg independent components in healthy subjects and patients with post concussion syndrome after traumatic brain injury. Fiziologiia cheloveka. 2009;36(2):5–14. [PubMed] [Google Scholar]
- 12.Bigdely-Shamlo Nima, Mullen Tim, Kreutz-Delgado Kenneth, Makeig Scott. Measure projection analysis: a probabilistic approach to eeg source comparison and multi-subject inference. Neuroimage. 2013;72:287–303. doi: 10.1016/j.neuroimage.2013.01.040. [DOI] [PMC free article] [PubMed] [Google Scholar]
- 13.Acar Zeynep Akalin, Makeig Scott. Effects of forward model errors on eeg source localization. Brain topography. 2013;26(3):378–396. doi: 10.1007/s10548-012-0274-6. [DOI] [PMC free article] [PubMed] [Google Scholar]
- 14.Mullen Tim, Kothe Christian, Chi Yu Mike, Ojeda Alejandro, Kerth Trevor, Makeig Scott, Cauwenberghs Gert, Jung Tzyy-Ping. Real-time modeling and 3d visualization of source dynamics and connectivity using wearable eeg. Conference proceedings:... IEEE EMBC, EMBS; 2013. p. 2184. NIH Public Access. [DOI] [PMC free article] [PubMed] [Google Scholar]
- 15.Delorme Arnaud, Makeig Scott. Eeglab: an open source toolbox for analysis of single-trial eeg dynamics including independent component analysis. Journal of neuroscience methods. 2004;134(1):9–21. doi: 10.1016/j.jneumeth.2003.10.009. [DOI] [PubMed] [Google Scholar]
- 16.Bigdely-Shamlo Nima, Kreutz-Delgado Ken, Kothe Christian, Makeig Scott. Eyecatch: Data-mining over half a million eeg independent components to construct a fully-automated eye-component detector. Engineering in Medicine and Biology Society (EMBC), 2013 35th Annual International Conference of the IEEE; IEEE; 2013. pp. 5845–5848. [DOI] [PMC free article] [PubMed] [Google Scholar]
- 17.Frey Brendan J, Dueck Delbert. Clustering by passing messages between data points. Science. 2007;315(5814):972–976. doi: 10.1126/science.1136800. [DOI] [PubMed] [Google Scholar]
- 18.Borich Michael, Babul Aliya-Nur, Yuan Po Hsiang, Boyd Lara, Virji-Babul Naznin. Alterations in resting-state brain networks in concussed adolescent athletes. Journal of neurotrauma. 2014 doi: 10.1089/neu.2013.3269. [DOI] [PubMed] [Google Scholar]
- 19.Slobounov Semyon M, Sebastianelli Wayne. Concussions in Athletics: From Brain to Behavior. Springer Science & Business Media; 2014. [Google Scholar]


