

Abstract
The incident field size and the interplay of absorption and scattering can influence the in-vivo light fluence rate distribution and complicate the absolute quantification of fluorophore concentration in-vivo. In this study, we use Monte Carlo simulations to evaluate the effect of incident beam radius and optical properties to the fluorescence signal collected by isotropic detector placed on the tissue surface. The optical properties at the excitation and emission wavelengths are assumed to be identical. We compute correction factors to correct the fluorescence intensity for variations due to incident field size and optical properties. The correction factors are fitted to a 4-parameters empirical correction function and the changes in each parameter are compared for various beam radius over a range of physiologically relevant tissue optical properties (μa = 0.1 – 1 cm−1, μs’= 5 – 40 cm−1).
Keywords: Fluorescence, MC simulation, tissue optical properties, incident field size, photodynamic therapy
INTRODUCTION
Fluorescence spectroscopy is an established and widely employed technology in physical, chemical, biological and medical research. It is an important tool for the field of photodynamic therapy (PDT) as most photosensitizers are fluorescent dyes. Photosensitizer fluorescence can be used to quantify its concentration and also to monitor its photobleaching during PDT. However, quantifying in vivo fluorescence emission is very challenging because the measured fluorescence intensity can be affected by the spatial and temporal variation in tissue optical properties. These variations in the fluorescence intensity may be mistaken as the change in photosensitizer concentration if the effect of tissue optical properties is not account for carefully.
In previous study [1, 2], we investigated the relationship between fluorescence signal and tissue optical properties using Monte Carlo simulation, for an isotropic detector placed on the tissue surface in a broad incident light beam. For a fixed fluorophore concentration, the results show that changes in optical properties alter the fluorescence signal detected on tissue surface, indicating that an optical properties correction is needed for absolute quantification of fluorophore concentrations. Experiments in tissue simulating phantoms, with broad incident light beam, confirm that an empirical correction can accurately recover the photosensitizer concentration over a physiologically relevant range of optical properties [2, 3]. Both the correction factors obtained from MC simulations and experimental results increase with μa and decrease with μs’, and can be fitted to a common empirical optical properties correction function, . Although broad beams are commonly used in most clinical PDT, small circular light beams of ≤ 2 cm diameter are sometimes used to treat small surface lesion and recurrent breast cancers on the chest wall. Furthermore, small diameter beams are commonly used in the laboratory PDT research to treat small animals. For small diameter circular light fields, the distribution of light fluence rate becomes dependent on the field size when the lateral dimensions are comparable to the effective mean-free-path of photons for optical properties relevant in PDT. The changes in the distribution of light fluence rate in tissue due to incident field size have been demonstrated using MC simulation [4, 5]. Significant reduction of light fluence rate along the central axis is observed for small diameter circular beam as compared to broad incident beam. The variation in the in vivo light fluence rate distribution due to incident field size could have significant impact on the fluorescence intensity measured at the tissue surface. Therefore, variation in fluorescence intensity due to both the incident field size and tissue optical properties has to be carefully accounted for in order to quantify the absolute in vivo photosensitizer concentration.
In this study, we use Monte Carlo simulations to evaluate the effect of different incident circular beam size to the fluorescence signal collected by isotropic detector placed on the tissue surface. We determine the fluorescence of circular fields with radii of 0.5 cm to 8 cm for a range of physiologically relevant tissue optical properties (μa = 0.1 – 1 cm−1, μs’= 5 – 40 cm−1) based on a review on the in-vivo tissue optical properties [6]. Correction factors are computed to correct the fluorescence intensity for variations due to incident field size and optical properties. The correction factors are then fitted to a 4-parameters (C1, b1, b2 and C2) empirical correction function and the changes in the parameters are compared.
METHODS
2.1 Monte Carlo modeling of fluorescence
The Monte Carlo algorithm used here was written in Matlab (The Mathworks Inc., Natick, MA.) as described previously [1, 3, 4]. The setup geometry to be calculated by Monte-Carlo simulation for a semi-infinite medium with uniform optical properties, i.e. the absorption coefficient μa, the reduced scattering coefficient , the scattering anisotropy g (= 0.9), and the index of refraction (n2 = 1.4 for tissue) is shown in Figure 1. The outside medium is air (n1 = 1). The light field is parallel and uniform inside a circle with radius R (0.1 – 4 cm) and incident normal to the air-tissue interface.
Figure 1.
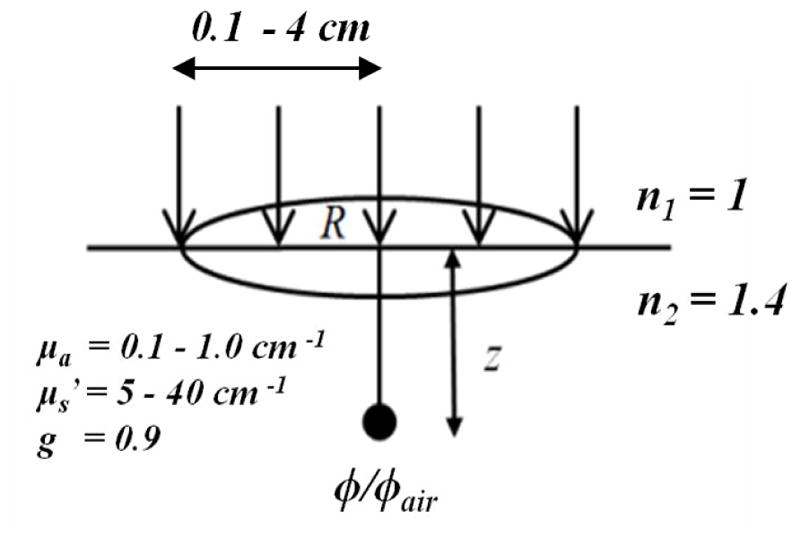
Setup geometry for Monte-Carlo simulation for a semi-infinite turbid medium.
Briefly, a photon with an initial weight of 1 is launched normal to the air-tissue interface. Specular reflection at the surface, resulting from the refractive index mismatch (n1/n2=1.4), is calculated by the Fresnel reflectance for unpolarized light. Each photon is traced through multiple scattering events until it escapes the medium or fall below a threshold weight, triggering a random roulette process. In the roulette process, a photon has a one in ten chance of surviving with ten times it initial weight and nine in ten chance of being terminated. At the end of each step, the photon weight is reduced by a factor of 1-a’ ( ) and a new scattering angle is determined based on the optical properties of the medium.
To model fluorescence, a new fluorescence photon is generated at each step and is followed by the same code until it escapes the medium or completely absorbed. In this study, the optical properties at the excitation and emission wavelengths are assumed to be identical. The MC code records the distribution of light fluence rate in the medium (ϕ), the diffuse components of the reflected light (Rd) and the fluorescence light at the surface (FMC). The magnitude of ϕ and FMC are normalized to the light fluence rate in-air (ϕair) which is proportional to the total number of incident photons. A flow chart showing the events of fluorescence simulation in scattering medium is shown in Figure 2.
Figure 2.

Flow chart of Monte Carlo simulation of fluorescence in scattering medium.
2.2 Correction of fluorescence for optical properties
MC simulated fluorescence (FMC) is normalized to the total light fluence rate on the surface (1+2Rd) [5, 7]. This normalization is done so that our MC results are consistent with our PDT dose dosimetry results, in which the measured fluorescence was normalized to the fluence rate measured on the tissue surface. To account for the differences in fluorescence due to the variation in optical properties, a set of correction factors, CFMC, were computed using the relationship shown in equation (1).
| (1) |
CFMC is defined as the ratio of FMC,ref to FMC, where FMC,ref is the fluorescence simulated at the reference optical properties (μa,ref = 0.3cm−1 and μ’s,ref = 10 cm−1). The product of CFMC and FMC at any optical properties (μa, μ’s) is equal to FMC,ref. The correction factor at the reference optical properties is by definition equal to 1.
RESULTS AND DISCUSSIONS
Fig. 3(a) – (f) shows the Monte Carlo simulation results of fluorescence detected with an isotropic detector placed on the tissue surface, at the center of incident circular beam of various radii. Fluorescence intensity is plotted against incident beam radius for a wide range of optical properties. The results show the measured fluorescence intensity increases with incident field size and reaches plateau at different beam radius for different optical properties. For the range of optical properties simulated in this study, fluorescence intensity remains unchanged for broad incident beam (radius>4cm). For small field circular beam, fluorescence intensity decreases with beam radius due to significant reduction in excitation light fluence rate along the central axis [4].
Figure 3.

MC simulated fluorescence, detected at the tissue surface, plotted against the radius of circular incident light beam for a range of physiologically relevant tissue optical properties.
Figures 4(a), (c), (e) and (g) show the Monte Carlo simulation results of fluorescence detected on the surface for beam radii 0.5, 1, 2, and 4 cm for a range of tissue optical properties (μa = 0.1 – 1 cm−1 and μs’ = 5 – 40 cm−1). The results show that fluorescence intensity decreases with absorption and increases with scattering of the turbid medium for all incident beam diameters. To compare the differences in the change of fluorescence intensity due to optical properties and incident field size, we computed the correction factor for MC simulated fluorescence using Eq. (1). The reference optical properties used are μa=0.3cm−1 and μs’=10cm−1. Figures 4(b), (d), (f) and (h) show the optical properties correction factors for the corresponding MC simulated fluorescence on the left. CF value is 1 at the reference optical properties and is represented by (*) in each CF plot. We fitted the CF using a 4-parameter empirical correction function as shown in Eq. (2) [2, 3] and the parameters obtained from the fitting results are listed in table 1.
Figure 4.

(a), (c), (e) and (g): Fluorescence detected at tissue surface for incident beam radii 0.5, 1, 2, and 4 cm, plotted against tissue optical properties; (b), (d), (f), and (h): optical properties correction factors for the corresponding MC simulation results computed using Eq (1). Reference optical properties used are μa=0.3cm−1 and μs’=10cm−1.
Table 1.
Optical properties correction function parameters obtained by fitting MC simulated CF results using Eq. (2) for different incident beam radii.
| Incident beam radius (cm) | Parameters | |||
|---|---|---|---|---|
| C1 | b1 | b2 | C2 | |
| 0.15 | 33.39 | 0.265 | −1.373 | 0.00082 |
| 0.3 | 29.06 | 0.3912 | −1.303 | 0.00226 |
| 0.5 | 27.52 | 0.518 | −1.173 | 0.00352 |
| 0.8 | 23.40 | 0.6654 | −1.046 | 0.00503 |
| 1 | 22.59 | 0.736 | −1.002 | 0.00584 |
| 2 | 21.76 | 0.8897 | −0.9535 | 0.00762 |
| 4 | 22.06 | 0.9221 | −0.9511 | 0.00783 |
| (2) |
For small circular field with beam radius smaller than 4 cm, we found that all the 4 parameters can be expressed as a function of radius, r. We have found the following relationships:
| (3) |
| (4) |
| (5) |
| (6) |
Figure 5 shows the dependence of parameters C1, b1, b2, C2 to beam radius and their corresponding fits using Eqs. (3) – (6). The goodness of fit between the parameters and their respective equations are shown in each plot. C1 decreases with beam radius while the other 3 parameters b1, b2, and C2 increase with beam radius. Fig. 5(a) suggests that higher correction factor is needed to account for the reduction in fluorescence detected on tissue surface when small incident field size is used. C1 values may vary for different reference optical properties used and also for different spectrometer sensitivity. b1, b2, and C2 describe the optical properties and beam radius dependence of the optical properties correction factors for fluorescence measured on tissue surface.
Figure 5.

Fitting results between the 4 parameters (C1, b1, b2, C2) and the incident beam radius, r. Black circles represent the parameters fitted to optical properties correction factors for MC simulated fluorescence using Eq. (2). Black lines represents fitting results using Eqs. (3) – (6). R2 refers to the goodness of fit between the parameter to their respective equation.
The results show that fluorescence measured using an isotropic place on tissue surface can be affected by both tissue optical properties and incident beam size. Special care has to be taken to account for these variations in the measured fluorescence intensity in order to accurately quantify the absolute in-vivo concentration of fluorophore. It should be noted that the optical properties at the excitation and emission wavelengths are assumed to be identical in this study. This scenario is valid to fluorophores in which the excitation and emission wavelengths are close, such as Photofrin. Photofrin is a type of photosensitizer that has an absorption peak at 630 nm and emits fluorescence light between 650 to 700 nm. The difference in optical properties at these wavelengths are small and this method has been successfully applied to correct for the optical properties effect on measured fluorescence in a Photofrin-mediated pleural PDT using broad beam excitation light to quantify and investigate intra- and inter-patient photosensitizer uptake [3]. However, this method may not be applicable to other fluorophores that have very different optical properties at the excitation and emission wavelengths. The interplay of absorption and scattering of both excitation and fluorescence light within the tissue can severely alter the measured fluorescence. A more comprehensive study is essential to investigate and account for the variation in the measured fluorescence intensity due to the difference in the optical properties at both the excitation and emission wavelengths. A correction function that takes into account incident field size and optical properties at both excitation and emission wavelengths would be very useful for various biomedical applications to quantify in-vivo fluorescence emission.
CONCLUSION
We use Monte Carlo simulations to model fluorescence signal collected by isotropic detector placed on the tissue surface. We evaluated the effect of incident beam radius and tissue optical properties to the measured fluorescence. The fluorescence signal for small circular fields are substantially lower than that of the broad beam of the same incident irradiance. An improved 4-parameter correction function can be used to correct the measured fluorescence intensity for variations due to incident beam size and tissue optical properties. This correction method is useful to quantify fluorescence excited by any beam size but is limited to fluorescent dyes with similar optical properties at the excitation and emission wavelengths. Future study includes the improvement of the correction function to account for the effect of the difference in optical properties at both excitation and emission wavelengths to the measured fluorescence.
Acknowledgments
This work is supported by grants from the National Institute of Health (NIH) R01 CA154562 and P01 CA87971.
References
- 1.Lambson K, Liang X, Sharikova AV, Zhu TC, Finlay JC. A theoretical and experimental examination of fluorescence in enclosed cavities. Proc SPIE. 2013;8568:85680B. doi: 10.1117/12.2004314. [DOI] [PMC free article] [PubMed] [Google Scholar]
- 2.Ong YH, Kim MM, Finlay JC, Dimofte A, Cengel KA, Zhu TC. Four-Channel PDT Dose Dosimetry for Pleural Photodynamic Therapy. Proc SPIE. 2017;10047:1004717–1. [Google Scholar]
- 3.Ong YH, Kim MM, Finlay JC, Dimofte A, Singhal S, Glatstein E, Cengel KA, Zhu TC. PDT dose dosimetry for Photofrin-mediated pleural photodynamic therapy (pPDT) Phys Med Biol. 2017;63(1):015031. doi: 10.1088/1361-6560/aa9874. [DOI] [PMC free article] [PubMed] [Google Scholar]
- 4.Ong YH, Zhu TC. Analytic function for predicting light fluence rate of circular fields on a semi-infinite turbid medium. Opt Exp. 2016;24(23):26261–81. doi: 10.1364/OE.24.026261. [DOI] [PMC free article] [PubMed] [Google Scholar]
- 5.Zhu TC, Finlay JC, Dimofte A, Hahn SM. Light dosimetry at tissue surfaces for oblique incident circular fields. Proc SPIE. 2004;5315:113–124. doi: 10.1117/12.529827. [DOI] [PMC free article] [PubMed] [Google Scholar]
- 6.Sandell JL, Zhu TC. A review of in-vivo optical properties of human tissues and its impact on PDT. J Biophotonics. 2011;4(11–12):773–787. doi: 10.1002/jbio.201100062. [DOI] [PMC free article] [PubMed] [Google Scholar]
- 7.Zhu TC, Dimofte A, Hahn SM, Lustig RA. Light dosimetry at tissue surfaces for small circular fields. Proc SPIE. 2003;4952:56–67. doi: 10.1117/12.474144. [DOI] [PMC free article] [PubMed] [Google Scholar]