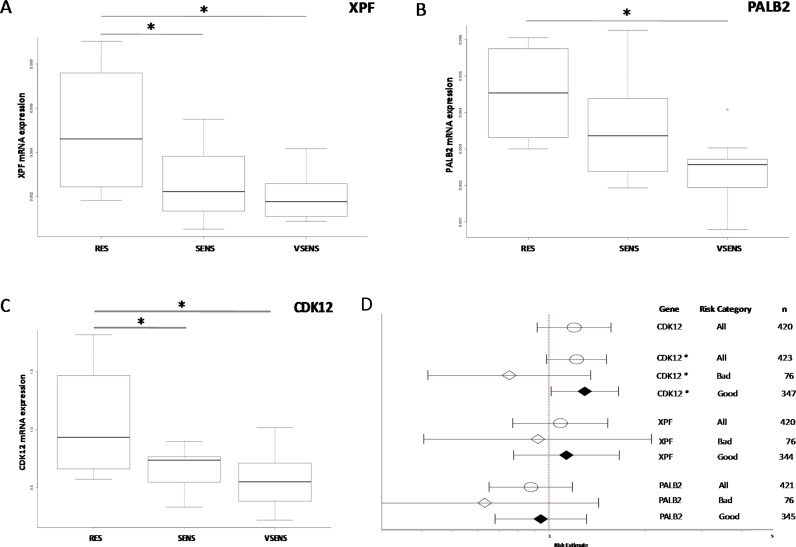
Figure 4. Gene expression levels and DDP response.
Panels (A–C): box plots of XPF, PALB2 and CDK12 gene expression levels respectively and response to DDP treatment in high-grade ovarian cancer PDXs. The circle in the PALB2 plot indicates an outlier. *p < 0.05. Panel (D): forest plot of the relation between gene expression and ovarian cancer patient survival. Estimated risk of recurrence in patients with different mRNA levels of CDK12, XPF and PALB2 genes (l- lower CI; -l upper CI; ● estimate). CDK12*: the CDK12 mRNA level was taken as zero in patients with CDK12 mutated; RT (residual tumor) > 2 cm; RT < 2 cm.

