Abstract
Pancreatic ductal adenocarcinoma (PDAC) is an extremely aggressive disease with poor prognostic implications. This is partly due to a large proportion of PDACs carrying mutations in TP53, which impart gain-of-function characteristics that promote metastasis. There is evidence that microRNAs (miRNAs) may play a role in both gain-of-function TP53 mutations and metastasis, but this has not been fully explored in PDAC. Here we set out to identify miRNAs which are specifically dysregulated in metastatic PDAC. To achieve this, we utilised established mouse models of PDAC to profile miRNA expression in primary tumours expressing the metastasis-inducing mutant p53R172H and compared these to two control models carrying mutations, which promote tumour progression but do not induce metastasis. We show that a subset of miRNAs are dysregulated in mouse PDAC tumour tissues expressing mutant p53R172H, primary cell lines derived from mice with the same mutations and in TP53 null cells with ectopic expression of the orthologous human mutation, p53R175H. Specifically, miR-142-3p is downregulated in all of these experimental models. We found that DNA methyltransferase 1 (Dnmt1) is upregulated in tumour tissue and cell lines, which express p53R172H. Inhibition or depletion of Dnmt1 restores miR-142-3p expression. Overexpression of miR-142-3p attenuates the invasive capacity of p53R172H-expressing tumour cells. MiR-142-3p dysregulation is known to be associated with cancer progression, metastasis and the miRNA is downregulated in patients with PDAC. Here we link TP53 gain-of-function mutations to Dnmt1 expression and in turn miR-142-3p expression. Additionally, we show a correlation between expression of these genes and patient survival, suggesting that they may have potential to be therapeutic targets.
Introduction
PDAC is the most common and most aggressive form of pancreatic cancer and has very poor prognosis, with an average 5-year survival of <10%1. This is often due to the disease being diagnosed only after metastatic onset, and its resistance to conventional therapeutics2. A better understanding of the molecular events governing PDAC progression is required to develop more suitable therapeutic interventions.
Around 90% of sporadic human PDACs are initiated by mutations to the K-RAS proto-oncogene, which results in constitutive activation of K-RAS signalling3. Mouse studies with targeted mutation of Kras develop pancreatic intraepithelial neoplasia (PanIN), which progress slowly and lead to malignant adenocarcinomas at a low frequency4. The majority of mutant Kras-induced PanINs undergo senescence and require further mutations in tumour suppressors, such as Trp535,6, Cdkn2a7, Tgfbr28, Smad49 or Pten10,11, to progress into invasive adenocarcinomas.
Mutations in TP53 are present in ~40–70% of PDAC patients12. The majority of these mutations occur in the DNA-binding domain of TP53, resulting in a protein which lacks the capacity to bind DNA13. The mutated TP53 proteins have dominant-negative effects on transcription as the insertion of just one mutated version into the TP53 homo-tetramer prevents its function14. Additionally, a number of studies have shown that specific mutations in TP53, such as p53R172H, impart additional gain-of-function characteristics, including initiation of metastasis, which are not observed following TP53 loss5,6.
Mutations to PTEN are not observed with high frequency in human PDACs, though hyper-activation of signalling pathways normally inhibited by PTEN, such as PI3K, is observed in ~60% of cases15. However, when they do occur, they allow cells to bypass K-RAS-induced senescence in PanIN lesions11 and thus promote formation of PDAC. Importantly, mutations to PTEN have not been shown to induce metastasis in PDAC11.
The incidence of the gain-of-function TP53 mutations, including p53R172H (R175H in humans), in aggressive tumours and their documented functional role in metastasis testifies to their importance, but their full molecular impact has not yet been elucidated6,16–18. A number of studies have strongly implicated miRNAs and their key biogenesis enzymes, Drosha and Dicer, as critical mediators of mutant TP53 activity. Mutant TP53 has been shown to interfere with Drosha interactions with DEAD-box protein 5 (DDX5/p68)19 and DEAD-box protein 17 (DDX17/p72/p82)20, leading to reduced processing of specific subsets of primary miRNAs. Moreover, previous studies have shown that decreased Dicer expression can result in metastasis21,22 and this process may involve members of the TP53 family23,24. Mutant TP53 has also been shown to interact with and inhibit other members of the TP53 family: TAp63 and TAp7325. In fact, miRNAs which are direct transcriptional targets of TAp63, miR-130b26 and let-7i17 have been shown to be downregulated by mutant TP53.
Together these studies strongly suggest that miRNAs are key mediators acting downstream of gain-of-function TP53 mutations. MiRNAs relay their activity by negatively regulating gene expression through base pairing with hundreds of target mRNAs thus controlling gene expression networks and giving them the potential to affect complex cellular mechanisms such as metastasis27. Because of these observations, we wished to specifically focus on the miRNAs which were regulated in mouse models of PDAC carrying the gain-of-function mutant p53R172H. While miRNA expression profiles of PDAC in primary patient samples have previously been published28, none have looked specifically at how mutant TP53 affects miRNA expression in this disease. This is critical given that mutant TP53 has been shown to induce metastasis, which is the predominant cause of cancer-related morbidity and mortality. Here we show that mutant p53R172H inhibits expression of miR-142-3p, a microRNA known to drive invasion and metastasis in PDAC29. We show that this occurs through a DNMT1-dependent mechanism leading to increased genomic methylation around the miR-142-3p genomic locus. Importantly, we show that both DNMT1 and miR-142-3p expression correlate with patient survival, which may provide opportunities for therapeutic intervention.
Results
Mutant p53R172H expression leads to downregulation of a subset of miRNAs in PDAC
The aim of this study was to identify miRNAs, which were dysregulated by the gain-of-function p53R172H mutant in PDAC and thus potentially involved in metastasis as opposed to loss of p53 function, which does not cause metastasis5,6. Pdx1-Cre; LSL-KrasG12D/+; LSL-Trp53R172H/+ (KPC) mice carry pancreas-specific mutant KrasG12D and gain-of-function p53R172H and develop invasive and metastatic PDAC5. Tumour tissue from these mice (hereafter referred to as Kras p53R172H) was studied, along with tumour tissue from Pdx1-Cre; LSL-KrasG12D/+; LSL-Trp53flox/+ (Kras p53flox) mice and Pdx1-Cre; LSL-KrasG12D/+; Ptenflox/+ (Kras Ptenflox) mice, both of which develop PDACs that rarely metastasise6,11. The use of these two controls allowed us to differentiate between microRNAs whose expression is dependent on WT p53 and those regulated by the p53R172H gain-of-function mutant. This is particularly important as previous studies have suggested that mutant p53R172H gain-of-function is responsible for metastasis5,6. As Kras p53flox cells have lower Trp53 expression than Kras Ptenflox cells, microRNAs which show no change in expression between the controls but are significantly different in the Kras p53R172H condition are likely to be changing due to gain of function rather than dominant-negative activity of mutant p53R172H. Global miRNA expression profiles were investigated using miRNA microarrays, interrogating total RNA from mouse primary PDAC tissues.
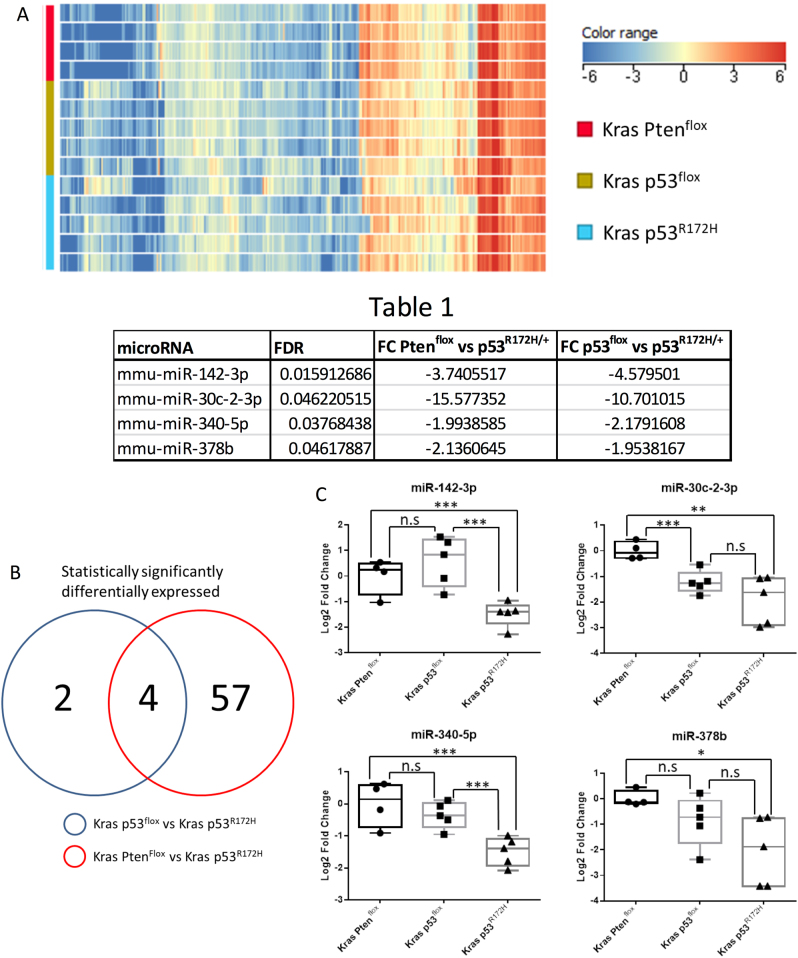
MiRNAs were included in the study if all of the samples within at least one of the conditions had detectable signals for it in the microarray. Using this cutoff, a total of 307 miRNAs were detected (Fig. 1a). Statistical analysis identified 61 miRNAs which were significantly differentially expressed in the Kras p53R172H samples compared to the Kras Ptenflox samples, and six miRNAs which were significantly differentially expressed in the Kras p53R172H samples compared to the Kras p53flox samples (Supplemental Fig. 1). A total of four miRNAs, miR-142-3p, miR-30c-2-3p, miR-340-5p and miR-378b, were found to be dysregulated in the Kras p53R172H tissues compared to both the Kras p53flox and Kras Ptenflox tissues. All four were downregulated in the Kras p53R172H tissues (Fig. 1b and Table 1). RT-qPCR validation confirmed that the expression of miR-142-3p and miR-340-5p does not differ between the two control conditions (Kras p53flox and Kras Ptenflox), but both miRNAs are significantly downregulated in the Kras p53R172H tissues (Fig. 1c). Expression of miR-30c-2-3p and miR-378b was found to be significant between Kras Ptenflox and Kras p53R172H but not between Kras Ptenflox and Kras p53R172H (Fig. 1c). This suggests that miR-142-3p and miR-340-5p expression is directly affected by mutant p53R172H expression.
Table 1.
▓▓▓▓
| microRNA | FDR | FC Pten flox vs p53 R172H | FC p53 flox vs p53 R172H |
|---|---|---|---|
| mmu-miR-142-3p | 0.015912686 | −3.7405517 | −4.579501 |
| mmu-miR-30c-2-3p | 0.046220515 | −15.577352 | −10.701015 |
| mmu-miR-340-5p | 0.03768438 | −1.9938585 | −2.1791608 |
| mmu-miR-378b | 0.04617887 | −2.1360645 | −1.9538167 |
Fig. 1. Global profiling of microRNA expression in tissues from PDAC mouse models.
a Agilent microRNA microarrays were used to investigate global microRNA expression profiles from Kras Ptenflox (n = 4), Kras p53flox (n = 5) and Kras p53R172H (n = 5)-expressing mouse pancreatic tumour tissues. Heat map shows the hierarchal clustering and expression levels of microRNAs for all the samples in the analysis. Statistical analysis and fold changes presented in Table 1 were calculated using a one-way ANOVA with post hoc analysis using Tukey’s honest significance difference test (HSD) with an FDR (Benjamini Hochberg)-adjusted p value cutoff of 0.05. A list of all statistically significantly changed microRNAs can be found in supplemental Fig. 1. b Venn diagram demonstrating the relationship between miRNAs differentially expressed in Kras p53R172H/+ vs Kras Ptenflox and Kras p53R172H/+ vs Kras p53flox tumours. c RT-qPCR was used to validate the microarray data using the ΔΔCT method with U6 snRNA as the reference gene. A two-sample, two-tailed, unpaired t-test was used to compare the ΔCT values from each group. Statistical significance is represented as *p < 0.05, **p < 0.01 and ***p < 0.005
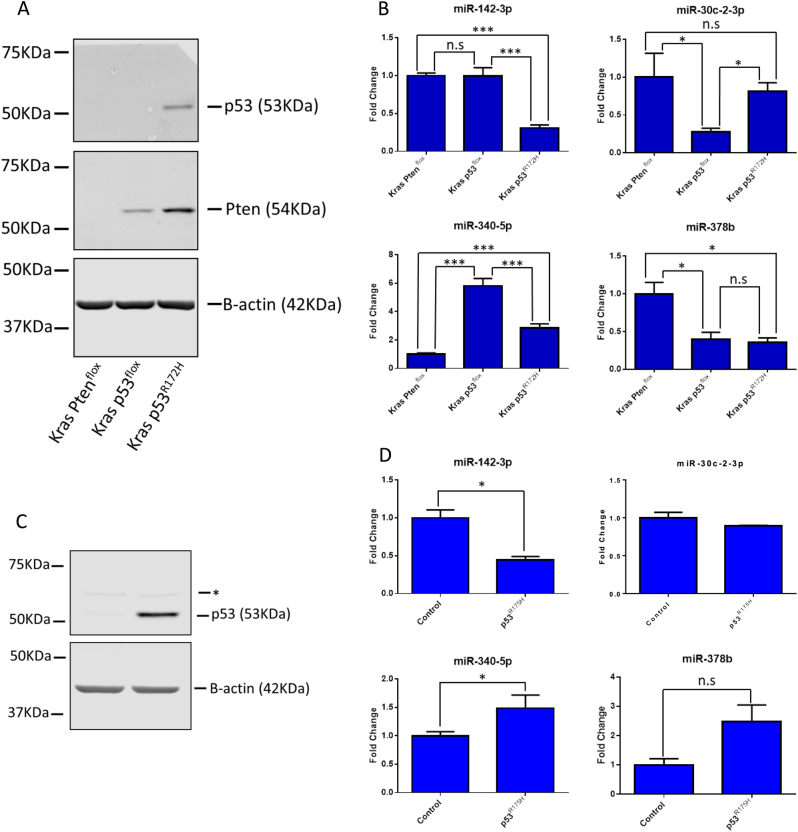
This analysis provides information about miRNA expression changes in the physiological context of the primary tumour environment in mouse models. However, tissues are inherently heterogeneous with respect to cellular populations. In order to test whether the miRNAs dysregulated in the Kras p53R172H tissues were specifically downregulated in tumour cells, we employed primary cell lines derived from each of the tumour models. As expected, Kras Ptenflox cell lines do not express PTEN, consistent with LOH during tumour progression as described previously11, and similarly Kras p53flox cell lines do not express p53 as the remaining wild-type allele is lost during tumourigenesis (Fig. 2a). Thus, p53 was only observed in Kras p53R172H lines, where the mutant protein is insensitive to degradation (Fig. 2a). RT-qPCR of the cells lines showed that expression of miR-142-3p follows the profile observed in the tissue samples, with no difference between the control conditions (Kras p53flox and Kras p53R172H) and a significant downregulation in the mutant Kras p53R172H cells (Fig. 2b). The expression of the other miRNAs identified in tissue samples did not show the same pattern of changes which might indicate that the observed differences in tissue may be due to their heterogeneity (Fig. 2b).
Fig. 2. Validation of microRNA expression in primary cell lines and Kras p53flox cells with ectopic expression of mutant p53R172H.
a Primary cell lines with the same genotype as the primary tissue samples used in Fig. 1 were analysed for protein expression by western blot. b The expression of the microRNAs identified as being dysregulated in p53R172H-expressing tissues was investigated in these cell lines using the ΔΔCT method with U6 snRNA as the reference gene. The results represent the mean of three biological repeats; the error bars represent the maximum relative quantity. A two-sample, two-tailed, paired t-test was used to compare the ΔCT values from each group. Statistical significance is represented as *p < 0.05 and ***p < 0.005. c Kras p53flox with ectopic expression of p53R175H and a control cell line stably expressing an empty vector were analysed by western blot. The * represents a non-specific band of unknown origin. d Expression of the microRNAs identified as being dysregulated in the Kras p53R172H tissues was interrogated by RT-qPCR in these cell lines using the ΔΔCT method with U6 snRNA as the reference gene. The results represent the mean of three biological repeats with the error bars representing the maximum relative quantity. A two-sample, two-tailed, paired t-test was used to compare the ΔCT values from each group. Statistical significance is represented as *p < 0.05
Next, we used a murine Kras p53flox cell line with ectopic expression of the analogous human mutant TP53R175H to show that the human orthologue of this mutation was also capable of affecting the expression of the miRNAs of interest6. As tumours in Kras p53flox mice undergo loss of the remaining wild-type Trp53 allele, wild-type p53 is not expressed in these cells. This allowed us to exclude that the observed changes in miRNA expression are due to the dominant-negative effect of mutant p53 on wild type. Western blot analysis confirmed that TP53 is only present in the cell line with ectopic expression of mutant p53R175H (Fig. 2c). Ectopic expression of mutant p53R175H led to a downregulation of miR-142-3p, which confirmed our results for the mouse protein. No change was observed for miR-30c-2-3p and expression of miR-340-5p and miR-378b were increased (Fig. 2d), again indicating that the altered expression of these miRNAs is not a reproducible hallmark of mutant p53 expression in isolated tumour-derived cells. As there is no wild-type p53 expressed in these cells for the mutant p53R175H to act upon in a dominant-negative manner, this strongly suggests that miR-142-3p is being downregulated due to the gain-of-function activity of this mutant. In addition, these data show that the human orthologue of the TP53 mutant is also able to affect the expression of miR-142-3p.
Dnmt1 is dysregulated by mutant p53R172H in PDAC
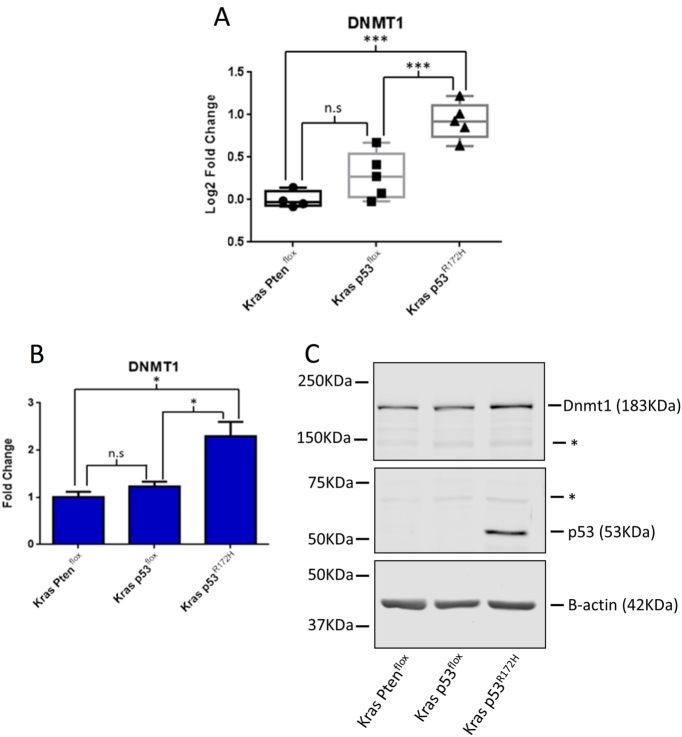
Our investigations of the PDAC models did not uncover any global changes in mature miRNA expression, so we focused on regulatory mechanisms pertaining to the specific dysregulation of miR-142-3p expression. Since DNA methylation has been found to be both upregulated30–33 and downregulated34–36; in a number of cancer types including PDAC, we reasoned that dysregulated methylation may be responsible for the observed changes in miR-142-3p expression. Dnmt1 mRNA expression was investigated in the primary tumour tissue from the PDAC models and was found to be elevated in tumours from the Kras p53R172H tissues compared to both Kras p53flox and Kras Ptenflox tissues (Fig. 3a). Dmnt1 mRNA (Fig. 3b) and protein (Fig. 3c) were also found to be upregulated in the Kras p53R172H cell line compared to both the Kras p53flox and Kras Ptenflox cell lines.
Fig. 3. Protein and mRNA expression of Dnmt1 in PDAC mouse models.
a RT-qPCR of Dnmt1 mRNA abundance in primary mouse tissues. The ΔΔCT method was used to calculate fold change using β-actin as the reference gene with the fold change being relative to the Kras Ptenflox samples. The * represent non-specific bands of unknown origin. b RT-qPCR of Dnmt1 expression in primary cell lines. The ΔΔCT method was used to calculate fold change with β-actin as the reference gene with fold change normalised to the Kras Ptenflox cell line. The result represents the mean of three biological repeats with the error bars representing the maximum relative quantity. A two-sample, two-tailed, paired t-test was used to compare the ΔCT values from each group. Statistical significance is represented as *p < 0.05 and ***p < 0.005. c A representative western blot showing the expression of Dnmt1, Pten, p53 and β-actin in the primary cell lines
MiR-142-3p expression can be rescued by inhibition of methylation
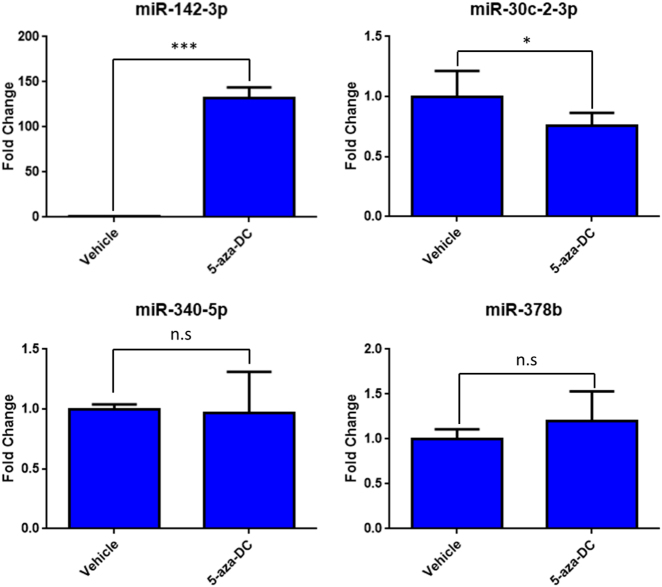
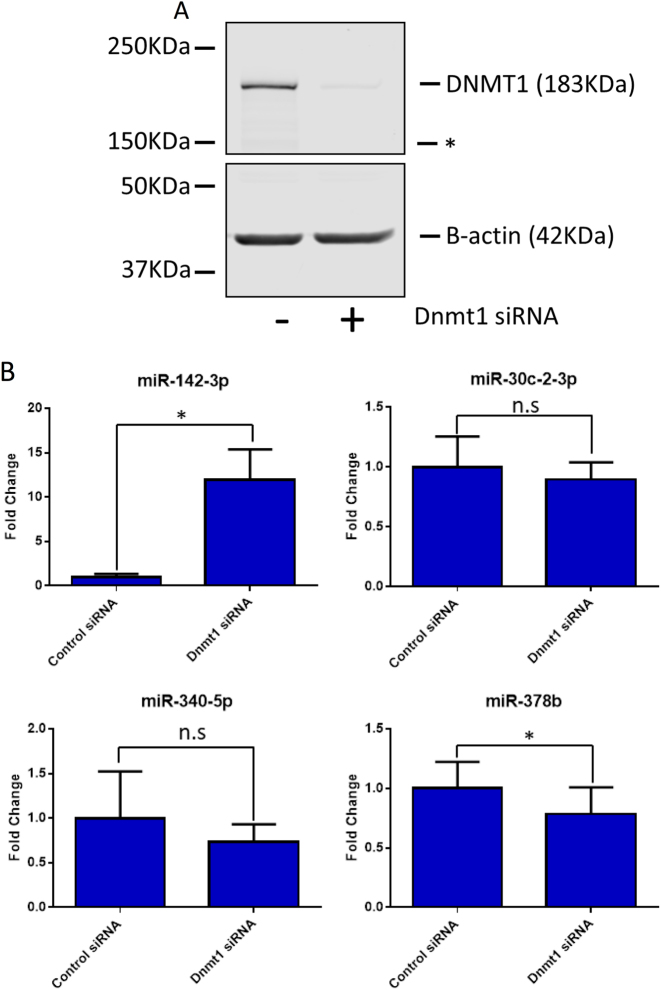
As we observed an inverse correlation between miR-142-3p and Dnmt1 expression, we asked if inhibiting DNA methylation had an impact on miR-142-3p expression levels. We utilised 5-aza-2-deoxycytidine (5-aza-DC), which inhibits DNMT1, DNMT3A and DNMT3B by being incorporated into nascent DNA, where it cross links with DNMT protein family members, sequestering them and reducing global methylation37. Treatment of the Kras p53R172H cell line for 24 h with 1 μM of 5-aza-DC led to a significant induction of miR-142-3p while having no effect on the expression of other miRNAs investigated in this study (Fig. 4). As 5-aza-DC is a functional inhibitor of all members of the DNMT family38, we asked if specific inhibition of Dnmt1 was also able to affect miR-142-3p expression. As in the case of 5-aza-DC treatment, expression of miR-142-3p was significantly increased following depletion of Dnmt1 in the Kras p53R172H cell line (Fig. 5a, b). The other miRNAs under investigation showed mild to no change in expression following Dnmt1 depletion, demonstrating selectivity for miR-142-3p.
Fig. 4. Expression of microRNAs following treatment with 5-aza-deoxycytidine.
The Kras p53R172H/+ cell line was treated with 1 µm 5-aza-deoxycytidine (5-aza-Dc) or an equal volume of a vehicle control (DMSO) for 24 h. The expression of the microRNAs identified as dysregulated in p53R172H-expressing tissues was quantified by RT-qPCR with U6 snRNA as the reference gene. The result represents the average of three biological repeats with the error bars representing the maximum relative quantity. A two-sample, two-tailed, paired t-test was used to compare the ΔCT values from each group. Statistical significance is represented as *p < 0.05 and ***p < 0.005
Fig. 5. Expression of microRNAs following depletion of Dnmt1.
The Kras p53R172H cell line was treated with 20 nM DNMT1 siRNA or a control siRNA for 48 h. a A representative western blot showing the expression of Dnmt1 and p53 following Dnmt1 depletion with β-actin as a loading control. The * represents a non-specific band of unknown origin. b The expression of the microRNAs dysregulated in p53R172H-expressing tissues was quantified after Dnmt1 depletion by RT-qPCR with U6 snRNA as the reference gene. The result represents the mean of three biological repeats with error bars representing the maximum relative quantity. A two-sample, two-tailed, paired t-test was used to compare the ΔCT values from each group. Statistical significance is represented as *p < 0.05
The miR-142 genomic locus is hypermethylated in mutant p53R172H-expressing primary cell lines
As direct depletion of Dnmt1 and a methylation-inhibiting drug were both shown to induce miR-142-3p expression, direct analysis of CpG dinucleotides in the miR-142 genomic locus was carried out. A CpG island which overlaps the miR-142 genomic locus was identified using Methyl Primer Express software (Applied Biosystems, Waltham, MA, USA) (Fig. 6). Bisulphite sequencing of a 378 bp fragment of the CpG island was carried out using DNA from both the Kras p53flox and Kras p53R172H cell lines and clearly showed high levels of methylation of this region in both cell lines. Importantly, a statistically significant increase in methylation was observed in the fragment from the Kras p53R172H cell line (Fig. 6).
Fig. 6. Bisulphite sequencing reveals increased methylation around the miR-142 genomic locus in the Kras p53R172H cell line.
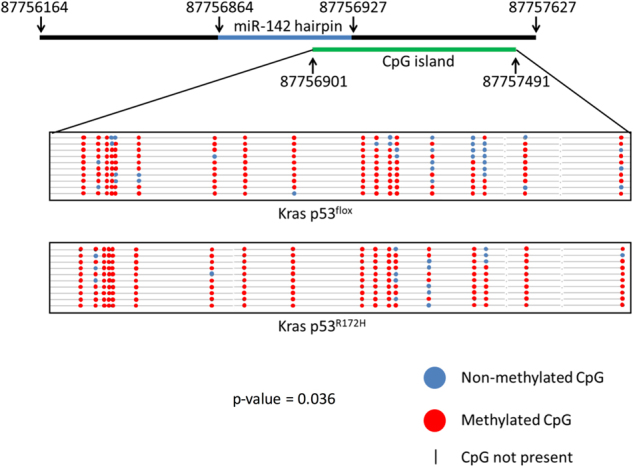
a 378 bp fragment of a CpG island which contains 18 CpGs and overlaps the miR-142 genomic locus was amplified and investigated using bisulphite sequencing. A schematic shows the location of the CpG island. The lollipop plot shows the location of the CpGs with black spots representing methylated CpGs and white spots representing non-methylated CpGs (a). A two-tailed Mann–Whitney U-test was used to assess for statistically significant differences between the two bisulphite sequencing groups
Overexpression of miR-142-3p inhibits p53R172H-driven invasion in vitro
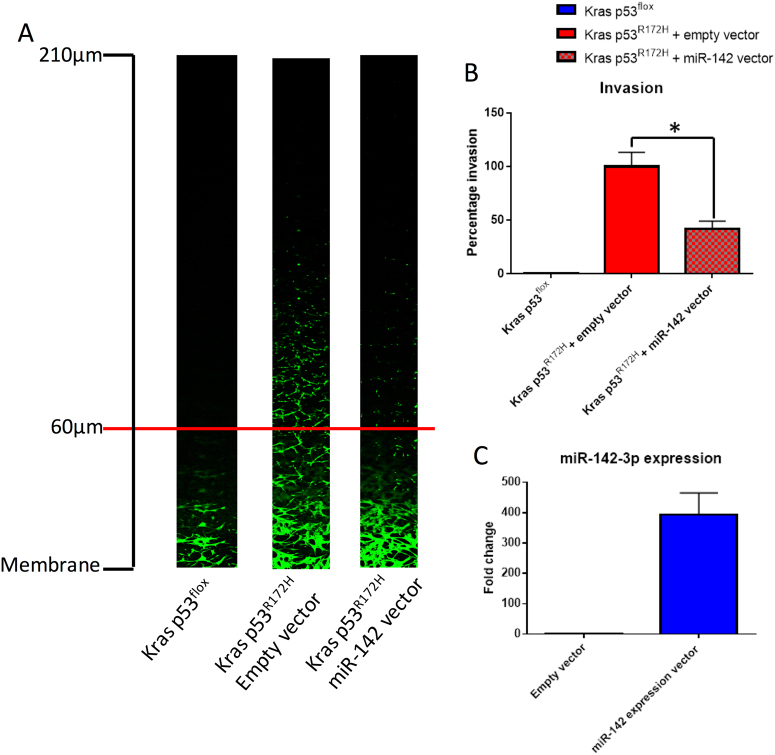
Given that mutant p53R172H has been shown to drive invasion and metastasis in PDAC6, we investigated the impact of overexpression of miR-142-3p on cell invasion. Using reverse transwell invasion assays6, we confirmed that Kras p53flox cells have almost no invasive ability while Kras p53R172H cells are invasive (Fig. 7a, b). This is in line with previously published data6. Importantly, overexpression of miR-142-3p in the Kras p53R172H cells leads to a significant reduction in the invasive potential of these cells in vitro (Fig. 7a–c).
Fig. 7. miR-142-3p overexpression inhibits mutant p53-driven invasion in vitro.
a Representative Z-stack images from reverse transwell invasion assays. Kras p53flox (n = 2), Kras p53R172H + empty vector (n = 4) and Kras p53R172H + miR-142 expression vector (n = 4) mouse primary PDAC cells were analysed for their invasive potential. Cells were considered invasive if they migrated further than 60 μm. b Quantification of invasion by measuring the fluorescence of cells past 60 μm relative to the total fluorescence of each stack. Each experimental repeat consisted of two transwells each with three Z-stacks per transwell. The percentage invasion is reported relative to the Kras p53R172H cells transfected with an empty vector. Error bars represent the pooled standard deviation for each condition. A two-sample, two-tailed, paired t-test was used to compare the average percentage of invasion between biological repeats (n = 4) for Kras p53R172H + empty vector and Kras p53R172H + miR-142-3p expression vector. Statistical significance is represented as *p < 0.05. c The average change in miR-142-3p expression in cells transfected with the miR-142-3p expression vector compared to cells transfected with empty vector. Error bars represent the standard deviation
Low miR-142-3p expression and high DNMT1 expression correlate with poor survival in human cancers
The data we present here identify a novel mechanism by which mutant p53R172H is able to decrease expression of miR-142-3p in a mouse model of PDAC, through genomic hypermethylation due to increased expression of DNMT1. Therefore, we wished to determine whether miR-142-3p or DNMT1 expression correlates with human patient survival.
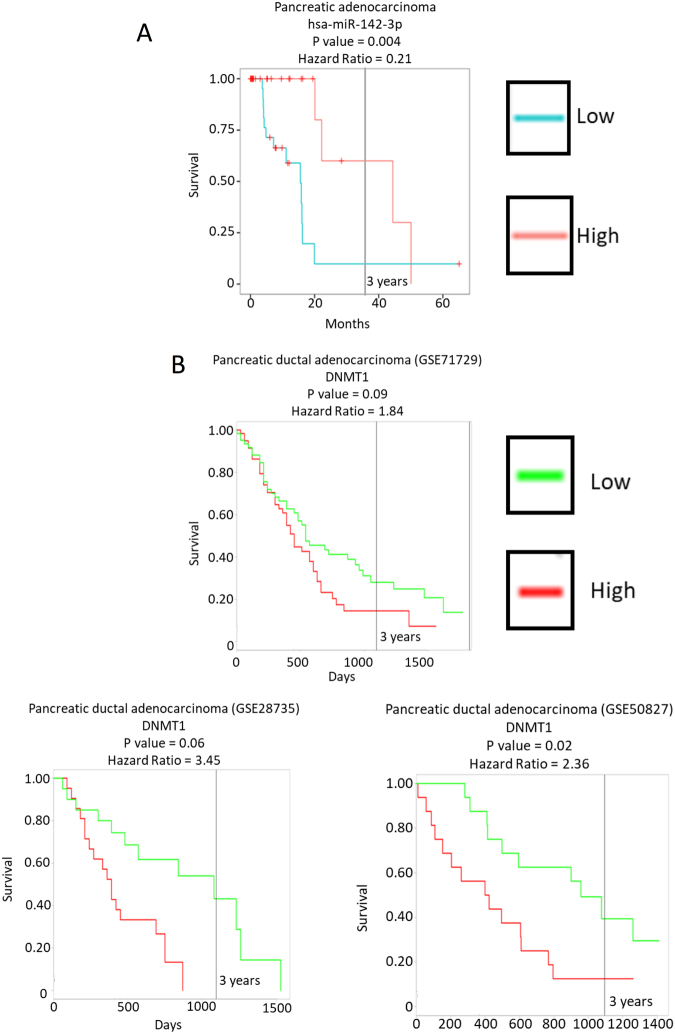
Bioinformatic analysis using the YM500v3 database allowed us to examine 8000 small RNA sequencing data sets and correlate survival statistics associated with their expression39. This revealed a strong correlation between poor survival and low miR-142-3p expression in human PDAC (Fig. 8a). The ProGENEV2 database40 was used to investigate any correlation between DNMT1 expression and patient survival in PDAC. This revealed that high DNMT1 mRNA expression correlates with poor survival in human PDAC patients (Fig. 8b).
Fig. 8. Low miR-142-3p and high DNMT1 correlate with a poor prognosis in human PDAC.
a The data set in the YM500v3 database shows a clear correlation between low miR-142-3p expression and poor survival in human PDAC. b The ProGENEV2 database was interrogated for correlations between DNMT1 expression and human PDAC patient survival. All data sets which show a statistically significant correlation are reported, all of which show a correlation between high DNMT1 expression and poor patient survival
Discussion
Three mouse models of PDAC were used in this study: two in which metastasis occurs only at low-frequency Kras p53flox and Kras Ptenflox, and Kras p53R172H, in which metastasis occurs at high frequency. Murine primary pancreatic tumour tissues and primary cell lines, as well as ectopic expression of human mutant p53R175H in TP53 null cells, all showed that miR-142-3p is downregulated in mutant p53R172H or p53R175H-expressing PDAC.
A recent study found that miR-142-3p is downregulated in human PDAC when compared to paired adjacent normal tissue and in pancreatic cancer cell lines, and showed that hypoxia-inducible factor (HIF1α) is a direct target of miR-142-3p in PDAC29. High HIF1α expression leads to increased proliferation and invasion of tumour cells as well as inducing expression of genes involved in EMT, such as vimentin, VEGF and E-cadherin. Meanwhile, low expression of miR-142-3p correlated with an increased incidence in lymphatic metastasis. These results taken together with our findings identify both direct and downstream secondary targets by which miR-142-3p functions in human patients and link its expression to invasion and metastasis. Additionally, two recent studies have shown that increasing miR-142-3p expression in acute myelogenous leukaemia41 and non-small cell lung cancer42 improves chemosensitivity by decreasing autophagy due to translational repression of HMGB1. However, the previously published data does not connect dysregulation of miR-142-3p to gain-of-function mutations in TP53 nor does it identify a mechanism by which miR-142-3p is dysregulated. Our data clearly show that the expression of this miRNA is indirectly inhibited by mutant p53R172H via genomic methylation due to increased expression of DNMT1.
Our study also found that mutant p53R172H elevates the expression of Dnmt1 in PDAC. This is in line with previous data, which has found DNMT1 to be upregulated in both PanIN lesions and PDACs43,44. Our data show that Dnmt1 mRNA is upregulated in mutant p53R172H-expressing tissues and cell lines, suggesting an increase in transcription rate or stabilisation of the Dnmt1 transcript. DNMT1 has been shown to be a transcriptional target of specificity protein 1 & 3 (SP1 & 3)45. A complex formed between SP1 and wild-type TP53 has been shown to bind the promoter of DNMT1 and repress its transcription46. Mutant p53 is able to inhibit this complex resulting in upregulation of DNMT1 in lung cancer patients46. It is possible that the same mechanism is inducing Dnmt1 transcription in this PDAC model, leading to subsequent hypermethylation of miR-142-3p.
Previous findings of the impact of miR-142-3p on tumour progression along with the data presented in this study, linking mutant p53R172H and DNMT1 expression, suggest that DNMT1 may be a potential therapeutic target in PDAC. However, demethylating drugs have been shown to have limited clinical efficacy. 5-aza-deoxycytidine has previously been considered in cancer treatment but was shown to be highly toxic47, though more recent studies using low dosage of 5-aza-deoxycytidine have demonstrated some clinical efficacy in haematological malignancies and myelodysplastic syndrome48–52. A previous study showed that treatment with 5-aza-deoxycytidine in PDAC leads to upregulation of tumour suppressors, but also increased expression of oncogenes which promote metastasis53, limiting its use as a therapeutic agent. Interestingly, specifically ablating DNMT1 promotes expression of tumour suppressor genes but does not have the undesirable effect of promoting expression of oncogenes54. A number of drugs which directly target DNMT1 are currently in development, though most show limited therapeutic value55. One interesting drug is minnelide, a pro-drug of triptolide. Triptolide has been shown to be efficacious in treatment of PDAC through induction of miR-142-3p56. Another study has shown that triptolide is able to negatively regulate DNMT1 transcription, leading to increased expression of methylated genes57. These findings are very much in line with our data which show that Dnmt1 inhibition increases miR-142-3p expression and that increasing miR-142-3p expression reduces the invasive potential of tumour cells. This may suggest that triptolide may be specifically useful in treatment of mutant TP53-expressing PDACs.
The data presented in this study identifies a potential new mechanism by which mutant p53R172H is able to affect gene expression in a gain-of-function manner, through increased expression of DNMT1 which in turn leads to hypermethylation of miR-142-3p and perhaps other genes. These results open up the possibilities for therapeutic targeting of methylation in mutant p53R172H expressing PDACs and other tumour types.
Methods
Mouse models
All mouse models have been previously described5,6,11,58. Experiments were performed under Home Office licence and approved by the University of Glasgow ethics committee. Mice on a mixed background were maintained in conventional cages with environmental enrichment on a light-dark cycle and given access to standard diet and water ad libitum. Genotyping was performed by Transnetyx (Cordoba, TN, USA). Mice were monitored at least three times weekly and culled when exhibiting symptoms of PDAC (swollen abdomen, loss of body conditioning reminiscent of cachexia, jaundice, hunching and immobility). PDAC tissue was collected and stored at −80 °C in RNAlater (Ambion, Foster City, CA, USA) until RNA extraction. PDAC cell lines from these models were isolated and grown in house as described previously6,58.
RNA extraction
Tissues were thawed on ice in the presence of RNAlater. Once thawed, tissues were snap frozen in liquid N2 and pulverised in a pestle and mortar before 1 ml of TRIzol (Thermo Fisher Scientific, Waltham, MA, USA) reagent per 1 mg of tissue was added. Chloroform (200 μl per 1 ml of TRIzol) was then added and the sample was centrifuged at 12,000 × g for 15 min and the aqueous layer was removed. Isopropanol (750 μl per 1 ml of TRIzol) was then added and the sample was precipitated overnight at −20 °C. RNA was resuspended in ddH2O and an equal volume of acid phenol/chloroform (50:50) was added. The sample was centrifuged at 12,000 × g and the aqueous layer was removed before sodium acetate (10% of final volume) and ethanol (250% of final volume) was added and the sample was precipitated at −20 overnight. Samples were resuspended in a suitable volume of ddH2O and were quantified using a nanodrop spectrophotometer (Thermo Fisher Scientific).
MiRNA microarrays
Agilent miRNA microarrays were carried out as per the manufacturer’s instruction using the Agilent miRNA microarray labelling kit (Agilent, Santa Clara, CA, USA). In brief, 100 ng of total RNA from each PDAC tumour tissues was dephosphorylated and labelled with Cy3-pCp using T4 RNA ligase. The labelled RNA for each sample was then applied to one of the eight miRNA microarrays on each slide and sealed with a gasket cover, before being placed in a hybridisation oven at 55 °C for 20 h while rotating at 20 rpm. The labelled microarrays were scanned using the Agilent G2565CA microarray scanner and the features were defined and extracted using Agilent feature extraction software (version 11.0) using default settings. All fold change and statistical analysis was carried out using Genespring (Agilent). All non-mouse miRNAs were removed from the analysis along with any miRNA, which was not detected in all samples from at least one condition. Statistical analysis was carried out using a one-way ANOVA with a false discover rate (FDR) p value of 0.05 and post hoc analysis using Tukey’s honest significant difference test (HSD).
Taqman RT-qPCR
RT-qPCR of miRNAs was carried out using Taqman miRNA assays (Applied Biosystems) as per the manufacturer’s instruction. In brief, 100 ng of total RNA was reverse transcribed using the TaqMan miRNA reverse transcription kit (Applied Biosystems). RT-qPCR was achieved using the Applied Biosystems 7500 RT-qPCR thermocycler under default conditions. The following Taqman assays were used in this study: U6 – 001973, miR-142-3p – 000464, miR-30c-2-3p – 002110, miR-340-5p – 002258 and miR-378b – 465314_mat.
SYBR green RT-qPCR
Reverse transcription for RT-qPCR of mRNAs was achieved using Superscript 3 (Invitrogen) reverse transcriptase and random primers as per the manufacturer’s instruction. Aliquot of 100 ng of total RNA was used for each reaction. The following primers were used in this study: Dnmt1 forward – GTGCTCTCACCCAGAGCCCC,Dnmt1 reverse – GGGTGCTTGACAGAAGCGCT, β-actin forward – GTGGACAGTGAGGCCAGGAT, β-actin reverse – GATTACTGCTCTGGCTCCTAGCA.
Bisulphite sequencing
DNA was extracted from Kras p53flox and Kras p53R172H cell lines using the DNeasy blood and tissue kit (Qiagen, Venlo, the Netherlands) as per the manufacturer’s instruction. DNA was treated with sodium bisulphite using the EpiTect plus DNA bisulphite kit (Qiagen) as per the manufacture’s instruction. Following bisulphite conversion, DNA was washed and eluted from a MinElute DNA spin column. Methyl primer Express software (Applied Biosystems) was used to interrogate a sequence of DNA 700 bp both up and downstream of the miR-142 precursor sequence. Using the definition of a CpG island as a sequence with a CpG observed/expected ratio >0.6, a 590 bp CpG island was observed overlapping the miR-142-3p precursor sequence. Primers were designed to amplify a 378 bp fragment of the CpG island which contained 18 CpG dinucleotides.
PCR was carried out using EpiMark Hot Start Taq DNA Polymerase (NEB) using the following primers: forward – TGGATGAGTGTATTGTGGGT and reverse – AACCCCAATAACAAAATCAAAC as per the manufacturer’s instruction. The resulting fragment was size excluded on an agarose gel and extracted, before being ligated into pGEM-T Easy (Promega, Madison, WI, USA). The resulting ligation was transformed into DH5α competent cells and selected using blue white screening. A total of ten white colonies were selected and amplified for each Kras p53flox and Kras p53R172H cell line. DNA from the amplified colonies was prepared using Wizard Plus SV Miniprep kit (Promega) and Sanger sequenced using T7 and SP6 primers. A consensus sequence was then created using SeqTrace59. Consensus sequences were edited to remove and sequence corresponding to the pGEM-T Easy backbone using BioEdit60. The sequences were then compared to the genomic sequence of the CpG island using BiQ Analyzer61. Samples were accepted as individual if they had at least one non-CpG cytosine residue independent of the other samples. Samples were only accepted if they had a conversion efficiency of >95% judged by abundance of non-CpG cytosine residues.
SDS-PAGE and western blotting
Cells were lysed in radioimmunoprecipitation assay buffer (RIPA) (50 mM Tris, 150 mM NaCl, 0.1% SDS, 0.5% sodium deoxycholate, 1% NP-40) supplemented with Complete Protease Inhibitor Cocktail Tablets (Roche, Basel, Switzerland) immediately prior to use. The antibodies used in this study were: β-actin (Sigma, 20-33), PTEN (Cell Signalling, 9552), p53 (Abcam, ab240) and DNMT1 (Cell Signalling, D63A6). Images were revealed using the LI-COR infra-red imager using LI-COR infra-red secondary antibodies.
Cell culture
All cell lines were grown in DMEM (Gibco, Waltham, MA, USA) supplemented with 10% Foetal bovine serum (FBS), L-glutamine (20 mM) and penicillin/streptomycin (50 ug/ml). The TP53 null cell lines with stable ectopic expression of mutant p53R175H were additionally supplemented with G418 (400 μg/ml). All cell lines were grown in a humidified cell culture incubator with 20% O2 and 5% CO2 at 37 °C.
siRNA transfection
All siRNA transfections were achieved using Dharmafect 1 transfection reagent as directed by the manufacturer’s instruction. Both DNMT1 (4390771) and control (4390844) siRNAs were purchased from the Silencer Select range of validated siRNAs (Thermo Fisher Scientific). A final concentration of 20 nM siRNA was used for all siRNA transfections. Both RNA and protein lysate were collected 48 h post transfection.
5-aza-Deoxycitidine treatment
Cells were treated with 1 nM 5-aza-deoxycitidine or an equivalent volume of vehicle (DMSO) for 48 h before being collected for analysis.
Reverse Invasion assays
60 μl of Matrigel was placed into cell culture transwell inserts and incubated at 37 °C with 5% CO2 for 1 h in 12 well plates. The inserts were inverted and 100 μl of a 350,000 cells/ml suspension was applied to the membrane. Plates were incubated at 37 °C with 5% CO2, inverted, for 5 h to allow adherence. The plates were then reverted and the inserts were washed twice in serum free DMEM, before being placed into fresh wells containing 1 ml of serum free media. 100 μl of media with 10% serum and 10 ng/ml Hepatocyte Growth Factor (HGF) was then placed into the transwell and the cells were incubated at 37 °C and 5% CO2 for 48 h. Cells were stained in 4 nM Calciene for 1 h before being imaged using a confocal microscope.
Non-invasive cells were removed from the base of the membrane, before the transwell was placed onto a large coverslip on the stage of a confocal microscope. Z-stacks were taken from the inner surface of the membrane at intervals of 15 μm with a total of 15 images being taken. The same positions were used for each transwell in order to reduce user bias. Each experimental repeat consisted of 2 transwells per condition with 3 Z-stacks being taken per transwell.
Fluorescence for each image of a stack was quantified using ImageJ. A fluorescent signal of cells past 60 μm was considered invasive. The percentage of fluorescent signal past 60 μm was calculated as a percentage of the total fluorescent signal for each stack, and an average percentage of invasion was calculated for each transwell. Statistical analysis was carried out using a two-sample, two-tailed, paired t-test, comparing the average invasion of each transwell in a condition (n = 4). Conditions with overexpression of miR-142-3p included a preceding day, where cells were transfected with either an empty vector or one containing the miR-142 primary microRNA sequence. Transfected cells not used for the invasion assay were used to quantify the degree of miR-142-3p overexpression using Taqman assays.
Analysis of human patient survival
The YM500v3 database was interrogated to see how miR-142-3p expression correlated with human patient survival. A single PDAC data set was used for the analysis. The ProGENEV2 database was used to investigate the effect of DNMT1 expression on human patient survival. Of the six PDAC data sets available, three (GSE28735, GSE50827 and GSE71729) had a p value of <0.1 and all correlations found that high DNMT1 mRNA expression correlates with poor survival.
Electronic supplementary material
Acknowledgements
J.D.G., A.W. and M.D.B. were funded by the Medical Research Council, UK. J.P.M. and O.J.S. were core funded by Cancer Research UK (A12481, A11650 and A17196).
Conflict of interest
The authors declare that they have no conflict of interest.
Footnotes
Edited by G. RaschellÃ
Electronic supplementary material
Supplementary Information accompanies this paper at (10.1038/s41419-018-0628-4).
Publisher's note: Springer Nature remains neutral with regard to jurisdictional claims in published maps and institutional affiliations.
References
- 1.Siegel RL, Miler KD, Jemal A. Cancer statistics, 2017. CA Cancer J. Clin. 2017;67:7–30. doi: 10.3322/caac.21387. [DOI] [PubMed] [Google Scholar]
- 2.Chari ST. Detecting early pancreatic cancer - problems and prospects. Semin. Oncol. 2007;34:284–294. doi: 10.1053/j.seminoncol.2007.05.005. [DOI] [PMC free article] [PubMed] [Google Scholar]
- 3.Morris JP, Wang SC, Hebrok M. KRAS, hedgehog, Wnt and the twisted developmental biology of pancreatic ductal adenocarcinoma. Nat. Rev. Cancer. 2010;10:683–695. doi: 10.1038/nrc2899. [DOI] [PMC free article] [PubMed] [Google Scholar]
- 4.Hingorani SR, et al. Preinvasive and invasive ductal pancreatic cancer and its early detection in the mouse. Cancer Cell. 2003;4:437–450. doi: 10.1016/S1535-6108(03)00309-X. [DOI] [PubMed] [Google Scholar]
- 5.Hingorani SR, et al. Trp53R172H and KrasG12D cooperate to promote chromosomal instability and widely metastatic pancreatic ductal adenocarcinoma in mice. Cancer Cell. 2005;7:469–483. doi: 10.1016/j.ccr.2005.04.023. [DOI] [PubMed] [Google Scholar]
- 6.Morton JP, et al. Mutant TP53 drives metastasis and overcomes growth arrest/senescence in pancreatic cancer. Proc. Natl Acad. Sci. USA. 2010;107:246–251. doi: 10.1073/pnas.0908428107. [DOI] [PMC free article] [PubMed] [Google Scholar]
- 7.Aguirrea AJ, et al. Activated KRAS and INK4a/ARF deficiency cooperate to produce metastatic pancreatic ductal adenocarcinoma. Genes Dev. 2003;17:3112–3126. doi: 10.1101/gad.1158703. [DOI] [PMC free article] [PubMed] [Google Scholar]
- 8.Ijichi H, et al. Aggressive pancreatic ductal adenocarcinoma in mice caused by pancreas-specific blockade of transforming growth factor-beta signalling in cooperation with active KRAS expression. Genes Dev. 2006;20:3147–3160. doi: 10.1101/gad.1475506. [DOI] [PMC free article] [PubMed] [Google Scholar]
- 9.Kojima K, et al. Inactivation of SMAD4 accelerates KRASG12D-mediated pancreatic neoplasia. Cancer Res. 2007;67:8121–8130. doi: 10.1158/0008-5472.CAN-06-4167. [DOI] [PubMed] [Google Scholar]
- 10.Hill R, et al. PTEN loss accelerates K-RASG12D-induced pancreatic cancer development. Cancer Res. 2010;70:7114–7124. doi: 10.1158/0008-5472.CAN-10-1649. [DOI] [PMC free article] [PubMed] [Google Scholar]
- 11.Kennedy AL, et al. Activation of the PIK3CA/AKT pathway suppresses senescence induced by an activated RAS oncogene to promote tumorigenesis. Mol. Cell. 2011;42:36–49. doi: 10.1016/j.molcel.2011.02.020. [DOI] [PMC free article] [PubMed] [Google Scholar]
- 12.Li D, Xie K, Wolff R, Abbruzzese JL. Pancreatic cancer. Lancet. 2004;363:1049–1057. doi: 10.1016/S0140-6736(04)15841-8. [DOI] [PubMed] [Google Scholar]
- 13.Cho Y, Gorina S, Jeffrey PD, Pavletich NP. Crystal structure of a TP53 tumor suppressor-DNA complex: understanding tumorigenic mutations. Science. 1994;265:346–355. doi: 10.1126/science.8023157. [DOI] [PubMed] [Google Scholar]
- 14.Joerger AC, Fersht AR. Structural biology of the tumor suppressor TP53 and cancer-associated mutants. Adv. Cancer Res. 2007;2007:1–23. doi: 10.1016/S0065-230X(06)97001-8. [DOI] [PubMed] [Google Scholar]
- 15.Asano T, et al. The PI3-kinase/AKT signalling pathway is activated due to aberrant PTEN expression and targets transcription factors NF-kappaB and c-MYC in pancreatic cancer cells. Oncogene. 2004;23:8571–8580. doi: 10.1038/sj.onc.1207902. [DOI] [PubMed] [Google Scholar]
- 16.Weissmueller S, et al. Mutant TP53 drives pancreatic cancer metastasis through cell-autonomous PDGF receptor β signalling. Cell. 2014;157:382–394. doi: 10.1016/j.cell.2014.01.066. [DOI] [PMC free article] [PubMed] [Google Scholar]
- 17.Subramanian M, et al. A mutant TP53/let-7i-axis-regulated gene network drives cell migration, invasion and metastasis. Oncogene. 2015;34:1094–1104. doi: 10.1038/onc.2014.46. [DOI] [PMC free article] [PubMed] [Google Scholar]
- 18.Li Z, et al. Cdkn2a suppresses metastasis in squamous cell carcinomas induced by the gain-of-function mutant TP53(R172H) J. Pathol. 2016;240:224–234. doi: 10.1002/path.4770. [DOI] [PMC free article] [PubMed] [Google Scholar]
- 19.Suzuki HI, et al. Modulation of miRNA processing by TP53. Nature. 2009;460:529–533. doi: 10.1038/nature08199. [DOI] [PubMed] [Google Scholar]
- 20.Garibaldi F, et al. Mutant TP53 inhibits miRNA biogenesis by interfering with the microprocessor complex. Oncogene. 2016;35:3760–3770. doi: 10.1038/onc.2016.51. [DOI] [PubMed] [Google Scholar]
- 21.Martello G, et al. A microRNA targeting dicer for metastasis control. Cell. 2010;141:1195–1207. doi: 10.1016/j.cell.2010.05.017. [DOI] [PubMed] [Google Scholar]
- 22.Han L, et al. Downregulation of Dicer enhances tumor cell proliferation and invasion. Int. J. Oncol. 2010;37:299–305. doi: 10.3892/ijo_00000678. [DOI] [PubMed] [Google Scholar]
- 23.Muller PA, Trinidad AG, Caswell PT, Norman JC, Vousden KH. TP53 regulates Dicer through p63-dependent and -independent mechanisms to promote an invasive phenotype. J. Biol. Chem. 2014;289:122–132. doi: 10.1074/jbc.M113.502138. [DOI] [PMC free article] [PubMed] [Google Scholar]
- 24.Su X, et al. TAp63 suppresses metastasis through coordinate regulation of Dicer and miRNAs. Nature. 2010;467:986–990. doi: 10.1038/nature09459. [DOI] [PMC free article] [PubMed] [Google Scholar]
- 25.Stindt MH, et al. Functional interplay between MDM2, p63/p73 and mutant TP53. Oncogene. 2015;34:4300–4310. doi: 10.1038/onc.2014.359. [DOI] [PMC free article] [PubMed] [Google Scholar]
- 26.Dong P, et al. Mutant TP53 gain-of-function induces epithelial–mesenchymal transition through modulation of the miR-130b–ZEB1 axis. Oncogene. 2013;32:3286–3295. doi: 10.1038/onc.2012.334. [DOI] [PMC free article] [PubMed] [Google Scholar]
- 27.Wilczynska A, Bushel M. The complexity of miRNA-mediated repression. Cell Death Differ. 2015;22:22–33. doi: 10.1038/cdd.2014.112. [DOI] [PMC free article] [PubMed] [Google Scholar]
- 28.Jamieson, et al. MiRNA molecular profiles associated with diagnosis, clinicopathologic criteria, and overall survival in patients with resectable pancreatic ductal adenocarcinoma. Clin. Cancer Res. 2012;18:534–545. doi: 10.1158/1078-0432.CCR-11-0679. [DOI] [PubMed] [Google Scholar]
- 29.Lu Y, et al. MiR-142 modulates human pancreatic cancer proliferation and invasion by targeting hypoxia-inducible factor 1 (HIF-1α) in the tumor microenvironments. Biol. Open. 2017;6:252–259. doi: 10.1242/bio.021774. [DOI] [PMC free article] [PubMed] [Google Scholar]
- 30.Zochbauer-Muller S, Minna JD, Gazdar AF. Aberrant DNA methylation in lung cancer: biological and clinical implications. Oncologist. 2002;7:451–457. doi: 10.1634/theoncologist.7-5-451. [DOI] [PubMed] [Google Scholar]
- 31.Kim MS, Lee J, Sidransky D. DNA methylation markers in colorectal cancer. Cancer Metastasis Rev. 2010;29:181–206. doi: 10.1007/s10555-010-9207-6. [DOI] [PubMed] [Google Scholar]
- 32.Kuroki T, Tajima Y, Kanematsu T. Role of hypermethylation on carcinogenesis in the pancreas. Surg. Today. 2004;34:981–986. doi: 10.1007/s00595-004-2858-6. [DOI] [PubMed] [Google Scholar]
- 33.Rozenblum E, et al. Tumour-suppressive pathways in pancreatic carcinoma. Cancer Res. 1997;57:1731–1734. [PubMed] [Google Scholar]
- 34.Pakneshan P, Szyf M, Farias-Eisner R, Rabbani SA. Reversal of the hypomethylation status of urokinase (uPA) promoter blocks breast cancer growth and metastasis. J. Biol. Chem. 2004;279:31735–31744. doi: 10.1074/jbc.M401669200. [DOI] [PubMed] [Google Scholar]
- 35.Stefanska B, et al. Definition of the landscape of promoter DNA hypomethylation in liver cancer. Cancer Res. 2011;71:5891–5903. doi: 10.1158/0008-5472.CAN-10-3823. [DOI] [PubMed] [Google Scholar]
- 36.Shukeir N, Pakneshan P, Chen G, Szyf M, Rabbani SA. Alteration of the methylation status of tumour-promoting genes decreases prostate cancer cell invasiveness and tumorigenesis in vitro and in vivo. Cancer Res. 2006;66:9202–9210. doi: 10.1158/0008-5472.CAN-06-1954. [DOI] [PubMed] [Google Scholar]
- 37.Juttermann R, Li E, Jaenisch R. Toxicity of 5-aza-2′-deoxycytidine to mammalian cells is mediated primarily by covalent trapping of DNA methyltransferase rather than DNA demethylation. Proc. Natl Acad. Sci. USA. 1994;1994:11797–11801. doi: 10.1073/pnas.91.25.11797. [DOI] [PMC free article] [PubMed] [Google Scholar]
- 38.Oka M, et al. De novo DNA methyltransferases Dnmt3a and Dnmt3b primarily mediate the cytotoxic effect of 5-aza-2’-deoxycytidine. Oncogene. 2005;24:3091–3099. doi: 10.1038/sj.onc.1208540. [DOI] [PubMed] [Google Scholar]
- 39.Chung IF, et al. YM500v3: a database for small RNA sequencing in human cancer research. Nucleic Acids Res. 2017;45:925–931. doi: 10.1093/nar/gkw1084. [DOI] [PMC free article] [PubMed] [Google Scholar]
- 40.Goswami, C. P. & Nakshatri, H. PROGgeneV2: enhancements on the existing database. BMC Cancer17, 10.1186/1471-2407-14-970 (2014). [DOI] [PMC free article] [PubMed]
- 41.Zhang Y, Lui Y, Xu X. Upregulation of miR-142-3p improves drug sensitivity of acute myelogenous leukemia through reducing P-glycoprotein and repressing autophagy by targeting HMGB1. Transl. Oncol. 2017;10:410–418. doi: 10.1016/j.tranon.2017.03.003. [DOI] [PMC free article] [PubMed] [Google Scholar]
- 42.Chen Y, Zhou X, Qiao J, Bao A. MiR-142-3p overexpression increases chemo-sensitivity of NSCLC by inhibiting HMGB1-mediated autophagy. Cell Physiol. Biochem. 2017;41:1370–1382. doi: 10.1159/000467896. [DOI] [PubMed] [Google Scholar]
- 43.Peng DF, et al. Increased DNA methyltransferase 1 (DNMT1) protein expression in precancerous conditions and ductal carcinomas of the pancreas. Cancer Sci. 2005;96:403–408. doi: 10.1111/j.1349-7006.2005.00071.x. [DOI] [PMC free article] [PubMed] [Google Scholar]
- 44.Wang W, Gao J, Man XH, Li ZS, Gong YF. Significance of DNA methyltransferase-1 and histone deacetylase-1 in pancreatic cancer. Oncol. Rep. 2009;21:1439–1447. doi: 10.3892/or_00000372. [DOI] [PubMed] [Google Scholar]
- 45.Kishikawa S, Murata T, Kimura H, Shiota K, Yokoyama KK. Regulation of transcription of the Dnmt1 gene by Sp1 and Sp3 zinc finger proteins. Eur. J. Biochem. 2002;269:2961–2970. doi: 10.1046/j.1432-1033.2002.02972.x. [DOI] [PubMed] [Google Scholar]
- 46.Lin RK, et al. Dysregulation of TP53/Sp1 control leads to DNA methyltransferase-1 overexpression in lung cancer. Cancer Res. 2010;70:5807–5817. doi: 10.1158/0008-5472.CAN-09-4161. [DOI] [PubMed] [Google Scholar]
- 47.Juttermann R, Le E, Jaenisch R. Toxicity of 5-aza-2’-deoxycytidine to mammalian cells is mediated primarily by covalent trapping of DNA methyltransferase rather than DNA demethylation. Proc. Natl Acad. Sci. USA. 1994;91:11797–11801. doi: 10.1073/pnas.91.25.11797. [DOI] [PMC free article] [PubMed] [Google Scholar]
- 48.Wijermanns P, et al. Low-dose 5-aza-2’-deoxycytidine, a DNA hypomethylating agent, for the treatment of high-risk myelodysplastic syndrome: a multicenter phase II study in elderly patients. J. Clin. Oncol. 2000;18:956–962. doi: 10.1200/JCO.2000.18.5.956. [DOI] [PubMed] [Google Scholar]
- 49.Issa JJ, et al. Phase 1 study of low-dose prolonged exposure schedules of the hypomethylating agent 5-aza-2’-deoxycytidine (decitabine) in hematopoietic malignancies. Blood. 2004;103:1635–1640. doi: 10.1182/blood-2003-03-0687. [DOI] [PubMed] [Google Scholar]
- 50.Kantarjian H, et al. Decitabine improves patient outcomes in myelodysplastic syndromes: results of a phase III randomized study. Cancer. 2006;106:1794–1803. doi: 10.1002/cncr.21792. [DOI] [PubMed] [Google Scholar]
- 51.Lubbert M, et al. Low-dose decitabine versus best supportive care in elderly patients with intermediate- or high-risk myelodysplastic syndrome (MDS) ineligible for intensive chemotherapy: final results of the randomized phase III study of the European Organisation for Research and Treatment of Cancer Leukemia Group and the German MDS Study Group. J. Clin. Oncol. 2011;29:1987–1996. doi: 10.1200/JCO.2010.30.9245. [DOI] [PubMed] [Google Scholar]
- 52.Kantarjian HM, et al. Survival advantage with decitabine versus intensive chemotherapy in patients with higher risk myelodysplastic syndrome: comparison with historical experience. Cancer. 2007;109:1133–1137. doi: 10.1002/cncr.22508. [DOI] [PMC free article] [PubMed] [Google Scholar]
- 53.Sato N, Maehara N, Su GH, Goggins M. Effects of 5-Aza-2′-deoxycytidine on matrix metalloproteinase expression and pancreatic cancer cell invasiveness. J. Natl Cancer Inst. 2002;95:327–330. doi: 10.1093/jnci/95.4.327. [DOI] [PubMed] [Google Scholar]
- 54.Chik F, Szyf M. Effects of specific DNMT gene depletion on cancer cell transformation and breast cancer cell invasion; toward selective DNMT inhibitors. Carcinogenesis. 2011;32:224–232. doi: 10.1093/carcin/bgq221. [DOI] [PubMed] [Google Scholar]
- 55.Gros C, et al. DNA methylation inhibitors in cancer: recent and future approaches. Biochimie. 2012;94:2280–2296. doi: 10.1016/j.biochi.2012.07.025. [DOI] [PubMed] [Google Scholar]
- 56.Mackenzie TN, et al. Triptolide induces the expression of miR-142-3p: a negative regulator of heat shock protein 70 and pancreatic cancer cell proliferation. Mol. Cancer Ther. 2013;12:1266–1275. doi: 10.1158/1535-7163.MCT-12-1231. [DOI] [PMC free article] [PubMed] [Google Scholar]
- 57.Wu Y, et al. Triptolide down-regulates TP53 gene methylation and inhibits proliferation of hepatocarcinoma SMMC-7721 cells. Chin. J. Cancer Biother. 2011;3:10. [Google Scholar]
- 58.Morran DC, et al. Targeting mTOR dependency in pancreatic cancer. Gut. 2014;63:1481–1489. doi: 10.1136/gutjnl-2013-306202. [DOI] [PMC free article] [PubMed] [Google Scholar]
- 59.Stucky BJ. SeqTrace: a graphical tool for rapidly processing DNA sequencing chromatograms. J. Biomol. Tech. 2012;23:90–93. doi: 10.7171/jbt.12-2303-004. [DOI] [PMC free article] [PubMed] [Google Scholar]
- 60.Hall TA. BioEdit: a user-friendly biological sequence alignment editor and analysis program for Windows 95/98/NT. Nucleic Acids Symp. 1999;41:95–98. [Google Scholar]
- 61.Bock C, et al. BiQ analyzer: visualization and quality control for DNA methylation data from bisulfite sequencing. Bioinformatics. 2005;21:4067–4068. doi: 10.1093/bioinformatics/bti652. [DOI] [PubMed] [Google Scholar]
Associated Data
This section collects any data citations, data availability statements, or supplementary materials included in this article.


