

Abstract
Using a short-duration step protocol and continuous indirect calorimetry, whole-body rates of fat and carbohydrate oxidation can be estimated across a range of exercise workloads, along with the individual maximal rate of fat oxidation (MFO) and the exercise intensity at which MFO occurs (Fatmax). These variables appear to have implications both in sport and health contexts. After discussion of the key determinants of MFO and Fatmax that must be considered during laboratory measurement, the present review sought to synthesize existing data in order to contextualize individually measured fat oxidation values. Data collected in homogenous cohorts on cycle ergometers after an overnight fast was synthesized to produce normative values in given subject populations. These normative values might be used to contextualize individual measurements and define research cohorts according their capacity for fat oxidation during exercise. Pertinent directions for future research were identified.
Keywords: fat oxidation, exercise, normative values, running, cycling
Introduction
During prolonged exercise, carbohydrate and fat are the primary substrates oxidized to fuel energy metabolism (Romijn et al., 1993; van Loon et al., 2001). Humans predominantly store carbohydrates as glycogen in skeletal muscle (Bergström and Hultman, 1967; Bergström et al., 1967) and the liver (Nilsson, 1973; Nilsson et al., 1973), with modest quantities also found in the brain, kidneys, and adipose tissue (Biava et al., 1966; Rigden et al., 1990; Meyer et al., 2002; Oz et al., 2003), and ~4 g circulating in plasma as glucose (Wasserman, 2009). Human carbohydrate storage is finite, and typically amounts to <3,000 kcal (<740 g) (Gonzalez et al., 2016), ~80% of which is in skeletal muscle and ~10–15% in the liver (Jensen et al., 2011). In contrast, human fat energy storage is effectively unlimited in the context of exercise (Gonzalez et al., 2016). Indeed, given 1 g of fat provides ~9.75 kcal of energy (Jeukendrup and Wallis, 2005), it can be estimated that even very lean individuals of 70 kg and 10% body fat possess ~68,250 kcal (7,000 g) of endogenous fat energy.
Carbohydrate is the quantitatively most important metabolic substrate during prolonged exercise of moderate-to-high intensities (Romijn et al., 1993; van Loon et al., 2001), and skeletal muscle glycogen can become depleted to near-zero concentrations after exercise of sufficient length and intensity (Ahlborg et al., 1967; Bergström and Hultman, 1967; Bergström et al., 1967; Hermansen et al., 1967; Hultman, 1967; Hultman and Bergström, 1967). Depletion of endogenous carbohydrate is therefore thought to limit prolonged exercise capacity in temperate conditions, with preferential depletion of glycogen sequestered in the intramyofibrillar compartment specifically implicated in impaired skeletal muscle function (Marchand et al., 2007; Nielsen et al., 2009, 2011, 2014; Ørtenblad et al., 2011) in the “localisation hypothesis” (Ørtenblad et al., 2013; Ørtenblad and Nielsen, 2015). Briefly, depletion of intramyofibrillar glycogen has been associated with impaired fatigue resistance (Nielsen et al., 2009) and tetanic Ca2+ handling (Ørtenblad et al., 2011; Nielsen et al., 2014), suggesting a role for these stores in excitation-contraction coupling, and therefore a role of their depletion in muscle fatigue. Importantly, intramyofibrillar glycogen is depleted at a relatively fasted rate during exercise than intermyofibrillar or sub-sarcolemmal glycogen, resulting in even lower intramyofibrillar compared to whole-muscle glycogen concentrations at fatigue (Marchand et al., 2007; Nielsen et al., 2011), which may serve to explain why fatigue during prolonged exercise can occur before whole-muscle glycogen concentrations approach zero.
In contrast, human fat reserves are effectively unlimited in the context of exercise, and so identifying the determinants of, and enhancing, fat oxidation during exercise is a pertinent training and research goal in endurance sport. Indeed, fat oxidation capacity has been correlated with performance in Ironman triathlons, which are ultra-endurance events (>8 h) in which carbohydrate availability is likely limiting (Frandsen et al., 2017). Maximizing fat oxidation is also likely of interest in a military context given the possible extreme duration and accompanying metabolic demand of field activities, which is of particular relevance when the logistical challenges associated with the provision of exogenous nutrition during military tasks are considered (McCaig and Gooderson, 1986). Lastly, fat metabolism is of great relevance in a health setting, given the observed positive and negative relationships between 24-h fat oxidation and markers of metabolic health such as insulin sensitivity and weight gain (Zurlo et al., 1990; Robinson et al., 2015), and that the capacity for fat oxidation during exercise has been associated with insulin sensitivity, metabolic flexibility, and lower metabolic risk factors (Venables and Jeukendrup, 2008; Rosenkilde et al., 2010; Robinson et al., 2015).
Exercise intensity and whole-body fat oxidation
Perhaps the most fundamental determinant of whole-body fat oxidation rate is exercise intensity. The relationship between exercise intensity and fat oxidation is generally parabolic; with fat oxidation initially increasing with exercise intensity before declining at high work rates (Romijn et al., 1993), although it should be acknowledged that this parabolic relationship is not always observed, particularly in untrained cohorts (Bergman and Brooks, 1999). Reductions in whole-body fat oxidation at high intensities are likely largely mediated by a reduction in delivery of fatty acids to skeletal muscle. Plasma non-esterified fatty acid (NEFA) rate of appearance is reduced at high exercise intensities despite unchanged rates of peripheral lipolysis (Romijn et al., 1993), and intravenous infusion to enhance plasma NEFA availability increases whole-body fat oxidation rates at high exercise intensities (Romijn et al., 1995). The reduction in plasma NEFA availability and delivery to skeletal muscle is likely mediated by exercise intensity-induced reductions in adipose tissue blood flow (Spriet, 2014), which might itself be mediated by exercise intensity-induced increases in plasma catecholamine concentrations (Romijn et al., 1993).
However, impaired mitochondrial fatty acid uptake might also contribute to the reduction in whole-body fat oxidation observed at high exercise intensities, given the observed reduction in mitochondrial uptake and oxidation of long-chain fatty acids with increasing exercise intensity (Sidossis et al., 1997). This may be explained by exercise intensity-induced reductions in free carnitine availability (van Loon et al., 2001) and/or acidosis-induced suppression of muscle carnitine palmitoyltransferase I (CPT-I) activity (Starritt et al., 2000). Carnitine is a substrate in the CPT-I-catalyzed reaction resulting in mitochondrial fatty acid uptake (Fritz and Yue, 1963), and the reduced pH (7.0–6.8) in the aforementioned study (Starritt et al., 2000) is physiologically reasonable during prolonged vigorous exercise (Sahlin et al., 1976). Therefore, the reduction in whole-body fat oxidation seen at high exercise intensities may be governed by reduced fatty acid delivery to and uptake in skeletal muscle.
The “Fatmax” test
In order to comprehensively define the relationship between whole-body fat oxidation rate and exercise intensity, the “Fatmax” test was developed (Achten et al., 2002). This graded exercise test elucidates whole-body fat oxidation rates across a range of exercise intensities, the maximal rate of fat oxidation (MFO), and the intensity at which the MFO occurs (Fatmax) using indirect calorimetry (Figure 1). This test advances on previous protocols using four incremental submaximal workloads (Pérez-Martin et al., 2001) that, for optimal use, require an initial assessment directly measuring maximal aerobic power (Gmada et al., 2012; Marzouki et al., 2014). The original “Fatmax” protocol consisted of 5-min, 35-W step increments performed after an overnight fast on a cycle ergometer until the respiratory exchange ratio reached 1.0, after which 2-min 35-W steps were employed (Achten et al., 2002). Importantly, this study found no significant difference in Fatmax in a sub-set of well-trained participants asked to perform an additional 3-min step test, although it should be acknowledged that step durations of 6 min may be required for sedentary individuals to reach steady-state (Bordenave et al., 2007). Finally, participants were asked to perform continuous bouts of cycling (>35 min) at single exercise intensities corresponding to those on the Fatmax test, and differences in MFO or Fatmax were not significant in the first 5 min or when averaged over the course of these prolonged assessments compared to results in the 5-min step test. Thus, the authors concluded two key theoretical limitations of step-test determination of substrate metabolism, namely shifts in substrate utilization over time and effects of prior steps, were not influential (Achten et al., 2002). The 3-min step protocol described here is indicative of those used in the literature subsequently (Achten and Jeukendrup, 2003a,b, 2004), while the starting workload and work increment magnitude is adjusted in accordance with participant training status (Rosenkilde et al., 2010; Mora-Rodríguez et al., 2016; Dandanell et al., 2017a). Importantly, a sufficiently low starting workload may effectively obviate the requirement for a specific “warm-up” protocol. Conceptually identical treadmill protocols have been used (Achten et al., 2003), and some researchers have conducted assessments in the fed state (Stisen et al., 2006; Gonzalez-Haro et al., 2007; Schwindling et al., 2014). This relatively short protocol duration makes Fatmax testing a viable monitoring tool for endurance athletes concerned with substrate metabolism during competition. Lastly, the practicality of this protocol is particularly important given attempts to predict MFO and Fatmax based on heart rate, power, and estimated maximum oxygen uptake (VO2max) have not been successful (Brun et al., 2011).
Figure 1.
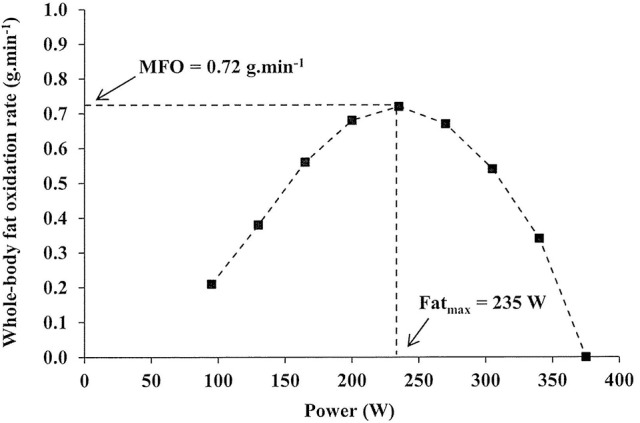
Representative illustration of fat oxidation (g.min−1) against exercise intensity (W) during a graded, cycling Fatmax test, where MFO, maximal rate of fat oxidation (g.min−1) and Fatmax, the intensity at which MFO occurs (W).
The reliability of Fatmax assessments has been examined. The first reliability study of the Fatmax protocol described above reported a coefficient of variation (CV) of 9.6% for Fatmax in a cohort of overnight fasted moderately-trained males with 24-h pre-trial dietary repetition (Achten and Jeukendrup, 2003a). Interestingly, a similar study reported a CV of just 3% for Fatmax and 11% for MFO (Dandanell et al., 2017b). These CVs are similar to those for MFO measured in sedentary cohorts using 4–5 pre-defined submaximal workloads based on prior assessment of maximal aerobic power (Gmada et al., 2012; Marzouki et al., 2014). In contrast, a 6-min step test used to determine Fatmax in a heterogeneous cohort of healthy males and females demonstrated wide limits of agreement and therefore considerable intra-individual variability (Meyer et al., 2009). However, and critically, pre-trial diet and menstrual cycle was not controlled in this study, likely contributing to intra-individual variability given the reported influence of these variables on substrate oxidation during exercise (Arkinstall et al., 2001; Campbell et al., 2001). Indeed, reliability of a similar treadmill protocol with 24-h dietary control conducted after an overnight fast reported CVs of 7 and 5% for MFO (g.min−1) and treadmill velocity at MFO (km.h−1), respectively (De Souza Silveira et al., 2016). However, high CVs (>15%) have been reported with 24-h dietary control (Croci et al., 2014a). The reason for this disparity in reliability is unclear, but may be related to the effectiveness of the pre-exercise dietary and exercise control measures (Astorino and Schubert, 2017). Failing to adequately match pre-exercise muscle glycogen content is likely to impact MFO given muscle glycogen availability is an independent regulator of substrate metabolism during exercise (Hargreaves et al., 1995).
As described above, the validity of the original Fatmax protocol was examined against prolonged exercise bouts at intensities equivalent to those in the step test, with results from the step test demonstrated to be reflective of those over longer duration (Achten et al., 2002). Interestingly, Schwindling et al. (2014) had trained cyclists perform step Fatmax tests, and then 1-h constant-load tests at Fatmax, one workload above Fatmax, and one workload below Fatmax. No significant differences in absolute fat oxidation rates were observed between-intensities in the 1-h bouts, suggesting that results from short-duration Fatmax tests may not be reflective prolonged exercise. Therefore, Fatmax testing might be used to quickly and non-invasively monitor metabolic adaptations to training, rather than to elucidate the metabolic consequences of given exercise bouts, which might require prolonged, steady-state assessments. Indeed, MFO has recently been correlated with performance in Ironman triathlon (r = 0.35, P < 0.01) (Frandsen et al., 2017), which supports its utility in training monitoring for endurance events likely limited by carbohydrate availability. Regarding the use of Fatmax assessments for deriving training prescriptions, statistical similarity has been observed between Fatmax and the intensity at which the first increase of plasma lactate concentration (LIAB) occurs (Achten and Jeukendrup, 2004; Tolfrey et al., 2010), whilst it appears Fatmax occurs at a greater relative intensity than the ventilatory threshold (Venables et al., 2005). Agreement between Fatmax and the lactate threshold has not always been observed, although it should be acknowledged that the dietary controls employed in this study were unclear (González-Haro, 2011).
In a health context, MFO has been significantly positively correlated with insulin sensitivity in a large cohort (N = 57) of young, healthy males (Robinson et al., 2015), and absolute Fatmax (Watts) has been positively correlated with insulin sensitivity in non-insulin-resistant obese males (Lambert et al., 2017). This link might be explained by mitochondrial function, given β-oxidation of fatty acids to acetyl CoA, oxidation of fatty acid or non-fatty acid-derived acetyl CoA in the citric acid cycle, and oxidative phosphorylation along the electron transport chain all occur in the mitochondria (McBride et al., 2006; Holloszy, 2011; Wu et al., 2014), and that increases in mitochondrial volume density (Hoppeler et al., 1985; Montero et al., 2015), mitochondrial oxidative capacity (Granata et al., 2016a,b), and mitochondrial enzyme content and activity (Spina et al., 1996; Scalzo et al., 2014; Granata et al., 2016a) occur in response to exercise training. Mechanistically, low mitochondrial activity may be linked to insulin resistance and development of type 2 diabetes via exacerbated production of reactive oxygen species and/or impaired lipolytic enzyme activity and accumulation of intracellular lipids, resulting in impaired regulation of insulin signaling and glucose transport (Wang et al., 2010). Indeed, mitochondrial fat oxidation capacity has been negatively correlated with whole-body respiratory exchange ratio during exercise (Sahlin et al., 2007), whilst training-induced increases in exercise-induced whole-body fat oxidation have been correlated with improvements in mitochondrial respiration and citrate synthase activity (Bordenave et al., 2008). Given the already well-established relationship between cardiorespiratory fitness and a range of metabolic and cardiovascular disease outcomes (Harber et al., 2017), and the American Heart Association's recent advocacy of cardiorespiratory fitness or maximum oxygen uptake (VO2max) testing in cardiovascular disease risk assessment (Ross et al., 2016), it is possible that quantifying MFO within these assessments will emerge as a tool to improve their predictive power. However, this would require longitudinal studies investigating associations between changes in MFO and metabolic risk factors such as insulin sensitivity.
Therefore, Fatmax tests appear a practical monitoring tool in performance settings where the capacity to utilize fat as a metabolic substrate is of concern, and might also be useful in clinical exercise physiology as an indicator of metabolic health. The purpose of the present review is to extend previous summaries (Jeukendrup and Wallis, 2005; Purdom et al., 2018) by systematically exploring key determinants of MFO and Fatmax for consideration during laboratory assessment, and to for the first time contextualize individually measured values in given subject populations with normative values. Normative values could be used to define the fat oxidation capacity of given research cohorts in exercise-metabolic studies in a manner analogous to VO2max-based definitions of aerobic capacity. Key directions for future research will be discussed.
Maximal fat oxidation: what we know
In order to explore the determinants of MFO and Fatmax, a systematic literature search was performed to identify all studies using Fatmax protocols in adult populations. As such, “maximal fat oxidation,” “peak fat oxidation,” and “Fatmax” were searched in the PubMed and Web of Science databases (27/03/2018). Hand searches of reference lists and key journals were also conducted. Studies published in English and reporting directly measured MFO and/or Fatmax values in adult populations were included. This search approach yielded 53 studies for inclusion in the review.
Training status
Five studies were identified that directly compared MFO and/or Fatmax between subjects groups of different training status (Nordby et al., 2006; Stisen et al., 2006; Lima-Silva et al., 2010; Schwindling et al., 2014; Ipavec-Levasseur et al., 2015). In comparisons of trained endurance athletes with different levels of VO2max, the better-trained group has greater MFO, with no difference in Fatmax (Lima-Silva et al., 2010; Schwindling et al., 2014). Those studies comparing active with untrained individuals have observed significantly greater MFO (Nordby et al., 2006; Ipavec-Levasseur et al., 2015), or a tendency toward greater MFO (Stisen et al., 2006), in the active or trained group, with only one of these studies reporting a difference in Fatmax, which was greater in the trained group (Nordby et al., 2006). Alternatively, five large cohort studies with heterogeneous subject populations have all reported a significant small-to-moderate influence of VO2max on MFO (Venables et al., 2005; Robinson et al., 2015; Fletcher et al., 2017; González et al., 2017; Randell et al., 2017).
A moderating effect of training status on MFO is not surprising given the previously observed significantly higher whole-body fat oxidation rates in trained compared to untrained males exercising at the same absolute workload (van Loon et al., 1999). Indeed, as a result of exercise training, skeletal muscle adaptations occur that augment fat oxidation during exercise (Egan and Zierath, 2013). These include mitochondrial biogenesis (Howald et al., 1985), increased tricarboxylic acid cycle enzyme and electron transport chain protein content (Egan et al., 2011), and increased fatty acid transporter and enzyme content (Talanian et al., 2010). An interesting direction for future research might be to compare MFO and Fatmax between trained endurance athletes competing in events with different requirements for fat oxidation, e.g. traditional endurance events such as half-marathon and marathon running and ultra-endurance events such as Ironman triathlons, and also to derive data from elite-level endurance populations.
Sex
Seven studies were identified that compared males (N = 439) and females (N = 390) in terms of absolute MFO (g.min−1) and/or Fatmax (%VO2max) (Bircher et al., 2005; Venables et al., 2005; Bogdanis et al., 2008; Carey, 2009; Chenevière et al., 2011; Bagley et al., 2016; Fletcher et al., 2017). In order to quantitatively elucidate sex-mediated effects on these variables, sample size-weighted means and standard deviations (SD) for males and females were calculated. Standard error was converted to SD through multiplication by the square root of the sample size (Altman and Bland, 2005). SD for each study was collapsed by first squaring and then multiplying by the degrees of freedom. A sample size-weighted overall SD was calculated as the square root of the sum of collapsed SDs divided by total degrees of freedom. Cohen's d effect sizes (ES ± 90% confidence limits) were subsequently computed and interpreted according to Cohen's criteria (Cohen, 1977). Results from this analysis suggest absolute MFO is greater in males (N = 270, 0.56 ± 0.17 g.min−1) than females (N = 236, 0.44 ± 0.15 g.min−1), an effect of large magnitude (ES = 0.76 ± 0.10). However, Fatmax appears greater in females (N = 344, 56 ± 14%VO2max) than males (N = 371, 51 ± 14%VO2max), an effect of small magnitude (ES = 0.41 ± 0.09). These effects are aligned to those in a recent large-scale (N = 305; MFO, 0.62 ± 0.19 vs. 0.48 ± 0.15 g.min−1, P < 0.0001, ES = 0.76 ± 0.13; Fatmax, 59 ± 16 vs. 62 ± 16% VO2max, P = 0.09, ES = 0.19 ± 0.13; in males and females, respectively) cohort study (Fletcher et al., 2017).
However, some studies making comparisons between-sexes have reported MFO relative to fat-free mass (FFM). When expressed in these terms (mg.kg FFM−1.min−1), two large cohort studies have reported greater MFO in females compared to males (Venables et al., 2005; Fletcher et al., 2017). This effect has been observed in moderately trained individuals (Chenevière et al., 2011), and a tendency toward this effect has been observed in a poorly-defined active cohort (Bagley et al., 2016). Interestingly, it appears this effect is abolished in overweight/obese individuals (Bogdanis et al., 2008; Haufe et al., 2010). In accordance with these findings, it has been observed that females have greater relative whole-body fat oxidation (i.e., as a percentage of overall energy expenditure) at given steady-state exercise intensities compared to males (Knechtle et al., 2004), indicative of greater reliance on fat metabolism during exercise in females. The ovarian hormone estrogen may explain this sex difference (Oosthuyse and Bosch, 2010; Devries, 2016), as estrogen appears to stimulate lipolysis and NEFA availability (D'Eon et al., 2002), plausibly via activation of 5′ adenosine monophosphate-activated protein kinase (AMPK) (D'Eon et al., 2005).
The existing literature therefore suggests that whilst absolute MFO is generally greater in males compared to females, MFO relative to FFM is likely greater in non-obese females compared to non-obese males. There also appears a minor tendency toward greater Fatmax in females compared to males. Given sex-related differences in body mass and composition, MFO relative to FFM might be more descriptive when comparing between sexes. Whether these effects are observed in endurance-trained cohorts is unknown. Similarly, effects of the menstrual cycle on MFO and Fatmax have not been studied, but warrant consideration in the context of serial inter-individual measurement.
Nutritional status
Only one study has directly examined the effect of acute feeding status on MFO and Fatmax (Achten and Jeukendrup, 2003b). Trained males performed Fatmax assessments on a cycle ergometer after an overnight fast, with 75 g of glucose or placebo ingested 45 min pre-exercise. MFO (0.33 ± 0.06 vs. 0.46 ± 0.06 g.min−1) and Fatmax (52 ± 3 vs. 60 ± 2%VO2max) were significantly decreased with pre-exercise carbohydrate feeding (Achten and Jeukendrup, 2003b). This is likely explained by carbohydrate-induced insulinaemia, suppression of lipolysis, and suppression of fatty acid availability, which in turn might be expected to suppress whole-body fat oxidation in a manner similar to that seen at high exercise intensities (Romijn et al., 1995). Indeed, triglyceride and heparin infusion has been shown to increase plasma NEFA concentration, whole-body lipolysis, and fat oxidation rate during exercise with pre-exercise glucose feeding toward values observed during exercise after an overnight fast, suggesting that part of the suppressive effect of pre-exercise carbohydrate feeding on whole-body fat oxidation is explained by reduced fatty acid availability (Horowitz et al., 1997). Acute nutritional status is therefore a clear determinant of MFO and Fatmax, and should be considered when comparing results between-studies as well as in serial intra-individual assessment. However, further examination of this effect in untrained populations is warranted, as is the time-course and macronutrient content of pre-exercise feeding on measures of MFO and Fatmax. Such data might provide exercise physiologists with guidelines when using Fatmax tests for athlete monitoring and in health assessments, as conducting assessments at the exact same time of day is not always possible.
From a chronic dietary perspective, a recent large study of 150 male and 155 female subjects used hierarchical regression to elucidate the influence of a 4-day dietary record on MFO, and reported absolute carbohydrate and fat intakes accounted for 3.2% of the variation, with carbohydrate and fat intakes contributing negatively and positively to MFO, respectively (Fletcher et al., 2017). Whilst the degree of variance explained by diet was small in this mixed-cohort study, this contribution might be greater in homogenous cohorts. Nevertheless, an independent effect of chronic macronutrient intake was observed, making it therefore a critical variable to control in repeat testing.
In a cross-sectional study involving a homogenous cohort of male ultra-endurance runners, MFO (1.54 ± 0.18 vs. 0.67 ± 0.14 g.min−1) and Fatmax (70 ± 6 vs. 55 ± 8%VO2max) were significantly higher in those habitually consuming a ketogenic vs. high carbohydrate diet (Volek et al., 2016). Habitual consumption of a ketogenic diet was defined as a diet deriving < 20% of energy from carbohydrate and >60% from fat, whereas a high-carbohydrate diet was one that derived >55% of energy from carbohydrate, as confirmed by a 3-day weighed food record. A greater whole-body fat oxidation rate was observed during prolonged steady-state exercise in the low-carbohydrate group (~60%), an adaptation consistently seen in diet intervention studies (Phinney et al., 1983; Burke et al., 2000). Interestingly, however, muscle glycogen utilization during prolonged steady-state exercise was not significantly different between-groups, suggesting habitual consumption of a ketogenic diet did not spare glycogen in working skeletal muscle (Volek et al., 2016), which indicates the carbohydrate sparing effect was explained by reduced hepatic glycogenolysis and glucose output (Webster et al., 2016). An interesting direction for future research would be to determine the “threshold” of carbohydrate restriction required to elicit changes in MFO and Fatmax, as this might provide endurance athletes with pertinent information when preparing events where maximizing fat utilization, and minimizing endogenous carbohydrate utilization, is sought. This might be particularly useful in a military context when long-duration tasks are performed (McCaig and Gooderson, 1986).
It is also possible that protein intake exerts an effect on MFO. During 3-month consumption of a weight-maintenance diet, increasing protein intake by ~10 g.d−1 has been shown to significantly increase MFO by ~19% in a mixed-sex sample of previously weight-stable volunteers (Soenen et al., 2010). Importantly, the increase in protein intake explained ~39% of the increase in MFO. These results implicate modifying protein consumption as a potential strategy to alter MFO, although the contribution of the inevitably reduced daily carbohydrate consumption on MFO in this study was not quantified.
Exercise modality
A further consideration is exercise modality. In general, studies comparing running and cycling at given exercise intensities have reported greater fat and reduced carbohydrate oxidation rates during running (Snyder et al., 1993; Achten et al., 2003; Knechtle et al., 2004; Chenevière et al., 2010). However, comparisons of MFO and Fatmax between-modalities have not been as conclusive. The original study reported significantly greater MFO (0.65 ± 0.05 vs. 0.47 ± 0.05 g.min−1), with no difference in Fatmax (62 ± 3 vs. 59 ± 3%VO2max), during treadmill running compared to cycling in moderately-trained males (Achten et al., 2003). A further study in a similar subject population failed to observe a significant difference in MFO, but did observe a greater Fatmax during running (Chenevière et al., 2010). The reason for this disparate result in terms of MFO is not easily discernible, but could be related to between-study differences indirect calorimetry (analysis of 1 vs. 2 min of expired gases per 3-min stage), given the greater VO2 slow component during cycling (Billat et al., 1999). It is therefore recommended that the exercise modality in which Fatmax tests are performed be considered when between-study and intra-individual comparisons are made, and by those preparing for multi-modal endurance competitions such as triathlons.
What we know: conclusions
It has been demonstrated that the training status, sex, and acute and chronic nutritional status of the subject population or individual under study are clear determinants of MFO and Fatmax, with a possible effect of exercise modality. These determining factors must be considered when interpreting results between-studies and in serial intra-individual measurement.
Maximal fat oxidation: normative values
Given the interest in measurement of MFO and Fatmax in research and non-research settings, it would be prudent to generate normative values from existing data in order to contextualize individually measured values and define the fat oxidation capacity of given research cohorts. However, in order to do this, the aforementioned determinants of MFO and Fatmax need to be considered. Accordingly, published MFO and Fatmax values were synthesized from studies with homogeneous cohorts performing assessments after an overnight fast on a cycle ergometer. These criteria were applied in order to generate sufficient data to produce meaningful normative values.
Studies were subsequently partitioned into five populations: endurance-trained, lean males (Achten et al., 2002, 2003; Achten and Jeukendrup, 2003a,b, 2004; Nordby et al., 2006; Frandsen et al., 2017), recreationally-active, lean males (Bircher et al., 2005; Croci et al., 2014a,b; Guadalupe-Grau et al., 2014; Lanzi et al., 2014; Bagley et al., 2016), recreationally-active, lean females (Bircher et al., 2005; Isacco et al., 2015; Bagley et al., 2016), overweight/obese males (Mogensen et al., 2009; Rosenkilde et al., 2010; Ara et al., 2011; Tsujimoto et al., 2012; Alkahtani et al., 2013; Alkahtani, 2014; Lanzi et al., 2014, 2015; Ipavec-Levasseur et al., 2015; Mohebbi et al., 2015; Nordby et al., 2015; Mora-Rodríguez et al., 2016; Dandanell et al., 2017b), and overweight/obese females (Besnier et al., 2015; Borel et al., 2015; Dandanell et al., 2017b). “Endurance-trained” was defined by a sample mean VO2max >55 ml.kg−1.min−1 and active engagement in training for endurance events. “Recreationally-active” was defined as physically active according to the individual study, not training for endurance events, and, where measured, by a sample mean VO2max <55 ml.kg−1.min−1. The division between “lean” and “overweight/obese” was defined in males as a body fat percentage of 25% and/or body mass index of 25 kg.m−2, and in females as a body fat percentage of 30% and/or body mass index of 25 kg.m−2. Owing to often-absent definitions of physical activity status in overweight populations, those considered overweight/obese were not further defined by physical activity status. Baseline values were used for intervention studies. For synthesis, a sample size-weighted mean and SD for MFO was calculated for each population as described above for sex-mediated comparisons (see section Sex). Subsequently, normative percentile values were generated for each population assuming a within-population normal distribution (Tables 1, 2).
Table 1.
Normative percentile values for MFO (g.min−1) in different subject populations during assessments performed on a cycle ergometer after an overnight fast.
| Population | N | Mean MFO (g.min−1) | 20th percentile | 40th percentile | 60th percentile | 80th percentile |
|---|---|---|---|---|---|---|
| Endurance-trained, lean males | 201 | 0.53 ± 0.16 | 0.40 | 0.49 | 0.58 | 0.67 |
| Recreationally-active, lean males | 105 | 0.46 ± 0.14 | 0.34 | 0.42 | 0.49 | 0.58 |
| Recreationally-active, lean females | 68 | 0.35 ± 0.12 | 0.25 | 0.32 | 0.38 | 0.45 |
| Overweight/obese males | 193 | 0.28 ± 0.14 | 0.16 | 0.24 | 0.31 | 0.39 |
| Overweight/obese females | 144 | 0.16 ± 0.05 | 0.12 | 0.15 | 0.17 | 0.20 |
For example, measurement of MFO at 0.67 g.min−1 in an endurance-trained, lean male would place them in the 80th percentile.
Table 2.
Normative percentile values for Fatmax (%VO2max) in different subject populations during assessments performed on a cycle ergometer after an overnight fast.
| Population | N | Mean Fatmax (%VO2max) | 20th percentile | 40th percentile | 60th percentile | 80th percentile |
|---|---|---|---|---|---|---|
| Endurance-trained, lean males | 201 | 56 ± 8 | 49 | 54 | 58 | 63 |
| Recreationally-active, lean males | 67 | 51 ± 8 | 44 | 48 | 53 | 58 |
| Recreationally-active, lean females | 38 | 50 ± 10 | 41 | 47 | 52 | 58 |
| Overweight/obese males | 190 | 43 ± 18 | 28 | 38 | 47 | 57 |
| Overweight/obese females | 27 | 61 ± 10 | 52 | 58 | 64 | 70 |
For example, measurement of Fatmax at 63%VO2max in an endurance-trained, lean male would place them in the 80th percentile.
A trend toward greater MFO with increasing training status was observed (Table 1), and in males compared to females, which supports the evidence from individual studies presented above. Similarly, a less-pronounced trend toward greater Fatmax with increasing training status was observed (Table 2), with the exception of overweight/obese females, although this may be an artifact of the small sample size (N = 27). These normative percentile values might therefore be used by exercise physiologists to contextualize individual measurements and define the fat oxidation capacity of given research cohorts, whilst acknowledging the aforementioned determinants of MFO when making inferences. It is worth noting that no data was available for endurance-trained female populations, which is a pertinent area for future research. However, it might be possible to use the values reported for endurance-trained males and scale them down according to the synthesis described above for sex-mediated comparisons, which demonstrated MFO was on average 28% greater in males (0.56 ± 0.17 vs. 0.44 ± 0.15 g.min−1). It should also be noted that none of this data was derived from studies in which participants ingested a high-fat or ketogenic diet, which is known to increase fat oxidation during exercise (Phinney et al., 1983; Burke et al., 2000). Indeed, in many of the studies in endurance-trained males participants were specifically instructed to ingest a high-carbohydrate meal the evening before testing (Achten et al., 2002, 2003; Achten and Jeukendrup, 2003a,b, 2004). Therefore, these values are likely only of relevance to those ingesting a traditional mixed diet.
Maximal fat oxidation: what we don't know
Many determinants of MFO and Fatmax have been identified in the ~16 years since the original protocol was developed (Achten et al., 2002). However, given the practical utility of this protocol as a training monitoring tool in elite sport and as an indication of health status, further research is warranted to better understand what factors must be considered when measuring MFO and Fatmax, as is research concerned with training effects on these variables and their relevance to endurance performance (Figure 2).
Figure 2.

Schematic illustration of the identified determinants of maximal fat oxidation during graded protocols (black) and key identified unknown factors (gray).
Environmental temperature
An unexplored parameter likely to alter MFO and Fatmax is environmental temperature. Environmental heat stress increases muscle glycogenolysis, hepatic glucose output, and whole-body carbohydrate oxidation rates, whilst reducing fat oxidation rates at given intensities (Febbraio et al., 1994a,b; Hargreaves et al., 1996a). This is attributed to independent effects of rising core temperature, enhanced muscle temperature, greater plasma catecholamine concentrations, and progressive dehydration (Febbraio et al., 1996, 1998; Hargreaves et al., 1996b; Starkie et al., 1999). Given these effects, it might be hypothesized that MFO decreases in the heat compared to temperate conditions, although it is also possible that MFO is shifted to a lower Fatmax. Elucidating this effect is a relevant consideration for endurance sport and military contexts given the likely negative effects of environmental heat on self-selected work intensity.
The effect of cold environments on substrate metabolism during prolonged exercise is less certain. Some investigations have reported augmented carbohydrate utilization in cold vs. temperate conditions (Galloway and Maughan, 1997; Layden et al., 2002), whereas others suggest fat utilization is augmented and carbohydrate utilization is suppressed in the cold (Galloway and Maughan, 1997; Parkin et al., 1999; Gagnon et al., 2013). Interestingly, Galloway and Maughan (Galloway and Maughan, 1997) reported greater fat oxidation rates during moderate intensity cycling at 11 vs. 21°C, but this was suppressed at 4°C. These disparities are not easily reconciled, and may be a result of interactions between the specific environmental conditions and exercise modality (cycling vs. running) (Gagnon et al., 2013).
Direct investigation of the impact of environmental temperature on laboratory measures of MFO and Fatmax, and the environmental thresholds at which they occur, is therefore warranted. This data would have strong applied relevance given the diverse environmental conditions in which endurance competitions take place (Racinais et al., 2015; Casadio et al., 2017), as well as the extreme environments encountered in military settings (Orr et al., 2015).
Training effects
Fourteen longitudinal studies have measured the effect of exercise training interventions on MFO and/or Fatmax (Venables and Jeukendrup, 2008; Mogensen et al., 2009; Alkahtani et al., 2013; Astorino et al., 2013, 2017; Besnier et al., 2015; Ipavec-Levasseur et al., 2015; Lanzi et al., 2015; Nordby et al., 2015; Rosenkilde et al., 2015; Bagley et al., 2016; Mora-Rodríguez et al., 2016; Tan et al., 2016; Schubert et al., 2017). MFO is generally upregulated in response to exercise training (Mogensen et al., 2009; Alkahtani et al., 2013; Astorino et al., 2013; Besnier et al., 2015; Ipavec-Levasseur et al., 2015; Lanzi et al., 2015; Nordby et al., 2015; Rosenkilde et al., 2015; Bagley et al., 2016; Mora-Rodríguez et al., 2016; Tan et al., 2016) whilst Fatmax typically remains unchanged (Venables and Jeukendrup, 2008; Mogensen et al., 2009; Alkahtani et al., 2013; Ipavec-Levasseur et al., 2015; Rosenkilde et al., 2015; Bagley et al., 2016; Astorino et al., 2017; Schubert et al., 2017), although increased Fatmax has been observed on occasion (Mogensen et al., 2009; Lanzi et al., 2015; Nordby et al., 2015). Training-induced increases in MFO have been consistently observed in sedentary populations (Mogensen et al., 2009; Alkahtani et al., 2013; Astorino et al., 2013; Besnier et al., 2015; Ipavec-Levasseur et al., 2015; Lanzi et al., 2015; Nordby et al., 2015; Rosenkilde et al., 2015; Mora-Rodríguez et al., 2016; Tan et al., 2016), but this effect has not always been observed in previously-active populations (Astorino and Schubert, 2017; Schubert et al., 2017), and remains uninvestigated in endurance-trained athletes.
Training-induced increases in MFO have been observed with interval (~10–80%) (Alkahtani et al., 2013; Astorino et al., 2013; Lanzi et al., 2015; Bagley et al., 2016) and moderate-intensity (~7–58%) (Venables and Jeukendrup, 2008; Mogensen et al., 2009; Alkahtani et al., 2013; Besnier et al., 2015; Ipavec-Levasseur et al., 2015; Lanzi et al., 2015; Nordby et al., 2015; Rosenkilde et al., 2015; Mora-Rodríguez et al., 2016; Tan et al., 2016) training regimens, and these responses are independent of changes in body mass (Nordby et al., 2015). Therefore, the existing literature suggests MFO is a malleable parameter that can be increased by both aerobic or interval training, particularly in sedentary populations. It is likely that training-induced increases in MFO are mediated by adaptations to adipose tissue lipolysis, NEFA transport to skeletal muscle, skeletal muscle NEFA uptake, muscle triglyceride lipolysis, and/or mitochondrial uptake of fatty acids, given fat oxidation may be limited by fatty acid delivery to skeletal muscle or mitochondrial fatty acid uptake (Romijn et al., 1993, 1995; Sidossis et al., 1997; Starritt et al., 2000; van Loon et al., 2001; Spriet, 2014). Indeed, alongside long-standing observations of adaptations to fat metabolism in response to moderate-intensity training (Howald et al., 1985; Talanian et al., 2010; Egan et al., 2011), various high-intensity or sprint interval training regimens can also stimulate beneficial adaptations across many steps involved in fat oxidation (Astorino and Schubert, 2017), including increased mitochondrial enzyme activity and protein content (Burgomaster et al., 2005, 2006, 2007, 2008; Gibala et al., 2006), muscle membrane fatty acid transport protein content (Talanian et al., 2007, 2010; Perry et al., 2008), and lipolytic enzyme protein content (Talanian et al., 2010).
The most favorable training regimen for increasing MFO cannot presently be discerned. Training studies have generally utilized either prolonged moderate-intensity aerobic exercise (Mogensen et al., 2009; Besnier et al., 2015; Ipavec-Levasseur et al., 2015; Nordby et al., 2015; Rosenkilde et al., 2015; Mora-Rodríguez et al., 2016; Tan et al., 2016) or high-intensity interval exercise (Bagley et al., 2016; Astorino et al., 2017; Schubert et al., 2017), with only three studies comparing the two (Venables and Jeukendrup, 2008; Alkahtani et al., 2013; Lanzi et al., 2015). Interestingly, differences in the magnitude of training-induced increases in MFO were not observed for moderate and high-intensity interval training in these studies (Venables and Jeukendrup, 2008; Alkahtani et al., 2013; Lanzi et al., 2015). Furthermore, whilst promising effects of training with low-glycogen availability on whole-body fat oxidation rates during prolonged exercise have been observed (Yeo et al., 2008; Hulston et al., 2010), the influence of this training regimen on MFO and Fatmax remains experimentally unexplored.
There is also a notable absence of data concerning the responsiveness of MFO and Fatmax to training in endurance-trained cohorts. Existing studies have generally been in overweight/obese populations (Venables and Jeukendrup, 2008; Mogensen et al., 2009; Alkahtani et al., 2013; Besnier et al., 2015; Ipavec-Levasseur et al., 2015; Lanzi et al., 2015; Nordby et al., 2015; Rosenkilde et al., 2015; Mora-Rodríguez et al., 2016; Tan et al., 2016), with three studies in apparently active but untrained individuals (Bagley et al., 2016; Astorino et al., 2017; Schubert et al., 2017). As endurance-trained individuals already have elevated MFO compared to lesser-trained populations, it remains to be determined if these individuals can accrue further advances in MFO through optimized training practices. It would also be useful to discern if training-induced changes in MFO reflect alterations in substrate metabolism during prolonged exercise, as the relatively short-duration of this protocol makes it a viable monitoring tool in elite sport.
Therefore, whilst it has been demonstrated that exercise training per se improves MFO in untrained populations, this effect remains to be elucidated in trained populations, and the most appropriate training regimen for increasing MFO is unknown. These are worthy directions for future research given the likely importance of fat oxidation capacity in endurance sport and military settings, and the apparent relationship between MFO and insulin sensitivity (Robinson et al., 2015).
Relevance to exercise performance
A hypothesis linking MFO, Fatmax, and performance in prolonged exercise where carbohydrate availability is limiting (>2 h) has clear intuitive appeal. If an individual makes extensive use of fat oxidation to support metabolism during prolonged exercise at their competitive or operational intensity, this should reduce the requirement for endogenous carbohydrate oxidation, and therefore muscle glycogen depletion, which is linked to fatigue (Bergström et al., 1967; Ørtenblad et al., 2013). Indeed, at a given absolute workload, significantly higher whole-body fat oxidation and lower muscle glycogenolysis have been observed in trained compared to untrained males (van Loon et al., 1999). A link between MFO, Fatmax, and endurance exercise performance is further supported by cross-sectional evidence demonstrating enhanced MFO in trained compared to untrained cohorts (Nordby et al., 2006; Stisen et al., 2006; Ipavec-Levasseur et al., 2015).
However, the importance of MFO and Fatmax for exercise performance has not yet been comprehensively studied, and such research is warranted. A recent study of 64 Ironman triathletes reported a significant, albeit modest, correlation between MFO and performance time in the 2016 Copenhagen Ironman (r = 0.35, P < 0.01) (Frandsen et al., 2017). Metabolically, a cross-sectional study of elite ultra-distance runners demonstrated greater MFO and Fatmax in those adapted to ketogenic diets, but the rate of glycogenolysis in working skeletal muscle during prolonged exercise was not significantly different compared to those ingesting a high-carbohydrate diet, despite higher whole-body fat oxidation rates (Volek et al., 2016). Therefore, MFO, Fatmax, and whole-body fat oxidation rates were dissociated from skeletal muscle glycogenolysis during prolonged endurance exercise between these groups, which might question the hypothesis linking MFO and Fatmax to endurance exercise performance via muscle glycogen sparing. However, it is possible this dissociation was an artifact of the measurement site, and that a carbohydrate sparing effect in the ketogenic group was observed in the liver, as observed previously (Webster et al., 2016).
An interesting avenue for future research might therefore be to determine if MFO and Fatmax are indicators of the degree of endogenous carbohydrate utilization and skeletal muscle glycogenolysis during prolonged exercise within a homogenous group of endurance-trained athletes, and consequently if such an effect has implications for endurance exercise performance. Such data would provide indication of the functional relevance of monitoring MFO and Fatmax in endurance-trained athletes, and could serve to build on existing models of endurance exercise performance (McLaughlin et al., 2010).
Conclusions
This review has systematically identified several key determinants of MFO and Fatmax. These include training status, sex, acute nutritional status, and chronic nutritional status, with the possibility of an effect of exercise modality. Accordingly, normative percentile values for MFO and Fatmax in different subject populations are provided to contextualize individually measured values and define the fat oxidation capacity of given research cohorts. However, the effect of environmental conditions on MFO and Fatmax remain to be established, as does the most appropriate means of training MFO and Fatmax, particularly in endurance-trained cohorts. Furthermore, direct links between MFO, Fatmax, and rates of muscle glycogenolysis during prolonged exercise remain to be established, as do relationships between MFO, Fatmax, and exercise performance. This information might add to existing models of endurance exercise performance, and indicate how useful MFO and Fatmax monitoring might be in endurance sport.
Author contributions
EM performed data analysis. EM, DP, and AK wrote the manuscript.
Conflict of interest statement
The authors declare that the research was conducted in the absence of any commercial or financial relationships that could be construed as a potential conflict of interest.
Acknowledgments
EM is funded by an Education New Zealand scholarship (no role in preparation of the manuscript).
References
- Achten J., Gleeson M., Jeukendrup A. E. (2002). Determination of exercise intensity that elicits maximal fat oxidation. Med. Sci. Sports Exerc. 34, 92–97. 10.1097/00005768-200201000-00015 [DOI] [PubMed] [Google Scholar]
- Achten J., Jeukendrup A. E. (2003a). Maximal fat oxidation during exercise in trained men. Int. J. Sports Med. 24, 603–608. 10.1055/s-2003-43265 [DOI] [PubMed] [Google Scholar]
- Achten J., Jeukendrup A. E. (2003b). The effect of pre-exercise carbohydrate feedings on the intensity that elicits maximal fat oxidation. J. Sports Sci. 21, 1017–1024. 10.1080/02640410310001641403 [DOI] [PubMed] [Google Scholar]
- Achten J., Jeukendrup A. E. (2004). Relation between plasma lactate concentration and fat oxidation rates over a wide range of exercise intensities. Int. J. Sports Med. 25, 32–37. 10.1055/s-2003-45231 [DOI] [PubMed] [Google Scholar]
- Achten J., Venables M. C., Jeukendrup A. E. (2003). Fat oxidation rates are higher during running compared with cycling over a wide range of intensities. Metab. Clin. Exp. 52, 747–752. 10.1016/S0026-0495(03)00068-4 [DOI] [PubMed] [Google Scholar]
- Ahlborg B., Bergström J., Ekelund L., Hultman E. (1967). Muscle glycogen and muscle electrolytes during prolonged phyiscal exercise. Acta Physiol. Scand. 70, 129–142. 10.1111/j.1748-1716.1967.tb03608.x [DOI] [Google Scholar]
- Alkahtani S. (2014). Comparing fat oxidation in an exercise test with moderate-intensity interval training. J. Sports Sci. Med. 13, 51–58. [PMC free article] [PubMed] [Google Scholar]
- Alkahtani S. A., King N. A., Hills A. P., Byrne N. M. (2013). Effect of interval training intensity on fat oxidation, blood lactate and the rate of perceived exertion in obese men. Springerplus 2:532. 10.1186/2193-1801-2-532 [DOI] [PMC free article] [PubMed] [Google Scholar]
- Altman D. G., Bland J. M. (2005). Standard Deviations and Standard Errors. Br. Med. J. 331:903. 10.1136/bmj.331.7521.903 [DOI] [PMC free article] [PubMed] [Google Scholar]
- Ara I., Larsen S., Stallknecht B., Guerra B., Morales-Alamo D., Andersen J., et al. (2011). Normal mitochondrial function and increased fat oxidation capacity in leg and arm muscles in obese humans. Int. J. Obes. 35, 99–108. 10.1038/ijo.2010.123 [DOI] [PubMed] [Google Scholar]
- Arkinstall M. J., Bruce C. R., Nikolopoulos V., Garnham A. P., Hawley J. A. (2001). Effect of carbohydrate ingestion on metabolism during running and cycling. J. Appl. Physiol. 91, 2125–2134. 10.1152/jappl.2001.91.5.2125 [DOI] [PubMed] [Google Scholar]
- Astorino T. A., Edmunds R. M., Clark A., Gallant R., King L., Ordille G. M., et al. (2017). Change in maximal fat oxidation in response to different regimes of periodized High-Intensity Interval Training (HIIT). Eur. J. Appl. Physiol. 117 745–55. 10.1007/s00421-017-3535-y [DOI] [PubMed] [Google Scholar]
- Astorino T. A., Schubert M. M. (2017). Changes in fat oxidation in response to various regimes of High Intensity Interval Training (HIIT). Eur. J. Appl. Physiol. 118, 51–63. 10.1007/s00421-017-3756-0 [DOI] [PubMed] [Google Scholar]
- Astorino T. A., Schubert M. M., Palumbo E., Stirling D., McMillan D. W. (2013). Effect of two doses of interval training on maximal fat oxidation in sedentary women. Med. Sci. Sports Exerc. 45, 1878–1886. 10.1249/MSS.0b013e3182936261 [DOI] [PubMed] [Google Scholar]
- Bagley L., Slevin M., Bradburn S., Liu D., Murgatroyd C., Morrissey G., et al. (2016). Sex differences in the effects of 12 weeks sprint interval training on body fat mass and the rates of fatty acid oxidation and VO2max during exercise. BMJ Open Sport Exerc. Med. 2:e000056. 10.1136/bmjsem-2015-000056 [DOI] [PMC free article] [PubMed] [Google Scholar]
- Bergman B. C., Brooks G. A. (1999). Respiratory gas-exchange ratios during graded exercise in fed and fasted trained and untrained men. J. Appl. Physiol. 86, 479–487. 10.1152/jappl.1999.86.2.479 [DOI] [PubMed] [Google Scholar]
- Bergström J., Hermansen L., Hultman E., Saltin B. (1967). Diet, muscle glycogen and physical performance. Acta Physiol. Scand. 71, 140–150. 10.1111/j.1748-1716.1967.tb03720.x [DOI] [PubMed] [Google Scholar]
- Bergström J., Hultman E. (1967). A Study of the Glycogen Metabolism during Exercise in Man. Scand. J. Clin. Lab. Invest. 19, 218–228. 10.3109/00365516709090629 [DOI] [PubMed] [Google Scholar]
- Besnier F., Lenclume V., Gérardin P., Fianu A., Martinez J., Naty N. (2015). Individualized exercise training at maximal fat oxidation combined with fruit and vegetable-rich diet in overweight or obese women: the lipoxmax-réunion randomized controlled trial. PLoS ONE 10:e0139246. 10.1371/journal.pone.0139246 [DOI] [PMC free article] [PubMed] [Google Scholar]
- Biava C., Grossman A., West M. (1966). Ultrastructural observations on renal glycogen in normal and pathologic human kidneys. Lab. Invest. 15, 330–56. [PubMed] [Google Scholar]
- Billat V. L., Mille-Hamard L., Petit B., Koralsztein J. P. (1999). The role of cadence on the VO2 slow component in cycling and running in triathletes. Int. J. Sports Med. 20, 429–437. 10.1055/s-1999-8825 [DOI] [PubMed] [Google Scholar]
- Bircher S., Knechtle B., Knecht H. (2005). Is the intensity of the highest fat oxidation at the lactate concentration of 2 Mmol L-1? a comparison of two different exercise protocols. Eur. J. Clin. Invest. 35, 491–498. 10.1111/j.1365-2362.2005.01538.x [DOI] [PubMed] [Google Scholar]
- Bogdanis G. C., Vangelakoudi A., Maridaki M. (2008). Peak fat oxidation rate during walking in sedentary overweight men and women. J. Sports Sci. Med. 7, 525–31. [PMC free article] [PubMed] [Google Scholar]
- Bordenave S., Flavier S., Fédou C., Brun J. F., Mercier J. (2007). Exercise calorimetry in sedentary patients: procedures based on short 3 min steps underestimate carbohydrate oxidation and overestimate lipid oxidation. Diabetes Metabol. 33, 379–384. 10.1016/j.diabet.2007.04.003 [DOI] [PubMed] [Google Scholar]
- Bordenave S., Metz L., Flavier S., Lambert K., Ghanassia E., Dupuy A., et al. (2008). Training-induced improvement in lipid oxidation in type 2 diabetes mellitus is related to alterations in muscle mitochondrial activity: effect of endurance training in type 2 Diabetes. Diabetes Metabol. 34, 162–168. 10.1016/j.diabet.2007.11.006 [DOI] [PubMed] [Google Scholar]
- Borel B., Coquart J., Boitel G., Duhamel A., Matran R., Delsart P., et al. (2015). Effects of endurance training at the crossover point in women with metabolic syndrome. Med. Sci. Sports Exerc. 47, 2380–2388. 10.1249/MSS.0000000000000674 [DOI] [PubMed] [Google Scholar]
- Brun J. F., Halbeher C., Fédou C., Mercier J. (2011). What are the limits of normality of the LIPOXmax? can it be predict without exercise calorimetry? Sci. Sports 26, 166–169. 10.1016/j.scispo.2010.11.001 [DOI] [Google Scholar]
- Burgomaster K. A., Cermak N. M., Phillips S. M., Benton C. R., Bonen A., Gibala M. J. (2007). Divergent response of metabolite transport proteins in human skeletal muscle after sprint interval training and detraining. Am. J. Physiol. Regul. Integr. Comp. Physiol. 292: R1970–R1976. 10.1152/ajpregu.00503.2006 [DOI] [PubMed] [Google Scholar]
- Burgomaster K. A., Heigenhauser G. J. F., Gibala M. J. (2006). Effect of short-term sprint interval training on human skeletal muscle carbohydrate metabolism during exercise and time-trial performance. J. Appl. Physiol. 1, 2041–2047. 10.1152/japplphysiol.01220.2005 [DOI] [PubMed] [Google Scholar]
- Burgomaster K. A., Howarth K. R., Phillips S. M., Rakobochuk M., MacDonald M. J., McGee S. L., et al. (2008). Similar metabolic adaptations during exercise after low volume sprint interval and traditional endurance training in humans. J. Physiol. 586, 151–160. 10.1113/jphysiol.2007.142109 [DOI] [PMC free article] [PubMed] [Google Scholar]
- Burgomaster K. A., Hughes S. C., Heigenhauser G. J. F., Bradwell S. N., Gibala M. J. (2005). Six sessions of sprint interval training increases muscle oxidative potential and cycle endurance capacity in humans. J. Appl. Physiol. 98, 1985–1990. 10.1152/japplphysiol.01095.2004 [DOI] [PubMed] [Google Scholar]
- Burke L. M., Angus D. J., Cox G. R., Cummings N. K., Febbraio M. A., Gawthorn K., et al. (2000). Effect of Fat Adaptation and Carbohydrate Restoration on Metabolism and Performance during Prolonged Cycling. J. Appl. Physiol. 89:2413–2421. 10.1152/jappl.2000.89.6.2413 [DOI] [PubMed] [Google Scholar]
- Campbell S. E., Angus D. J., Febbraio M. A. (2001). Glucose kinetics and exercise performance during phases of the menstrual cycle: effect of glucose ingestion. Am. J. Physiol. Endocrinol. Metabol. 281:E817–E825. 10.1152/ajpendo.2001.281.4.E817 [DOI] [PubMed] [Google Scholar]
- Carey D. G. (2009). Quantifying differences in the “fat burning” zone and the aerobic zone: implications for training. J. Strength Cond. Res. 23, 2090–2095. 10.1519/JSC.0b013e3181bac5c5 [DOI] [PubMed] [Google Scholar]
- Casadio J. R., Kilding A. E., Cotter J. D., Laursen P. B. (2017). From lab to real world: heat acclimation considerations for elite athletes. Sports Med. 47, 1467–1476. 10.1007/s40279-016-0668-9 [DOI] [PubMed] [Google Scholar]
- Chenevière X., Borrani F., Sangsue D., Gojanovic B., Malatesta D. (2011). Gender differences in whole-body fat oxidation kinetics during exercise. Appl. Physiol. Nut. Metabol. 36, 88–95. 10.1139/H10-086 [DOI] [PubMed] [Google Scholar]
- Chenevière X., Malatesta D., Gojanovic B., Borrani F. (2010). Differences in whole-body fat oxidation kinetics between cycling and running. Eur. J. Appl. Physiol. 109, 1037–1045. 10.1007/s00421-010-1443-5 [DOI] [PubMed] [Google Scholar]
- Cohen J. (1977). Statistical Power for the Behavioural Sciences. Oxford, UK: Routledge. [Google Scholar]
- Croci I., Borrani F., Byrne N., Wood R., Hickman I., Chenevière X., et al. (2014a). Reproducibility of Fatmax and Fat Oxidation Rates during Exercise in Recreationally Trained Males. PLoS ONE 9:e97930. 10.1371/journal.pone.0097930 [DOI] [PMC free article] [PubMed] [Google Scholar]
- Croci I., Hickman I. J., Wood R. E., Borrani F., Macdonald G. A., Byrne N. M. (2014b). Fat Oxidation over a range of exercise intensities: fitness versus fatness. Appl. Physiol. Nutr. Metab. 39, 1352–1359. 10.1139/apnm-2014-0144 [DOI] [PubMed] [Google Scholar]
- Dandanell S., Husted K., Amdisen S., Vigelsø A., Dela F., Larsen S., et al. (2017a). Influence of maximal fat oxidation on long-term weight loss maintenance in humans. J. Appl. Physiol. 123, 267–274. 10.1152/japplphysiol.00270.2017 [DOI] [PubMed] [Google Scholar]
- Dandanell S., Præst C. B., Søndergård S. D., Skovberg C., Dela F., Larsen S., et al. (2017b). Determination of the exercise intensity that elicits maximal fat oxidation in individuals with obesity. Appl. Physiol. Nutr. Metab. 42, 405–412. 10.1139/apnm-2016-0518 [DOI] [PubMed] [Google Scholar]
- D'Eon T. M., Sharoff C., Chipkin S. R., Grow D., Ruby B. C., Braun B. (2002). Regulation of exercise carbohydrate metabolism by estrogen and progesterone in women. Am. J. Phys. Endocrinol. Metab. 283, E1046–E1055. 10.1152/ajpendo.00271.2002 [DOI] [PubMed] [Google Scholar]
- D'Eon T. M., Souza S. C., Aronovitz M., Obin M. S., Fried S. K., Greenberg A. S. (2005). Estrogen regulation of adiposity and fuel partitioning: evidence of genomic and non-genomic regulation of lipogenic and oxidative pathways. J. Biol. Chem. 280, 35983–35991. 10.1074/jbc.M507339200 [DOI] [PubMed] [Google Scholar]
- De Souza Silveira R., Carlsohn A., Langen G., Mayer F., Scharhag-Rosenberger F. (2016). Reliability and day-to-day variability of peak fat oxidation during treadmill ergometry. J. Int. Soc. Sports Nutr. 13:4 10.1186/s12970-016-0115-1 [DOI] [PMC free article] [PubMed] [Google Scholar]
- Devries M. C. (2016). Sex-based differences in endurance exercise muscle metabolism: impact on exercise and nutritional strategies to optimize health and performance in women. Exp. Physiol. 2, 243–249. 10.1113/EP085369 [DOI] [PubMed] [Google Scholar]
- Egan B., Dowling P., O'Connor P. L., Henry M., Meleady P., Zierath J. R., et al. (2011). 2-D DIGE analysis of the mitochondrial proteome from human skeletal muscle reveals time course-dependent remodelling in response to 14 consecutive days of endurance exercise training. Proteomics 11, 1413–1428. 10.1002/pmic.201000597 [DOI] [PubMed] [Google Scholar]
- Egan B., Zierath J. R. (2013). Exercise metabolism and the molecular regulation of skeletal muscle adaptation. Cell Metab. 17, 162–84. 10.1016/j.cmet.2012.12.012 [DOI] [PubMed] [Google Scholar]
- Febbraio M. A., Carey M. F., Snow R. J., Stathis C. G., Hargreaves M. (1996). Influence of elevated muscle temperature on metabolism during intense, dynamic exercise. Am. J. Physiol. Regul. Integr. Comp. Physiol. 271, R1251–R1255. 10.1152/ajpregu.1996.271.5.R1251 [DOI] [PubMed] [Google Scholar]
- Febbraio M. A., Lambert D. L., Starkie R. L., Proietto J., Hargreaves M. (1998). Effect of epinephrine on muscle glycogenolysis during exercise in trained men. J. Appl. Physiol. 84, 465–470. 10.1152/jappl.1998.84.2.465 [DOI] [PubMed] [Google Scholar]
- Febbraio M. A., Snow R. J., Hargreaves M., Stathis C. G., Martin I. K., Carey M. F. (1994a). Muscle metabolism during exercise and heat stress in trained men: effect of acclimation. J. Appl. Physiol. 76, 589–597. 10.1152/jappl.1994.76.2.589 [DOI] [PubMed] [Google Scholar]
- Febbraio M. A., Snow R. J., Stathis C. G., Hargreaves M., Carey M. F. (1994b). Effect of heat stress on muscle energy metabolism during exercise. J. Appl. Physiol. 77, 2827–2831. 10.1152/jappl.1994.77.6.2827 [DOI] [PubMed] [Google Scholar]
- Fletcher G., Eves F. F., Glover E. I., Robinson S. L., Vernooij C. A., Thompson J. L., et al. (2017). Dietary intake is independently associated with the maximal capacity for fat oxidation during exercise. Am. J. Clini. Nutr. 105, 864–872. 10.3945/ajcn.116.133520 [DOI] [PMC free article] [PubMed] [Google Scholar]
- Frandsen J., Vest S., Larsen S., Dela F., Helge J. W. (2017). Maximal fat oxidation is related to performance in an ironman triathlon. Int. J. Sports Med. 38, 975–982. 10.1055/s-0043-117178 [DOI] [PubMed] [Google Scholar]
- Fritz I. B., Yue K. T. N. (1963). Long-chain carnitine acyl-transferase and the role of acylcarnitine derivatives in the catalytic increase of fatty acid oxidation induced by carnitine. J. Lipid Res. 4, 279–88. [PubMed] [Google Scholar]
- Gagnon D. D., Rintamäki H., Gagnon S. S., Cheung S. S., Herzig K. H., Porvari K., et al. (2013). Cold exposure enhances fat utilization but not non-esterified fatty acids, glycerol or catecholamines availability during submaximal walking and running. Front. Physiol. 4:99. 10.3389/fphys.2013.00099 [DOI] [PMC free article] [PubMed] [Google Scholar]
- Galloway S. D. R., Maughan R. J. (1997). Effects of ambient temperature on the capacity to perform prolonged cycle exercise in man. Med. Sci. Sports Exerc. 29, 1240–1249. 10.1097/00005768-199709000-00018 [DOI] [PubMed] [Google Scholar]
- Gibala M. J., Little J. P., van Essen M., Wilkin G. P., Burgomaster K. A., Safdar A., et al. (2006). Short-term sprint interval versus traditional endurance training: similar initial adaptations in human skeletal muscle and exercise performance. J. Physiol. 575, 901–911. 10.1113/jphysiol.2006.112094 [DOI] [PMC free article] [PubMed] [Google Scholar]
- Gmada N., Marzouki H., Haboubi M., Tabka Z., Shephard R. J., Bouhlel E. (2012). Crossover and maximal fat-oxidation points in sedentary healthy subjects: methodological issues. Diabetes Metab. 38, 40–45. 10.1016/j.diabet.2011.07.004 [DOI] [PubMed] [Google Scholar]
- González-Haro C. (2011). Maximal fat oxidation rate and cross-over point with respect to lactate thresholds do not have good agreement. Int. J. Sports Med. 32, 379–385. 10.1055/s-0031-1271763 [DOI] [PubMed] [Google Scholar]
- Gonzalez-Haro C., Galilea P. A., Gonzalez-de-Suso J. M., Drobnic F., Escanero J. F., Chander M. (2007). Maximal lipidic power in high competitive level triathletes and cyclists. Br. J. Sports Med. 41, 23–28. 10.1136/bjsm.2006.029603 [DOI] [PMC free article] [PubMed] [Google Scholar]
- González J. G. P., Guadalupe-Grau A., González F. G. R., Peralta R. T., Morales-Alamo D., Rodríguez-García L., et al. (2017). Androgen receptor gene polymorphisms and maximal fat oxidation in healthy men: a longitudinal study. Nutr. Hosp. 34, 1089–98. 10.20960/nh.885 [DOI] [PubMed] [Google Scholar]
- Gonzalez J. T., Fuchs C. J., Betts J. A., van Loon L. J. C. (2016). Liver glycogen metabolism during and after prolonged endurance-type exercise. Am. J. Physiol. Endocrinol. Metab. 311, E543–E553. 10.1152/ajpendo.00232.2016 [DOI] [PubMed] [Google Scholar]
- Granata C., Oliveira R. S. F., Little J. P., Renner K., Bishop D. J. (2016a). Mitochondrial adaptations to high-volume exercise training are rapidly reversed after a reduction in training volume in human skeletal muscle. FASEB J. 30, 3413–3423. 10.1096/fj.201500100R [DOI] [PubMed] [Google Scholar]
- Granata C., Oliveira R. S. F., Little J. P., Renner K., Bishop D. J. (2016b). Training intensity modulates changes in PGC-1α and p53 protein content and mitochondrial respiration, but not markers of mitochondrial content in human skeletal muscle. FASEB J. 30, 959–970. 10.1096/fj.15-276907 [DOI] [PubMed] [Google Scholar]
- Guadalupe-Grau A., Plenge U., Helbo S., Kristensen M., Andersen P. R., Fago A., et al. (2014). Effects of an 8-Weeks erythropoietin treatment on mitochondrial and whole body fat oxidation capacity during exercise in healthy males. J. Sports Sci. 33, 570–578. 10.1080/02640414.2014.951872 [DOI] [PubMed] [Google Scholar]
- Harber M. P., Kaminsky L. A., Arena R., Blair S. N., Franklin B. A., Myers J., et al. (2017). Impact of cardiorespiratory fitness on all-cause and disease-specific mortality: advances since 2009. Prog. Cardiovasc. Dis. 60, 11–20. 10.1016/j.pcad.2017.03.001 [DOI] [PubMed] [Google Scholar]
- Hargreaves M., Angus D., Howlett K., Conus N. M., Febbraio M. A. (1996a). Effect of heat stress on glucose kinetics during exercise. J. Appl. Physiol. 81, 1594–1597. 10.1152/jappl.1996.81.4.1594 [DOI] [PubMed] [Google Scholar]
- Hargreaves M., Dillo P., Angus D., Febbraio M. (1996b). Effect of fluid ingestion on muscle metabolism during prolonged exercise. J. Appl. Physiol. 80, 363–366. 10.1152/jappl.1996.80.1.363 [DOI] [PubMed] [Google Scholar]
- Hargreaves M., McConell G., Proietto J. (1995). Influence of muscle glycogen on glycogenolysis and glucose uptake during exercise in humans. J. Appl. Physiol. 78, 288–292. 10.1152/jappl.1995.78.1.288 [DOI] [PubMed] [Google Scholar]
- Haufe S., Engeli S., Budziarek P., Utz W., Schulz-Menger J., Hermsdorf M., et al. (2010). Determinants of exercise-induced fat oxidation in obese women and men. Horm. Metab. Res. 42, 215–221. 10.1055/s-0029-1242745 [DOI] [PubMed] [Google Scholar]
- Hermansen L., Hultman E., Saltin B. (1967). Muscle glycogen during prolonged severe exercise. Acta Physiol. Scand. 71, 129–139. 10.1111/j.1748-1716.1967.tb03719.x [DOI] [PubMed] [Google Scholar]
- Holloszy J. O. (2011). Regulation of mitochondrial biogenesis and GLUT4 expression by exercise. Comp. Physiol. 1, 921–940. 10.1002/cphy.c100052 [DOI] [PubMed] [Google Scholar]
- Hoppeler H., Howald H., Conley K., Lindstedt S. L., Claassen H., Vock P., et al. (1985). Endurance training in humans: aerobic capacity and structure of skeletal muscle. J. Appl. Physiol. 59, 320–327. 10.1152/jappl.1985.59.2.320 [DOI] [PubMed] [Google Scholar]
- Horowitz J. F., Mora-Rodriguez R., Byerley L. O., Coyle E. F. (1997). Lipolytic suppression following carbohydrate ingestion limits fat oxidation during exercise. Am. J. Physiol. Endocrinol. Metab. 273, E768–E775. 10.1152/ajpendo.1997.273.4.E768 [DOI] [PubMed] [Google Scholar]
- Howald H., Hoppeler H., Claassen H., Mathieu O., Straub R. (1985). Influences of endurance training on the ultrastructural composition of the different muscle fiber types in humans. Pflug. Archiv. Eur. J. Physiol. 403, 369–376. 10.1007/BF00589248 [DOI] [PubMed] [Google Scholar]
- Hulston C. J., Venables M. C., Mann C. H., Martin C., Philp A., Baar K., et al. (2010). Training with low muscle glycogen enhances fat metabolism in well-trained cyclists. Med. Sci. Sports Exerc. 42, 2046–2055. 10.1249/MSS.0b013e3181dd5070 [DOI] [PubMed] [Google Scholar]
- Hultman E. (1967). Physiological role of muscle glycogen in man, with special reference to exercise. Circ. Res. 20(3 Suppl. 1), I99–114. [PubMed] [Google Scholar]
- Hultman E., Bergström J. (1967). Muscle glycogen synthesis in relation to diet studied in normal subjects. Acta Med. Scand. 182, 109–117. 10.1111/j.0954-6820.1967.tb11504.x [DOI] [PubMed] [Google Scholar]
- Ipavec-Levasseur S., Croci I., Choquette S., Byrne N. M., Cowin G., O'Moore-Sullivan T. M., et al. (2015). Effect of 1-H moderate-intensity aerobic exercise on intramyocellular lipids in obese men before and after a lifestyle intervention. Appl. Physiol. Nutr. Metab. 40, 1262–1268. 10.1139/apnm-2015-0258 [DOI] [PubMed] [Google Scholar]
- Isacco L., Thivel D., Pereira B., Duclos M., Boisseau N. (2015). Maximal fat oxidation, but not aerobic capacity, is affected by oral contraceptive use in young healthy women. Eur. J. Appl. Physiol. 115, 937–945. 10.1007/s00421-014-3075-7 [DOI] [PubMed] [Google Scholar]
- Jensen J., Rustad P. I., Kolnes A. J., Lai Y. C. (2011). The role of skeletal muscle glycogen breakdown for regulation of insulin sensitivity by exercise. Front. Physiol. 2:112. 10.3389/fphys.2011.00112 [DOI] [PMC free article] [PubMed] [Google Scholar]
- Jeukendrup A. E., Wallis G. A. (2005). Measurement of substrate oxidation during exercise by means of gas exchange measurements. Int. J. Sports Med. 26(1 Suppl. 1), S28–37. 10.1055/s-2004-830512 [DOI] [PubMed] [Google Scholar]
- Knechtle B., Müller C., Willmann F., Kotteck K., Eser P., Knecht H. (2004). Fat oxidation in men and women endurance athletes in running and cycling. Int. J. Sports Med. 25, 38–44. 10.1055/s-2003-45232 [DOI] [PubMed] [Google Scholar]
- Lambert K. C., Aguer M., Kitzmann C., Fédou C., Raynaud De Mauverger E., et al. (2017). Whole-body lipid oxidation during exercise is correlated to insulin sensitivity and mitochondrial function in middle-aged obese men. Austin Diabetes Res. 2, 1–7. [Google Scholar]
- Lanzi S., Codecasa F., Cornacchia M., Maestrini S., Capodaglio P., Brunani A., et al. (2015). Short-term HIIT and fatmax training increase aerobic and metabolic fitness in men with class II, and III Obesity. Obesity 23, 1987–1994. 10.1002/oby.21206 [DOI] [PubMed] [Google Scholar]
- Lanzi S., Codecasa F., Cornacchia M., Maestrini S., Salvadori A., Brunani A., et al. (2014). Fat oxidation, hormonal and plasma metabolite kinetics during a submaximal incremental test in lean and obese adults. PLoS ONE 9:e88707. 10.1371/journal.pone.0088707 [DOI] [PMC free article] [PubMed] [Google Scholar]
- Layden D. D., Patterson M. J., Nimmo M. A. (2002). Effects of reduced ambient temperature on fat utilization during submaximal exercise. Med. Sci. Sports Exerc. 34, 774–779. 10.1097/00005768-200205000-00008 [DOI] [PubMed] [Google Scholar]
- Lima-Silva A. E., Bertuzzi R. C. M., Pires F. O., Gagliardi J. F. L., Barros R. V., Hammond J., et al. (2010). Relationship between training status and maximal fat oxidation rate. J. Sports Sci. Med. 9, 31–35. [PMC free article] [PubMed] [Google Scholar]
- Marchand I., Tarnopolsky M. A., Adamo K. B., Bourgeois J. M., Chorneyko K., Graham T. E. (2007). Quantitative assessment of human muscle glycogen granules size and number in subcellular locations during recovery from prolonged exercise. J. Physiol. 580, 617–628. 10.1113/jphysiol.2006.122457 [DOI] [PMC free article] [PubMed] [Google Scholar]
- Marzouki H., Farhani Z., Gmada N., Tabka Z., Shephard R. J., Bouhlel E. (2014). Relative and absolute reliability of the crossover and maximum fat oxidation points during treadmill running. Sci. Sports 29, e107–e114. 10.1016/j.scispo.2014.07.013 [DOI] [Google Scholar]
- McBride H. M., Neuspiel M., Wasiak S. (2006). Mitochondria: more than just a powerhouse. Curr. Biol. 16, 551–560. 10.1016/j.cub.2006.06.054 [DOI] [PubMed] [Google Scholar]
- McCaig R. H., Gooderson C. Y. (1986). Ergonomic and physiological aspects of military operations in a cold wet climate. Ergonomics 29, 849–857. 10.1080/00140138608967197 [DOI] [PubMed] [Google Scholar]
- McLaughlin J. E., Howley E. T., Bassett D. R., Jr., Thompson D. L., Fitzhugh E. C. (2010). Test of the classic model for predicting endurance running performance. Med. Sci. Sports Exerc. 42, 991–997. 10.1249/MSS.0b013e3181c0669d [DOI] [PubMed] [Google Scholar]
- Meyer C., Dostou J. M., Welle S. L., Gerich J. E. (2002). Role of human liver, kidney, and skeletal muscle in postprandial glucose homeostasis. Am. J. Physiol. Endocrinol. Metab. 282, E419–E427. 10.1152/ajpendo.00032.2001 [DOI] [PubMed] [Google Scholar]
- Meyer T., Folz C., Rosenberger F., Kindermann W. (2009). The reliability of fatmax. Scandinav. J. Med. Sci. Sports 19, 213–221. 10.1111/j.1600-0838.2008.00775.x [DOI] [PubMed] [Google Scholar]
- Mogensen M., Vind B. F., Højlund K., Beck-Nielsen H., Sahlin K. (2009). Maximal lipid oxidation in patients with Type 2 diabetes is normal and shows an adequate increase in response to aerobic training. Diabetes, Obes. Metab. 11, 874–883. 10.1111/j.1463-1326.2009.01063.x [DOI] [PubMed] [Google Scholar]
- Mohebbi H., Nourshahi M., Ghasemikaram M., Safarimosavi S. (2015). Effects of exercise at individual anaerobic threshold and maximal fat oxidation intensities on plasma levels of nesfatin-1 and metabolic health biomarkers. J. Physiol. Biochem. 71, 79–88. 10.1007/s13105-015-0383-2 [DOI] [PubMed] [Google Scholar]
- Montero D., Cathomen A., Jacobs R. A., Flück D., de Leur J., Keiser S., et al. (2015). Haematological rather than skeletal muscle adaptations contribute to the increase in peak oxygen uptake induced by moderate endurance training. J. Physiol. 593, 4677–4688. 10.1113/JP270250 [DOI] [PMC free article] [PubMed] [Google Scholar]
- Mora-Rodríguez R., Sanchez-Roncero A., Fernández-Elías V. E., Guadalupe-Grau A., Ortega J. F., Dela F., et al. (2016). Aerobic exercise training increases muscle water content in obese middle-age men. Med. Sci. Sports Exerc. 48, 822–828. 10.1249/MSS.0000000000000848 [DOI] [PubMed] [Google Scholar]
- Nielsen J., Cheng A. J., Ørtenblad N., Westerblad H. (2014). Subcellular distribution of glycogen and decreased tetanic Ca2+ in fatigued single intact mouse muscle fibres. J. Physiol. 592, 2003–2012. 10.1113/jphysiol.2014.271528 [DOI] [PMC free article] [PubMed] [Google Scholar]
- Nielsen J., Holmberg H. C., Schrøder H. D., Saltin B., Ørtenblad N. (2011). Human skeletal muscle glycogen utilization in exhaustive exercise: role of subcellular localization and fibre type. J. Physiol. 589, 2871–2885. 10.1113/jphysiol.2010.204487 [DOI] [PMC free article] [PubMed] [Google Scholar]
- Nielsen J., Schrøder H. D., Rix C. G., Ørtenblad N. (2009). Distinct effects of subcellular glycogen localization on tetanic relaxation time and endurance in mechanically skinned rat skeletal muscle fibres. J. Physiol. 587, 3679–3690. 10.1113/jphysiol.2009.174862 [DOI] [PMC free article] [PubMed] [Google Scholar]
- Nilsson L. H. (1973). Liver glycogen content in man in the postabsorptive state. Scand. J. Clin. Lab. Invest. 32, 317–323. 10.3109/00365517309084354 [DOI] [PubMed] [Google Scholar]
- Nilsson L. H., Fürst P., Hultman E. (1973). Carbohydrate metabolism of the liver in normal man under varying dietary conditions. Scand. J. Clin. Lab. Invest. 32, 331–337. 10.3109/00365517309084356 [DOI] [PubMed] [Google Scholar]
- Nordby P., Rosenkilde M., Ploug T., Westh K., Feigh M., Nielsen N., et al. (2015). Independent effects of endurance training and weight loss on peak fat oxidation in moderately overweight men: a randomized controlled trial. J. Appl. Physiol. 118, 803–810. 10.1152/japplphysiol.00715.2014 [DOI] [PubMed] [Google Scholar]
- Nordby P., Saltin B., Helge J. W. (2006). Whole-body fat oxidation determined by graded exercise and indirect calorimetry: a role for muscle oxidative capacity? Scandinav. J. Med. Sci. Sports 16, 209–214. 10.1111/j.1600-0838.2005.00480.x [DOI] [PubMed] [Google Scholar]
- Ørtenblad N., Nielsen J., Saltin B., Holmberg H. C. (2011). Role of glycogen availability in sarcoplasmic reticulum Ca2+ kinetics in human skeletal muscle. J. Physiol. 589, 711–725. 10.1113/jphysiol.2010.195982 [DOI] [PMC free article] [PubMed] [Google Scholar]
- Ørtenblad N., Westerblad H., Nielsen J. (2013). Muscle glycogen stores and fatigue. J. Physiol. 591, 4405–4413. 10.1113/jphysiol.2013.251629 [DOI] [PMC free article] [PubMed] [Google Scholar]
- Oosthuyse T., Bosch A. N. (2010). The effect of the menstrual cycle on exercise metabolism: implications for exercise performance in eumenorrhoeic women. Sports Med. 40, 207–227. 10.2165/11317090-000000000-00000 [DOI] [PubMed] [Google Scholar]
- Ørtenblad N., Nielsen J. (2015). Muscle glycogen and cell function - location, location, location. Scandinav. J. Med. Sci. Sports 25(Suppl. 4), 34–40. 10.1111/sms.12599 [DOI] [PubMed] [Google Scholar]
- Orr R. M., Johnston V., Coyle J., Pope R. (2015). Reported load carriage injuries of the australian army soldier. J. Occupat. Rehab. 25 (2). Springer US: 316–22. [DOI] [PubMed] [Google Scholar]
- Oz G., Henry P. G., Seaquist E. R., Gruetter R. (2003). Direct, noninvasive measurement of brain glycogen metabolism in humans. Neurochem. Int. 43, 323–329. 10.1016/S0197-0186(03)00019-6 [DOI] [PubMed] [Google Scholar]
- Parkin J. M., Carey M. F., Zhao S., Febbraio M. A. (1999). Effect of ambient temperature on human skeletal muscle metabolism during fatiguing submaximal exercise. J. Appl. Physiol. 86, 902–908. 10.1152/jappl.1999.86.3.902 [DOI] [PubMed] [Google Scholar]
- Pérez-Martin A., Dumortier M., Raynaud E., Brun J. F., Fédou C., Bringer J., et al. (2001). Balance of substrate oxidation during submaximal exercise in lean and obese people. Diabetes Metab. 27, 466–74. [PubMed] [Google Scholar]
- Perry C. G. R., Heigenhauser G. J. F., Bonen A., Spriet L. L. (2008). High-intensity aerobic interval training increases fat and carbohydrate metabolic capacities in human skeletal muscle. Appl. Physiol. Nutr. Metab. 33, 1112–1123. 10.1139/H08-097 [DOI] [PubMed] [Google Scholar]
- Phinney S. D., Bistrian B. R., Evans W. J., Gervino E., Blackburn G. L. (1983). The human metabolic response to chronic ketosis without caloric restriction: preservation of submaximal exercise capability with reduced carbohydrate oxidation. Metab. Clin. Exp. 32, 769–776. 10.1016/0026-0495(83)90106-3 [DOI] [PubMed] [Google Scholar]
- Purdom T., Kravitz L., Dokladny K., Mermier C. (2018). Understanding the factors that effect maximal fat oxidation. J. Int. Soc. Sports Nutr. 15:3. 10.1186/s12970-018-0207-1 [DOI] [PMC free article] [PubMed] [Google Scholar]
- Racinais S., Alonso J. M., Coutts A. J., Flouris A. D., Girard O., González-Alonso J., et al. (2015). Consensus recommendations on training and competing in the heat. Br. J. Sports Med. 49, 1164–1173. 10.1136/bjsports-2015-094915 [DOI] [PMC free article] [PubMed] [Google Scholar]
- Randell R. K., Rollo I., Roberts T. J., Dalrymple K. J., Jeukendrup A. E., Carter J. M. (2017). Maximal fat oxidation rates in an athletic population. Med. Sci. Sports Exerc. 49, 133–140. 10.1249/MSS.0000000000001084 [DOI] [PubMed] [Google Scholar]
- Rigden D. J., Jellyman A. E., Frayn K. N., Coppack S. W. (1990). Human adipose tissue glycogen levels and responses to carbohydrate feeding. Eur. J. Clin. Nutr. 44, 689–92. [PubMed] [Google Scholar]
- Robinson S. L., Hattersley J., Frost G. S., Chambers E. S., Wallis G. A. (2015). Maximal fat oxidation during exercise is positively associated with 24-hour fat oxidation and insulin sensitivity in young, healthy men. J. Appl. Physiol. 118, 1415–1422. 10.1152/japplphysiol.00058.2015 [DOI] [PubMed] [Google Scholar]
- Romijn J. A., Coyle E. F., Sidossis L. S., Zhang X. J., Wolfe R. R. (1995). Relationship between fatty acid delivery and fatty acid oxidation during strenuous exercise. J. Appl. Physiol. 79, 1939–1945. 10.1152/jappl.1995.79.6.1939 [DOI] [PubMed] [Google Scholar]
- Romijn J. A., Gastaldelli A., Horowitz J. F., Endert E., Wolfe R. R. (1993). Regulation of endogenous fat and carbohydrate metabolism in relation to exercise intensity and duration. Am. J. Physiol. Endocrinol. Metab. 265, 380–391. 10.1152/ajpendo.1993.265.3.E380 [DOI] [PubMed] [Google Scholar]
- Rosenkilde M. P., Nordby L. B., Nielsen B. M., Stallknecht Helge J. W. (2010). Fat oxidation at rest predicts peak fat oxidation during exercise and metabolic phenotype in overweight men. Int. J. Obes. 34, 871–77. 10.1038/ijo.2010.11 [DOI] [PubMed] [Google Scholar]
- Rosenkilde M., Reichkendler M. H., Auerbach P., Bonne T. C., Sjödin A., Ploug T., et al. (2015). Changes in peak fat oxidation in response to different doses of endurance training. Scandinav. J. Med. Sci. Sports 25, 41–52. 10.1111/sms.12151 [DOI] [PubMed] [Google Scholar]
- Ross R., Blair S. N., Arena R., Church T. S., Després J. P., Franklin B. A., et al. (2016). Importance of assessing cardiorespiratory fitness in clinical practice: a case for fitness as a clinical vital sign: a scientific statement from the american heart association. Circulation 134. e653–e699. 10.1161/CIR.0000000000000461 [DOI] [PubMed] [Google Scholar]
- Sahlin K., Harris R. C., Nylind B., Hultman E. (1976). Lactate Content and pH in muscle samples obtained after dynamic exercise. Pflugers Archiv. Eur. J. Physiol. 367, 143–149. 10.1007/BF00585150 [DOI] [PubMed] [Google Scholar]
- Sahlin K. M., Mogensen M., Bagger M., Fernstro Pedersen P. K. (2007). The potential for mitochondrial fat oxidation in human skeletal muscle influences whole body fat oxidation during low-intensity exercise. Am. J. Physiol. 292, E223–E230. 10.1152/ajpendo.00266.2006 [DOI] [PubMed] [Google Scholar]
- Scalzo R. L., Peltonen G. L., Binns S. E., Shankaran M., Giordano G. R., Hartley D. A., et al. (2014). Greater muscle protein synthesis and mitochondrial biogenesis in males compared with females during sprint interval training. FASEB J. 28, 2705–2714. 10.1096/fj.13-246595 [DOI] [PubMed] [Google Scholar]
- Schubert M. M., Clarke H. E., Seay R. F., Spain K. K. (2017). Impact of 4 weeks of interval training on resting metabolic rate, fitness, and health-related outcomes. Appl. Physiol. Nutr. Metab. 42, 1073–1081. 10.1139/apnm-2017-0268 [DOI] [PubMed] [Google Scholar]
- Schwindling S., Kindermann W., Meyer T. (2014). Limited benefit of fatmax-test to derive training prescriptions. Int. J. Sports Med. 35, 280–285. 10.1055/s-0033-1349106 [DOI] [PubMed] [Google Scholar]
- Sidossis L. S., Gastaldelli A., Klein S., Wolfe R. R. (1997). Regulation of Plasma Fatty Acid Oxidation during Low- and High-Intensity Exercise. Am. J. Physiol. 272, E1065–E1070. 10.1152/ajpendo.1997.272.6.E1065 [DOI] [PubMed] [Google Scholar]
- Snyder A. C., O'Hagan K. P., Clifford P. S., Hoffmann M. D., Foster C. (1993). Exercise responses to in-line skating: comparisons to running and cycling. Int. J. Sports Med. 14, 38–42. 10.1055/s-2007-1021143 [DOI] [PubMed] [Google Scholar]
- Soenen S., Plasqui G., Smeets A. J., Westerterp-Plantenga M. S. (2010). Protein intake induced an increase in exercise stimulated fat oxidation during stable body weight. Physiol. Behav. 101, 770–774. 10.1016/j.physbeh.2010.08.019. [DOI] [PubMed] [Google Scholar]
- Spina R. J., Chi M. M., Hopkins M. G., Nemeth P. M., Lowry O. H., Holloszy J. O. (1996). Mitochondrial enzymes increase in muscle in response to 7-10 days of cycle exercise. J. Appl. Physiol. 80, 2250–2254. 10.1152/jappl.1996.80.6.2250 [DOI] [PubMed] [Google Scholar]
- Spriet L. L. (2014). New insights into the interaction of carbohydrate and fat metabolism during exercise. Sports Med. 44(Suppl. 1), 87–96. 10.1007/s40279-014-0154-1 [DOI] [PMC free article] [PubMed] [Google Scholar]
- Starkie R. L., Hargreaves M., Lambert D. L., Proietto J., Febbraio M. A. (1999). Effects of temperature on muscle metabolism during submaximal exercise in humans. Exp. Physiol. 84, 775–784. 10.1111/j.1469-445X.1999.01815.x [DOI] [PubMed] [Google Scholar]
- Starritt E. C., Howlett R. A., Heigenhauser G. J. F., Spriet L. L. (2000). Sensitivity of CPT I to malonyl-CoA in trained and untrained human skeletal muscle. Am. J. Physiol. 278, E462–E468. 10.1152/ajpendo.2000.278.3.E462 [DOI] [PubMed] [Google Scholar]
- Stisen A. B., Stougaard O., Langfort J., Helge J. W., Sahlin K., Madsen K. (2006). Maximal fat oxidation rates in endurance trained and untrained women. Eur. J. Appl. Physiol. 98, 497–506. 10.1007/s00421-006-0290-x [DOI] [PubMed] [Google Scholar]
- Talanian J. L., Galloway S. D. R., Heigenhauser G. J. F., Bonen A., Spriet L. L. (2007). Two weeks of high-intensity aerobic interval training increases the capacity for fat oxidation during exercise in women. J. Appl. Physiol. 102, 1439–1447. 10.1152/japplphysiol.01098.2006 [DOI] [PubMed] [Google Scholar]
- Talanian J. L., Holloway G. P., Snook L. A., Heigenhauser G. J. F., Bonen A., Spriet L. L. (2010). Exercise training increases sarcolemmal and mitochondrial fatty acid transport proteins in human skeletal muscle. Am. J. Physiol. 299, E180–E188. 10.1152/ajpendo.00073.2010 [DOI] [PubMed] [Google Scholar]
- Tan S., Wang J., Cao L., Guo Z., Wang Y. (2016). Positive effect of exercise training at maximal fat oxidation intensity on body composition and lipid metabolism in overweight middle-aged women. Clin. Physiol. Funct. Imaging 36, 225–230. 10.1111/cpf.12217 [DOI] [PubMed] [Google Scholar]
- Tolfrey K., Jeukendrup A. E., Batterham A. M. (2010). Group- and individual-level coincidence of the “Fatmax” and lactate accumulation in adolescents. Eur. J. Appl. Physiol. 109, 1145–1153. 10.1007/s00421-010-1453-3 [DOI] [PubMed] [Google Scholar]
- Tsujimoto T., Sasai H., Miyashita M., Eto M., So R., Ohkubo H., et al. (2012). Effect of weight loss on maximal fat oxidation rate in obese men. Obesity Research and Clinical Practice 6 (2). Asia Oceania Assoc. for the Study of Obesity: e111–19. [DOI] [PubMed] [Google Scholar]
- van Loon L. J. C., Greenhaff P. L., Constantin-Teodosiu D., Saris W. H. M., Wagenmakers A. J. M. (2001). The effects of increasing exercise intensity on muscle fuel utilisation in humans. J. Physiol. 536, 295–304. 10.1111/j.1469-7793.2001.00295.x [DOI] [PMC free article] [PubMed] [Google Scholar]
- van Loon L. J. C., Jeukendrup A. E., Saris W. H., Wagenmakers A. J. (1999). Effect of training status on fuel selection during submaximal exercise with glucose ingestion. J. Appl. Physiol. 87, 1413–1420. 10.1152/jappl.1999.87.4.1413 [DOI] [PubMed] [Google Scholar]
- Venables M. C., Achten J., Jeukendrup A. E. (2005). Determinants of fat oxidation during exercise in healthy men and women: a cross-sectional study. J. Appl. Physiol. 98, 160–167. 10.1152/japplphysiol.00662.2003 [DOI] [PubMed] [Google Scholar]
- Venables M. C., Jeukendrup A. E. (2008). Endurance training and obesity: effect on substrate metabolism and insulin sensitivity. Med. Sci. Sports Exerc. 40, 495–502. 10.1249/MSS.0b013e31815f256f [DOI] [PubMed] [Google Scholar]
- Volek J. S., Freidenreich D. J., Saenz C., Kunces L. J., Creighton B. C., Bartley J. M., et al. (2016). Metabolic characteristics of keto-adapted ultra-endurance runners. Metabolism 65, 100–110. 10.1016/j.metabol.2015.10.028 [DOI] [PubMed] [Google Scholar]
- Wang C. H., Wang C. C., Wei Y. H. (2010). Mitochondrial dysfunction in insulin insensitivity: implication of mitochondrial role in type 2 diabetes. Ann. N. Y. Acad. Sci. U.S.A. 1201, 157–165. 10.1111/j.1749-6632.2010.05625.x [DOI] [PubMed] [Google Scholar]
- Wasserman D. H. (2009). Four Grams of Glucose. Am. J. Physiol. 296, E11–E21. 10.1152/ajpendo.90563.2008 [DOI] [PMC free article] [PubMed] [Google Scholar]
- Webster C. C., Noakes T. D., Chacko S. K., Swart J., Kohn T. A., Smith J. A. H. (2016). Gluconeogenesis during endurance exercise in cyclists habituated to a long-term low carbohydrate high-fat diet. J. Physiol. 594, 4389–4405. 10.1113/JP271934 [DOI] [PMC free article] [PubMed] [Google Scholar]
- Wu Y. T., Wu S. B., Wei Y. H. (2014). Metabolic reprogramming of human cells in response to oxidative stress: implications in the pathophysiology and therapy of mitochondrial diseases. Curr. Pharm. Des. 20, 5510–5526. 10.2174/1381612820666140306103401 [DOI] [PubMed] [Google Scholar]
- Yeo W. K., Paton C. D., Garnham A. P., Burke L. M., Carey A. L., Hawley J. A. (2008). Skeletal muscle adaptation and performance responses to once a day versus twice every second day endurance training regimens. J. Appl. Physiol. 105, 1462–1470. 10.1152/japplphysiol.90882.2008 [DOI] [PubMed] [Google Scholar]
- Zurlo F., Lillioja S. A., Esposito-Del Puente A., Nyomba B. L., Raz I., Saad M. F., et al. (1990). Low ratio of fat to carbohydrate oxidation as predictor of weight gain: study of 24-H RQ. Am. J. Physiol. 259, E650–E657. 10.1152/ajpendo.1990.259.5.E650 [DOI] [PubMed] [Google Scholar]