

Abstract
Background:
High sodium intake is a major public health concern. Sodium consumption pattern of West Indian population has never been reported before.
Objectives:
The cross-sectional study assessed sodium intake pattern by considering all possible dietary sources and spot urine sodium estimation among sedentary healthy adults of productive age group (35–55 years).
Materials and Methods:
Twenty-four-h dietary recall (3 alternative days in a week), food frequency assessment, weighing of table, and cooking salt (n = 218) were performed. Spot urine samples were collected for subset (n = 33) to quantify sodium excretion. Flame photometer “CL 361” was used for food sodium quantification.
Results:
Men had higher sodium intake than women (3.9 ± 0.4 vs. 3.8 ± 0.4 g/day). Significantly higher sodium intake among men was from processed ready to eat foods (0.8 ± 0.3 vs. 0.6 ± 0.1, P < 0.05) and among women was from cooking and table salt (2.6 ± 0.3 vs. 2.8 ± 0.3, P < 0.001). Lowest quartile (<25th percentile) intake of oral sodium consumption (2.4 ± 0.5 g/day) was higher than WHO safe recommendation level of <2 g/day. Late afternoon spot urine sodium content was used to predict 24-h sodium excretion (6.1 ± 0.5 g/day), in turn population level sodium intake estimation. Analyzed sodium content of most frequently consumed all ready to eat foods was found to be higher than the reported values.
Conclusion:
There is a strong need of evidence-based guidelines and policy formulation for national salt reduction program in India.
Keywords: India, sodium excretion, sodium intake, spot urine, West
INTRODUCTION
Sodium is an indispensable element for several physiological functions such as generation of nerve impulses, maintaining cell integrity, fluid and electrolyte balance, and further regulating vital homeostatic functions of the body.[1] In spite of being a significant contributor to support physiological equity, a number of epidemiological, migration, intervention, and genetic studies have identified sodium as a major modifiable risk factor for high blood pressure[2] and cardio vascular morbidity and mortality incidences.[3] A probability model developed by Basu et al. showed that with the present salt intake (8.5–15 g/day) status in India, more than 10 million case fatality from myocardial infarction, stoke, and other related diseases are expected to observe in the next 30 years.[4] However, the calculation was based on old database of region-specific salt intake, and nationwide extrapolations of such findings were unrealistic. We ascertained with limited information on sodium intake pattern, especially in West Indian context. Gujarat is one of the leading states in experiencing rapid urbanization[5] and a paradigm shift from traditional to processed and ready to eat food stuffs.[6] This suggests a need to assess sodium intake pattern of West Indian population to create an exhaustive evidence for strategic implementation of national-level salt reduction program for India.
MATERIALS AND METHODS
Study setting and sample size
Out of 33 districts of Gujarat, Vadodara was purposively selected for our study. Urban Vadodara was parted into five zones, and two societies were randomly selected from each zone. Equal number of sedentary male and female individuals (n = 218, male = 109, female = 109) aged between 25 and 55 years were interviewed from each society using systematic random sampling.
Tools and techniques
Socioeconomic status of the individuals was stratified by Prasad's updated classification.[7] Data were collected on all possible dietary sources of sodium. Standard methodology and pretested questionnaires were used to capture data on the past 24-h dietary intake in 3 alternative days (fasting or feasting days avoided) of a week and on frequency of processed and ready-made food consumption on daily/weekly/monthly basis. Regular usage of cooking and table salt was weighed out. Sodium quantitation was performed for most commonly consumed processed and ready-made food products (n = 24), using flame photometer “CL 361” (AOAC 969.23 method). Late evening spot urine samples (r = 0.86 in relation to 24-h urinary sodium) were collected in a subset for urinary sodium estimation (n = 33, 18 males, 15 females), to arrive at a precise estimate of population-level sodium intake[8,9] without creating burden on the participants. We extrapolated spot urine sodium content to 24-h value using the following equation:[9]
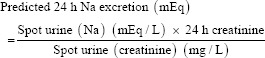
24-h urinary creatinine (mg/day) = −2.04 × age + 14.89 × weight (kg) +16.14 × height (cm) – 2244.45
Spot urinary sodium and creatinine estimations were performed using indirect potentiometer[10] and Jaffe rate method,[11] respectively.
We obtained ethical clearance from Institutional Ethical Committee of the M.S. University Baroda, Faculty of Family and Community Sciences, Gujarat, India. Written consent was taken from all the respondents.
Data analysis
Data were analyzed using MS excel and statistical software package SPSS (version 20.0; SPSS Inc., Chicago IL, USA). Nutritive value of Indian foods published by National Institute of Nutrition (NIN)[12] was used to analyze 24-h dietary recall data. An average of 3-day nutrient intake was calculated. Population was stratified based on different age groups and genders [Table 1]. Within gender comparison for estimated 24-h urinary sodium and creatinine excretion was carried out using independent t-test [Table 2]. Interquartile classification of the study sample based on sodium intake levels followed by ANOVA was performed to draw intergroup comparisons for body mass index (BMI), energy, and macronutrient intakes [Table 3]. All tests of significance were two-tailed, and P < 0.05, P < 0.01, and P < 0.001 were considered significant.
Table 1.
Assessment of dietary sodium consumption (g/day) of the population
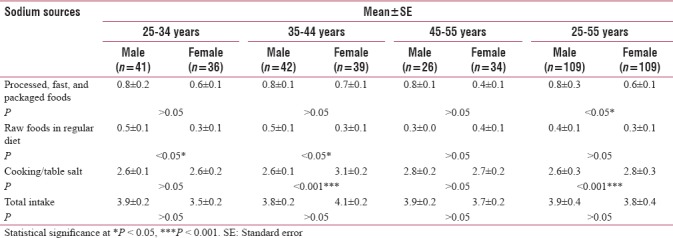
Table 2.
Estimation of urinary sodium and creatinine excretion among the study individuals
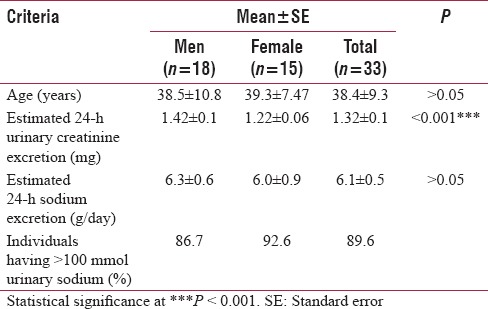
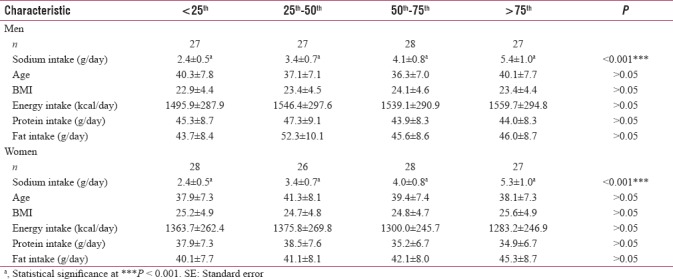
Table 3.
Population characteristics based on quartiles (percentile values) of daily oral sodium and macronutrients intake in men and women mean±standard error
RESULTS
Majority (45.9%) of the study individuals belonged to upper socioeconomic status based on per capita income on monthly basis. More than 90% of the surveyed individuals were having middle to upper class socioeconomic status. Female participants were older than men (39.3 ± 3.8 vs. 38.5 ± 3.7) and had higher BMI (25.1 ± 2.4 vs. 23.5 ± 2.2) (data not shown in the Table 1). Majority (45%) of the study population had at least 2–4 products in a week. We observed number of males (23%) having 5–7 products was double to females (11%). About 5% males were identified with a habit of having 14–16 products in a week while no female fell under this category (data not shown in the Table 1).
Daily sodium intake from different dietary sources is reported in Table 1. Between- and within-age group gender comparisons were performed. Male respondents of 25–34 years (0.8 ± 0.2 g/day) were the highest consumers of such products. 25–44-year-old men (0.5 ± 0.1 g/day) had significantly higher intake of sodium as compared to females when natural food sodium consumption was considered. On the contrary, cooking/table sodium consumption was significantly higher (3.1 ± 0.2 vs. 2.6 ± 0.1 g/day) among females than males. The study population had a total intake of 3.8 ± 0.4 g/day sodium, which corresponds to 9.5 ± 1.0 g/day salt. Gender-based stratification reported higher sodium excretion (>100 mmol/day) in 90% of study population, predominantly from 25 to 34 years age group [Table 2].
Population was stratified and compared based on interquartile classification of sodium consumption [Table 3]. Highest BMI was observed in third and fourth quartile of sodium intake for men and women, respectively, though the variations were nonsignificant. Sodium intake in men progressively increased with subsequent increment in energy intake. A similar scenario was observed in women for fat and sodium intake. About 33% and 37% of the respondents (data not shown in the Table 3) irrespective of age and gender could meet at least 75% of recommended daily energy and protein intake.[13] However, average fat intake was nearly double the recommendation across all the quartiles of sodium intake.[13]
Table 4 shows the analyzed and reported values of processed, fast, and packaged food products (n = 24). Figure 1 is the calibration curve established for sodium analysis in order to ensure accuracy and precision.
Table 4.
Quantified sodium (mg/day) of the analyzed foods
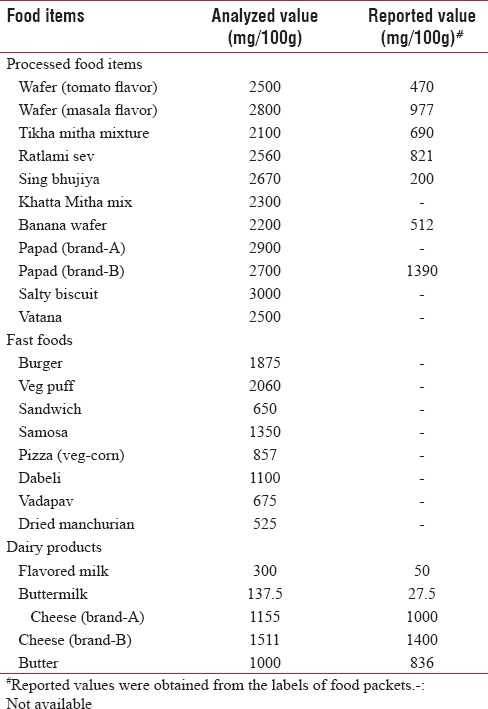
Figure 1.
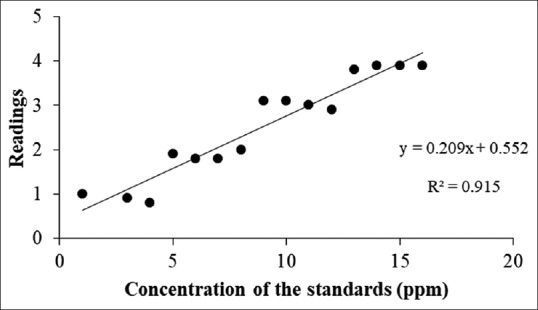
Calibration curve established for sodium analysis
DISCUSSION
In the current study, we tried to consider different dietary sources of sodium in an individual's diet to achieve a precise estimate of oral sodium intake. INTERSALT study reported median intake of sodium in 32 countries was 9.9 g/day, ranging from 0.1 g/day in Brazil and Yanamano to 15 g/day in China and Tanjin.[14] National and subnational surveys from 1986 to 2016 have reported sodium intake to be 1.4–7.8 g/day (5–19.4 g/day of salt intake) in the Indian context.[15,16] However, due to regional diversity of Indian cuisine, it is unlikely to consider such database as an indicative of national-level sodium intake pattern. The analyzed sodium content of most frequently consumed processed and packaged foods was found to be higher than the reported values mentioned in the labels, which suggests the need for reanalyzing these food stuffs with standard methodologies. Similar to previous study findings, we observed that mean sodium consumption from fast, processed, and packaged food items was double to the raw food stuffs.[17] Total sodium consumption of 4 g/day (twice to the WHO recommendation of 2 g/day) supported the intake level reported by studies across the nation.[15,16] The mean intake of sodium in the present study is within the range of worldwide intake level of 3.95 g/day.[18] In the present study, dietary sources confirmed that 96% of the study population had sodium intake beyond the safe consumption level recommended by WHO, which is in line with urinary sodium excretion values. Sodium consumption from processed and packaged foods was significantly higher among men as compared to women possibly due to rapid urbanization, eating out, and consumption of fast foods. The global burden of disease study identified excess salt intake to be the 7th leading risk factor of death for South East Asian Region.[19] This stresses the need for nutrition facts label on food and beverage packages in order to make low sodium food choices. Three decades of effort by Finland and Japan has shown 75% reduction in cardiovascular disease incidences with 30% reduction in sodium intake.[19] Further, He et al. reported >$32 billion in medical expenses can be saved in USA with 10% reduction sodium intake, supporting the cost-saving implications of salt reduction strategies.[20] In the present study, maximum BMI was observed in the third and fourth quartile of sodium intake, similar to the findings of several observational studies since INTERSALT[14] to the recent ones.[15,21] Self-reporting, recall bias, lack of analyzed sodium values of raw foods, and relatively smaller sample size could be the possible reasons for underestimated oral sodium intake as compared to urinary sodium excretion.[22] To ascertain these findings, a validation study between 24-h sodium excretion and late afternoon/early evening spot urine sodium excretion was required in subset. However, to the best of our knowledge, this is the first study that reported sodium intake pattern of West Indian population. Furthermore, the present study findings can be used as scientific evidence base, toward formulating and implementing national salt reduction program in the future. Strong government policies with industrial collaboration are needed to substantially reduce sodium from our daily platter. Longitudinal, observational, randomized clinical trials and validation studies are required to confirm these findings followed by establishing precise targets for sodium reduction among Indian population.
CONCLUSION
The present study findings can be used as scientific evidence base, toward formulating and implementing national salt reduction program in the future. Strong government policies with industrial collaboration are needed to substantially reduce sodium from our daily platter. Longitudinal, observational, randomized clinical trials and validation studies are required to confirm these findings followed by establishing precise targets for sodium reduction among Indian population.
Financial support and sponsorship
Nil.
Conflicts of interest
There are no conflicts of interest.
REFERENCES
- 1.Patel S. Sodium balance-an integrated physiological model and novel approach. Saudi J Kidney Dis Transpl. 2009;20:560–9. [PubMed] [Google Scholar]
- 2.Ha SK. Dietary salt intake and hypertension. Electrolyte Blood Press. 2014;12:7–18. doi: 10.5049/EBP.2014.12.1.7. [DOI] [PMC free article] [PubMed] [Google Scholar]
- 3.O'Donnell M, Mente A, Yusuf S. Sodium intake and cardiovascular health. Circ Res. 2015;116:1046–57. doi: 10.1161/CIRCRESAHA.116.303771. [DOI] [PubMed] [Google Scholar]
- 4.Basu S, Stuckler D, Vellakkal S, Ebrahim S. Dietary salt reduction and cardiovascular disease rates in India: A mathematical model. PLoS One. 2012;7:e44037. doi: 10.1371/journal.pone.0044037. [DOI] [PMC free article] [PubMed] [Google Scholar]
- 5.Vaz M, Yusuf S, Bharathi AV, Kurpad SS. The nutrition transition in India dietary profiles in India. South Afr J Clin Nutr. 2002;18:198–201. [Google Scholar]
- 6.Pingali P, Khwaja Y. Globalisation of Indian diets and the transformation of food supply systems. Indian J Agric Mark. 2004;18:2004. [Google Scholar]
- 7.Mangal A, Kumar V, Panesar S, Talwar R, Raut D, Singh S, et al. Updated BG Prasad socioeconomic classification, 2014: A commentary. Indian J Public Health. 2015;59:42–4. doi: 10.4103/0019-557X.152859. [DOI] [PubMed] [Google Scholar]
- 8.Tanaka T, Okamura T, Miura K, Kadowaki T, Ueshima H, Nakagawa H, et al. Asimple method to estimate populational 24-h urinary sodium and potassium excretion using a casual urine specimen. J Hum Hypertens. 2002;16:97–103. doi: 10.1038/sj.jhh.1001307. [DOI] [PubMed] [Google Scholar]
- 9.Mann SJ, Gerber LM. Estimation of 24-hour sodium excretion from spot urine samples. J Clin Hypertens (Greenwich) 2010;12:174–80. doi: 10.1111/j.1751-7176.2009.00241.x. [DOI] [PMC free article] [PubMed] [Google Scholar]
- 10.Coulter B. Synchron LX System (s), Chemistry Information Sheet. NA Sodium. 2015 [Google Scholar]
- 11.Coulter B. Synchron LX System (s), Chemistry Information Sheet. CREm Creatinine. 2015 [Google Scholar]
- 12.Longvah T, Ananthan R, Bhaskarachary K, Venkaiah K. Indian Food Composition Tables. National Institute of Nutrition, Indian Council of Medical Research, Department of Health Research, Ministry of Health and Family Welfare, Government of India. 2017:505. [Google Scholar]
- 13.Indian Council of Medical Research. Final Draft Nutrient Requirements and Recommended Dietary Allowances for Indians: A Report of the Expert Group of the Indian Council of Medical Research. Expert Group of the Indian Council of Medical Research. 2009 [Google Scholar]
- 14.Pietinen P, Uusitalo U, Nissinen A. Intersalt Cooperative Research Group. Intersalt: An international study of electrolyte excretion and blood pressure. Results 24 hour urinary sodium and potassium excretion. BMJ. 1988;297:319–28. doi: 10.1136/bmj.297.6644.319. [DOI] [PMC free article] [PubMed] [Google Scholar]
- 15.Ravi S, Bermudez OI, Harivanzan V, Kenneth Chui KH, Vasudevan P, Must A, et al. Sodium intake, blood pressure, and dietary sources of sodium in an adult South Indian population. Ann Glob Health. 2016;82:234–42. doi: 10.1016/j.aogh.2016.02.001. [DOI] [PubMed] [Google Scholar]
- 16.Thakur JS, Jeet G, Pal A, Singh S, Singh A, Deepti SS, et al. Profile of risk factors for non-communicable diseases in Punjab, Northern India: Results of a state-wide STEPS survey. PLoS One. 2016;11:e0157705. doi: 10.1371/journal.pone.0157705. [DOI] [PMC free article] [PubMed] [Google Scholar]
- 17.Wang J, Olendzki BC, Wedick NM, Persuitte GM, Culver AL, Li W, et al. Challenges in sodium intake reduction and meal consumption patterns among participants with metabolic syndrome in a dietary trial. Nutr J. 2013;12:163. doi: 10.1186/1475-2891-12-163. [DOI] [PMC free article] [PubMed] [Google Scholar]
- 18.Mozaffarian D, Fahimi S, Singh GM, Micha R, Khatibzadeh S, Engell RE, et al. Global sodium consumption and death from cardiovascular causes. N Engl J Med. 2014;371:624–34. doi: 10.1056/NEJMoa1304127. [DOI] [PubMed] [Google Scholar]
- 19.Vartiainen E, Laatikainen T, Peltonen M, Juolevi A, Männistö S, Sundvall J, et al. Thirty-five-year trends in cardiovascular risk factors in Finland. Int J Epidemiol. 2010;39:504–18. doi: 10.1093/ije/dyp330. [DOI] [PubMed] [Google Scholar]
- 20.He FJ, Burnier M, Macgregor GA. Nutrition in cardiovascular disease: Salt in hypertension and heart failure. Eur Heart J. 2011;32:3073–80. doi: 10.1093/eurheartj/ehr194. [DOI] [PubMed] [Google Scholar]
- 21.Yi SS, Firestone MJ, Beasley JM. Independent associations of sodium intake with measures of body size and predictive body fatness. Obesity (Silver Spring) 2015;23:20–3. doi: 10.1002/oby.20912. [DOI] [PubMed] [Google Scholar]
- 22.Mercado CI, Cogswell ME, Valderrama AL, Wang CY, Loria CM, Moshfegh AJ, et al. Difference between 24-h diet recall and urine excretion for assessing population sodium and potassium intake in adults aged 18-39 y. Am J Clin Nutr. 2015;101:376–86. doi: 10.3945/ajcn.113.081604. [DOI] [PMC free article] [PubMed] [Google Scholar]