Abstract
Objective
To compare quantitative and qualitative RNA extraction results from clinical voided urine samples between three commercially available extraction protocols.
Methods
For phase 1, fresh voided urine samples from 10 female subjects were collected and processed in clinic and transported to the laboratory with cold packs. RNA was purified with one of three RNA extraction protocols: 1) TRI Reagent Protocol; 2) Absolutely RNA Nanoprep Kit; and 3) ZR Urine RNA Isolation Kit. Real−time polymerase chain reactions were performed. As the ZR Urine RNA Isolation Kit provided the highest quality RNA in phase 1, for phase 2, RNA was extracted from 9 additional voided urine specimens using this kit to perform additional qualitative analyses.
Results
Median RNA yield was significantly higher with the TRI Reagent Protocol as compared with the other protocols (p=0.007). However, there was a significantly lower median threshold cycle (Ct) value from PCR (indicating improved downstream application performance) with the ZR Urine RNA Isolation Kit as compared to the other methods (p=0.005). In phase 2, the median RNA integrity number of urine RNA was 2.5 (range 1.6, 5.9).
Conclusions
While other methods may provide a higher quantity of RNA, when using clinical urine samples the ZR Urine RNA Isolation Kit provided the highest quality of extracted RNA. This kit is especially attractive for the clinical setting as it does not require an initial centrifugation step. The urine RNA obtained with this kit may be useful for PCR, but is not likely to be of high enough integrity for RNA sequencing.
Keywords: PCR - Polymerase Chain Reaction, RIN - RNA Integrity Number, Urine, RNA-ribonucleic acid
Introduction
In humans, urothelial biopsies have historically been used to evaluate gene expression in benign bladder disorders including interstitial cystitis/bladder pain syndrome (IC/BPS).1,2 However, bladder biopsies are an invasive and expensive way to obtain specimens for nucleic acid extraction. Gene expression analysis from urine sediment is feasible.3 However, there are no standardized protocols for RNA extraction from urine sediment, especially when collected in clinical settings that are remote from laboratory processing, refrigerated centrifuges, and freezers. The development of a reliable technique for extraction and evaluation of RNA from clinical urine samples would provide an additional mechanism for the investigation of the pathogenesis of disease of bladder disorders.
Cells shed into the urine are a potential source of material for direct yet noninvasive bladder evaluation. However, RNA degradation from RNase enzymes present in the environment makes it difficult to implement gene expression profiling from urine samples collected in clinical settings. There have been some reports of optimization of RNA yield and purity with either column-based protocols with silica technology or phenol,4–6 but many published studies utilize Trizol for extraction,3,7 which is highly corrosive and toxic. Thus, Trizol-based extraction techniques may be hazardous in a clinical setting. Furthermore, studies reporting on gene expression analyses from urine sediment often use freshly voided urine that is immediately processed; the instantaneous processing is challenging in the clinical arena.3 For gene expression analyses using urine sediment collected in the clinical care environment, there needs to be a standardized protocol to extract high quality, non-degraded RNA with minimal pre-processing steps. In the present study, we compared three different commercially available RNA isolation protocols to suggest the ideal purification protocol for voided urine samples collected in a clinical setting, when remote from a processing laboratory.
Materials and Methods
Phase 1 - Assessment of RNA Quantity and Quality between three commercially available RNA extraction protocols
1.1 Subjects and Urine Collection
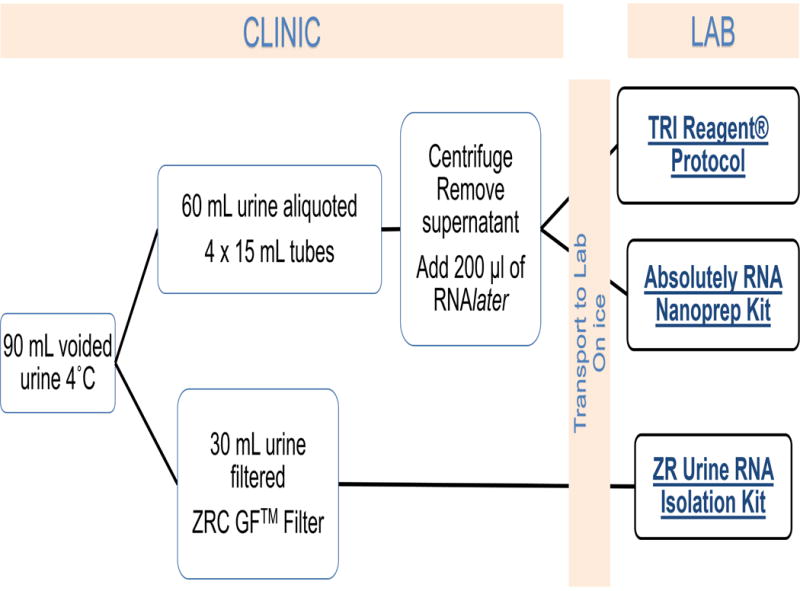
Urine was collected from ten female participants (all >18 years of age). There were no other specific inclusion criteria for this study and participants were only excluded for gross hematuria or clinical concern for urinary tract infection. Fresh, voided midstream, clean-catch urine samples were collected in 90-mL containers and placed at 4°C. A total of 60 mL was aliquoted into 4 sterile 15 mL tubes which were centrifuged in the clinic at 1600 × g for 10 minutes. The tubes were divided into two groups, the supernatant was removed and the pellets of each group were suspended with 200 μl of RNAlater® (Thermo Fischer Scientific, Waltham, MA). From the initial 90 mL sample, 30 mL of urine was processed differently in clinic. This 30-mL volume was pushed through a ZRC GF Filter and combined with RNA buffer per manufacturer’s instructions (ZR Urine RNA Isolation™, Zymo Research Corp, Irvine, CA). All three final specimens (2 pellets resuspended in RNA later and one filter eluent in buffer) were refrigerated in clinic and then transported to the laboratory with cold packs. Times of collection and transportation were recorded. Samples were then immediately processed for RNA extraction in the laboratory. (Figure 1)
Figure 1.

Study Flow Diagram
1.2 RNA Isolation
At this stage each participant’s urine samples had been divided and preprocessed into three specimens per section 1.1. Each of these three aliquots were then purified with the appropriate RNA extraction kits: 1) TRI Reagent® Protocol (Sigma-Aldrich, St. Louis, MO); 2) Absolutely RNA Nanoprep Kit (Agilent Technologies, Santa Clara, CA); and 3) ZR Urine RNA Isolation Kit™ with combined DNAse treatment (Zymo Research Corp, Irvine, CA). (Figure 1). The rationale for the utilization of these kits is as follows: 1) TRI Reagent® Protocol is commonly used, but is highly corrosive and toxic, 2) Absolutely RNA Nanoprep Kit is a commonly used silica-based column extraction technique, but it requires initial centrifugation of urine specimen to obtain a cell pellet, and 3) ZR Urine RNA Isolation Kit does not require centrifugation and utilizes a filter to catch sediment. Both the Trizol-based extraction and silica technology require initial centrifugation of the specimen to obtain a cell pellet. Therefore, urine RNA extraction in a clinic that does not have a high-speed, refrigerated centrifuge is impossible. RNA extraction was performed following the manufacturer’s instructions for each method. RNA quantity was estimated with Nanodrop2000 Spectrophotometer (Thermo Scientific, Waltham, MA).
1.3 RT-qPCR
One-step real-time quantitative polymerase chain reactions (qPCR) were performed using qScript XLT 1-step RT-PCR toughMix ROX kit from Quanta Biosciences according to the protocol from the manufacturer. Taqman® probes (Thermo Scientific, Waltham, MA) specific for beta-2-microglobulin (B2M; labeled with VIC) and glyceraldehyde 3-phosphate dehydrogenase (GAPDH; labeled with FAM) and 20 ng RNA were used in a 20 μl reaction volume. Each reaction was performed in duplicate. Briefly, real time PCR was performed using a Multiplex technique having both probes (1 μl/reaction of each, B2M and GAPDH) in the same reaction, as the probes were detected at different wavelengths. The thermocycler conditions were set for dual probe testing using an Applied Biosystems 7900 Real Time PCR instrument. Threshold cycle (Ct) values were included in analyses if deviation between replicate measures was <0.5 Ct units.
Phase 2 - Further assessment of RNA quantity and quality utilizing the superior extraction protocol from Phase 1
2.1 Urine collection and RNA isolation
An additional 9 voided urine samples were collected from female participants. A total of 60 ml of urine was pushed through a ZRC GF Filter and combined with RNA buffer per manufacturer’s instructions (ZR Urine RNA Isolation™, Zymo Research Corp, Irvine, CA). The specimens were then transported to the laboratory on ice, and RNA was isolated as described in section 1.2.
2.2 RNA Integrity Number and repeat RT-qPCR
RNA quantification was performed with the Qubit® RNA HS (High sensitivity) Assay kit (Thermo Scientific, Waltham, MA). RNA quality was additionally determined utilizing the Agilent 4200 TapeStation capillary electrophoresis system (Agilent Technologies, Santa Clara, CA). Again, one-step real-time quantitative polymerase chain reactions (qPCR) were performed in duplicate, as described in section 1.1.3.
Statistical Analysis
Comparisons were performed using non-parametric tests for paired samples. This included the Friedman’s test for three way comparisons and Wilcoxon signed rank test for pairwise comparisons. We then analyzed whether RNA yield and quality were correlated with transit time prior to processing using Spearman’s correlation. SPSS statistical software version 22.0 (SPSS Inc, Chicago, IL) was used for analysis. P<0.05 was considered statistically significant.
Results
Phase 1 - Assessment of RNA Quantity and Quality between three commercially available RNA extraction protocols
We collected urine samples from a total of ten participants. All subjects were female with median age 53.3 (IQR 42.75, 64.25). The majority of subjects were white (80%). Since the 10 urine samples were separated into 3 aliquots per participant for RNA isolations, there were ultimately 30 RNA isolations performed. The median RNA yield per aliquot was 288 ng/30 mL of urine (IQR 134.5, 840.5). We performed three independent RNA isolations from the same starting volume of urine per participant; Table 1 shows the median RNA yield for each of the three extraction protocols. Friedman testing revealed a statistically significant difference between the median amounts of extracted RNA (p=0.007). In pairwise comparisons with Wilcoxan Signed Rank test, there was significantly higher median RNA yield with the TRI Reagent Protocol as compared to the Absolutely RNA Nanoprep (p=0.028) and as compared to the ZR Urine RNA Isolation Kit (p=0.009). There were no differences in yield between ZR Urine RNA Isolation Kit and Absolutely RNA Nanoprep Kit (p=0.72). There was a median time of 150 minutes (IQR 75, 195) between time of urine collection and time of RNA extraction. This time was not correlated with amount of RNA extracted (Spearman’s correlation coefficient 0.17; p=0.365)
Table 1.
Total RNA median yield and median A260/280 for each of the three extraction techniques measured by Nanodrop absorbance at 260 nm.
| TRI Reagent Protocol n=10 |
Absolutely RNA Nanoprep Kit n=10 |
ZR Urine RNA Isolation Kit n=10 |
p-value* | |
|---|---|---|---|---|
| RNA yield (ng) + | 845 [608.5, 1903.0] |
185.5 [101.5, 378.3] |
219 [66.4, 369.4] |
0.007 |
| A260/280+ | 1.52 [1.47, 1.66] | 1.90 [1.63, 1.99] | 1.63 [1.42, 1.93] | 0.045 |
median [Interquartile range] per 30 mL of urine
Friedman test
The NanoDrop Spectrophotometer estimates absorbance at 260 nm and 280 nm; when these absorbances are combined as a ratio, it allows for interpretation of sample purity. A low ratio may indicate the presence of contaminants in the sample.8 The A260/280 ratios are presented in Table 1. There was a statistically significant difference in median 260/280 ratios based on RNA extraction method (p=0.045). In pairwise comparisons, the highest ratios, as seen with the Absolutely RNA Nanoprep Kit (1.90) were significantly higher than the lowest ratios, noted with the TRI Reagent Protocol (1.52) (p=0.047).
Evaluation by Real Time-quantitative PCR
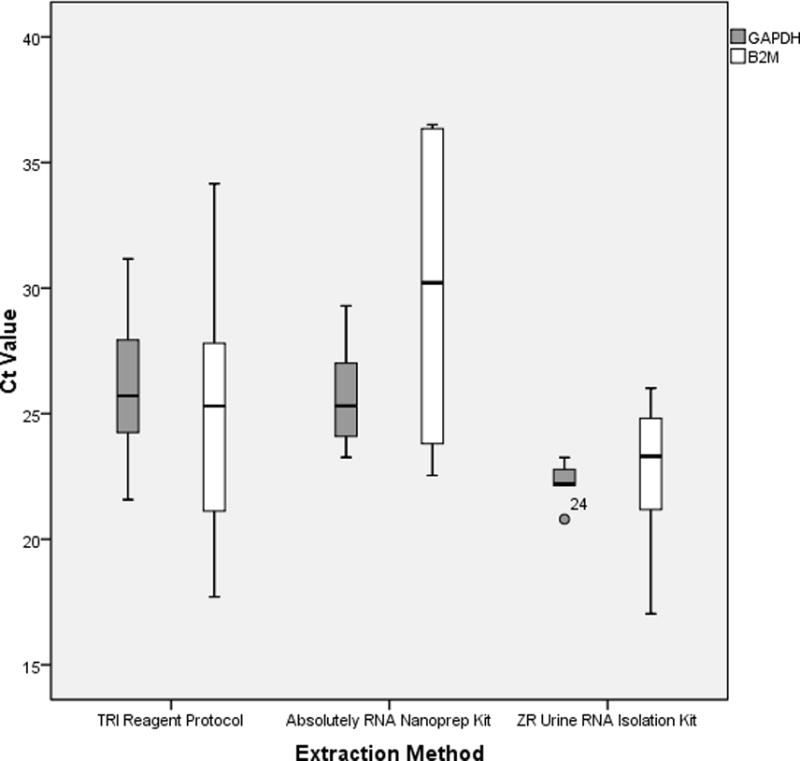
In order to evaluate the RNA quality among the different RNA extraction protocols, one-step real time PCR reactions were then performed with probes specific for B2M and GAPDH. β2 microglobulin, also known as B2M, is a component of MHC class I molecules, which are present on all nucleated cells (excludes red blood cells), and thus has been used as a housekeeping control for RT-PCR. Glyceraldehyde-3-phosphate dehydrogenase (GAPDH) is one of the most commonly used housekeeping genes used in comparisons of gene expression data. Figure 2 shows the distribution of raw Ct values (arithmetic mean of duplicates) of the ten samples for both genes. In general, threshold cycle (Ct) is the cycle at which fluorescence achieves a defined threshold.9 It corresponds to the cycle at which a statistically significant increase in fluorescence is first detected. Of the 30 samples, GAPDH RNAs were detectable in 28 samples while 22 had detectable levels of B2M RNAs. There was a statistically significant difference in median Ct values between extraction methods for GAPDH (p=0.005) but not B2M (p=0.105). For GAPDH, the Ct values were lowest (corresponding with the best performance of PCR) for the ZR Urine RNA Isolation Kit [median 22.2 IQR (21.9, 23.0)] as compared to the Absolutely RNA Nanoprep Kit [median 26.6 (IQR 24.5, 29.4), p=0.012] and the TRI Reagent Protocol [median 25.7 (IQR 24.1, 28.2), p=0.028]. The lowest Ct value for B2M in the ZR Urine RNA Isolation group [median 23.3 (IQR 20.1, 25.1), but again this was not statistically significant.
Figure 2.

mRNA evaluation by specific RT-PCR with GAPDH and B2M by extraction method. Median Threshold Cycle (Ct) value presented from duplicate (n=10)
GAPDH, Glyceraldehyde-3-phosphate dehydrogenase, B2M, β2 microglobulin
*Median Ct values compared with Friedman test, post-hoc analysis with Wilcoxan Signed-Rank test
Phase 2 - Further assessment of RNA quantity and quality utilizing the superior extraction protocol from Phase 1
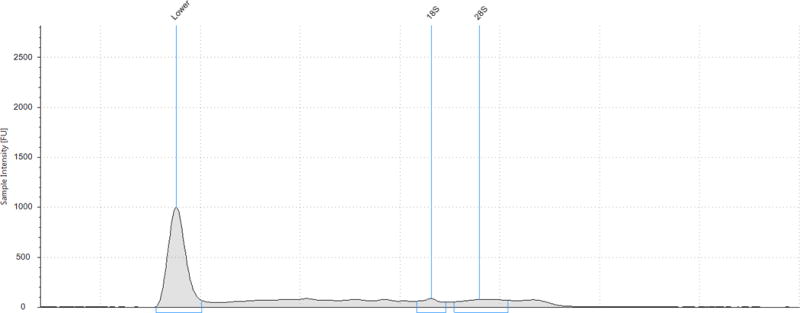
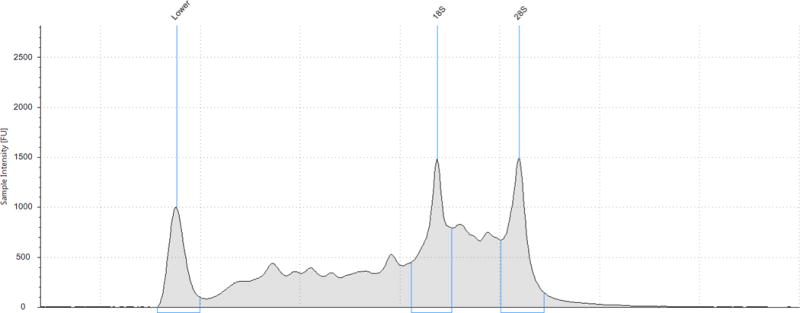
An additional nine urine samples were processed with the ZR isolation kit. These samples had a median RNA yield, as determined from the Qubit® RNA HS Assay, of 397.5 ng/60 mL urine (IQR 37.5, 1035). These samples were subjected to Agilent technologies capillary electrophoresis (CE) which provides an idea of RNA degradation by visualization of fragment size and production of a RNA integrity (RIN) score. The median RIN score of the urine RNA samples was 2.5 (IQR 1.6,2.7; range 1.6, 5.9). When interpreting RIN scores, a score of 1 suggests the most degraded profile and 10 being the most intact. For solid tissues, accepted RIN scores approach 6–8 and in general a RIN score of ≥6 is the minimum value considered as a good total RNA quality for RNA sequencing.10 In general, the electropherograms showed a pattern of at least partial RNA degradation as the intensity of the 28S peak was less than the 18S peak. Additionally, there was a peak at 24–29s corresponding to degraded RNA. (Figure 3) For comparison, we performed additional PCR analyses on these same samples. For GAPDH, median Ct value was 27.3 (IQR 19.4, 27.9) and for B2M the median Ct value was 15.3 (IQR 14.9, 15.6). Median time between urine collection and RNA extraction was 180 min (IQR 146, 235). Again, the time between collection time was not correlated to RIN score (Spearman’s correlation coefficient 0.03, p=0.95).
Figure 3.


Agilent 4200 TapeStation capillary electrophoretic profiles of two RNA samples processed with ZR Urine Isolation Kit: (A) RNA integrity score 3.3 and (B) RNA integrity score 5.9
* The RNA Integrity (RIN) algorithm is applied to electrophoretic RNA measurements, typically obtained using capillary gel electrophoresis, and based on a combination of different features. When interpreting RIN scores, a score of 1 suggests the most degraded profile and 10 being the most intact.
Discussion
We investigated methods to obtain RNA from urine using three commercially available extraction kits. We sought to identify the method that maximizes RNA yield while maintaining quality from limited biomass samples in a clinical setting, remote from laboratory processing. Overall, the TRI Reagent Protocol had the highest median RNA yield. However, the ZR Urine RNA Isolation Kit had the lowest median Ct value for RT-qPCR, indicating higher purity and improved downstream performance in PCR. The time between collection and processing of the initial urine sample was not correlated to yield or degradation of RNA, but most samples were processed within 3 hours of collection. Although our additional assessment of RNA degradation with the Bioanalyzer capillary electrophoresis system suggests significant degradation of RNA, the same samples still had acceptable RT-qPCR amplication of housekeeping genes of interest using Taqman probes. This suggests that RNA extracted using the ZR Urine RNA Isolation Kit with our “clinic setting” protocol is useful for PCR but provides RNA that is still too degraded for RNA sequencing. Importantly, we could obtain approximately 400 ng of total RNA from only 60 mL of urine, which suggests that higher voided volumes would allow for an increased amount of available RNA for downstream applications.
One of the strengths of our study is the clinical generalizability of our results. We collected samples from patients in our office, which was remote from our laboratory. In our clinical setting, we did not have a refrigerated centrifuge, nor were we able to achieve centrifugation speeds above 1600 × g. Incorporation of these resources may provide higher RNA yields with further improvement in RNA quality and integrity. Our study showed that, although the ZR Urine RNA Isolation Kit had lower RNA yield, RNA extracted with this technique performed better in downstream applications, such as qRT-PCR. The ZR Urine RNA Isolation Kit is especially attractive for clinical settings since it does not require an initial clinic centrifugation step. For our study, we collected voided samples that underwent some immediate processing, but were then refrigerated with RNA extraction occurring on average three hours later. Therefore, our results are more clinically relevant from a practical standpoint than other studies that collect urine samples immediately prior to RNA extraction.
We initially utilized nanodrop spectrophometry to assess RNA yield. As all nucleic acids (dsDNA, RNA and ssDNA) absorb at 260nm, this method is not capable of distinguishing between the various forms of nucleic acid. Also, if significant amounts of contaminants that absorb around 260nm are present in a sample, the contaminants themselves can contribute to the absorbance value, resulting in an overestimation of nucleic acid concentration. This may at least partially explain why the Tri Reagent Protocol had significantly higher “RNA” yields. Our clinical space did not have a refrigerated centrifuge and therefore there may have been additional loss during the centrifugation step for the samples processed with the Tri Reagent Protocol and the Absolutely RNA Nanoprep Kit. The nanodrop spectrophotometer is significantly more available in most laboratory spaces than the electrophoresis technology as below. As a secondary assessment of RNA quality and RNA degradation, in Phase 2 we used the Qubit RNA HS (High sensitivity) Assay kit and the Agilent 4200 Bioanalyzer capillary electrophoresis system to confirm RNA yields and degradation. This RNA measurement does not tend to be influenced by contamination and should be used prior to downstream application if initial spectrophotometry shows adequate RNA yield/quality.
Although our A260/280 ratios and RIN scores were lower than generally accepted for successful downstream application, we did have effective amplification of housekeeping genes with RT-qPCR. The assessment of RNA integrity is a critical first step in obtaining meaningful gene expression data as working with degraded RNA may strongly compromise the experimental results of downstream applications, particularly for RNA-sequencing.10 RNA-Seq (RNA sequencing), also called whole transcriptome shotgun sequencing (WTSS), uses next-generation sequencing (NGS) to analyze the continually changing cellular transcriptome. Specifically, RNA-Seq facilitates the ability to look at alternative gene spliced transcripts, post-transcriptional modifications, gene fusion, mutations/SNPs, or differences in gene expression in different groups or treatments.11 This sequencing modality may be especially prone to bias when degraded samples are used.
However, reasonable qRT-PCR data can still be obtained from RNA samples with lower RIN scores. Additionally, gene expression profiles obtained from partially degraded RNA samples have exhibited a high degree of similarity compared to intact samples and to RNA samples of sub-optimal quality.12 Recent studies have also suggested that mathematical normalizations and modeling to control for degree of degradation may allow for utilization of degraded RNA samples in gene expression analysis.10 Larger sample sizes would be needed with genes of interest to confirm if RNA extracted from clinically collected urine is acceptable for RNA analysis.
Lastly, we made every attempt to evenly distribute the clinical urine sediment for equal input into each of the three extraction methods. However, it remains possible that pipetting error could contribute to differential RNA yields in our study and time of processing during the extraction protocol could lead to RNA degradation. Notably, the RT-qPCR quantifications were performed using the same RNA input and the lower Ct values demonstrated with certain isolation techniques truly represent improved amplication regardless of initial RNA concentration in the urine sediment.
Conclusions
In conclusion, this study has compared leading commercial kits and reagents for the effective isolation of RNA from voided urine samples in a clinical setting, remote from laboratory processing. The ZR Urine RNA Isolation Kit performed best in our hands as this protocol produced RNA with the greatest downstream amplification using RT-qPCR. Furthermore, there is no initial centrifugation step for this protocol making it the easiest to implement for clinical use. If the Absolutely RNA Nanoprep Kit or Tri Reagent protocol are used, we would note that we used the addition of RNAlater to the pelleted sediment to allow for stabilization of RNA prior to transportation to the laboratory. Thus, we cannot comment on the success of this application without this additional step. Further validation in larger cohorts that undertake expression analysis across a broad number of genes, rather than only housekeeping genes, is necessary to verify clinical utility of this protocol for translational studies in voided urine.
Acknowledgments
Dr. Siddiqui has protected research time and provided support according to her award number K12-DK100024 from the National Institute of Diabetes and Digestive and Kidney Diseases Dr. Siddiqui has received grant funding from Medtronic Inc, but this resource did not provide support for this study. Additional funding was obtained from the Duke University Hammond Research Fund.
Footnotes
Disclosure statement: The other authors did not report any potential conflicts of interest.
Contributor Information
Megan S. Bradley, Magee-Womens Hospital – University of Pittsburgh School of Medicine, Department of Obstetrics, Gynecology and Reproductive Sciences, 300 Halket Street, Pittsburgh, PA 15217.
Marie-Helene Boudreau, Department of Obstetrics & Gynecology, Duke University Medical Center.
Carole Grenier, Department of Obstetrics & Gynecology, Duke University Medical Center.
Zhiqing Huang, Department of Obstetrics & Gynecology, Duke University Medical Center.
Susan K. Murphy, Department of Obstetrics & Gynecology, Duke University Medical Center.
Nazema Y. Siddiqui, Department of Obstetrics & Gynecology, Division of Urogynecology and Reconstructive Pelvic Surgery, Duke University Medical Center.
References
- 1.Erickson DR, S S, Dixon JK, Clark CJ, Hersh MA. Differentiation Associated Changes in Gene Expression Profiles of Interstitial Cystitis and Control Urothelial cells. J Urol. 2008;180:2681–2687. doi: 10.1016/j.juro.2008.08.007. [DOI] [PubMed] [Google Scholar]
- 2.Colaco M, Koslov DS, Keys T, et al. Correlation of Gene Expression with Bladder Capacity in Interstitial Cystitis/Bladder Pain Syndrome. J Urol. 2014;192:1123–1129. doi: 10.1016/j.juro.2014.05.047. [DOI] [PubMed] [Google Scholar]
- 3.Blalock EM, Korrect GS, Stromberg AJ, Erickson DR. Gene Expression Analysis of Urine Sediment: Evaluation for Potential Noninvasive Markers of Interstitial Cystitis/Bladder Pain Syndrome. J Urol. 2012;187:725–732. doi: 10.1016/j.juro.2011.09.142. [DOI] [PubMed] [Google Scholar]
- 4.Medeiros M, Sharma VK, Ding R, et al. Optimization of RNA yield, purity and mRNA copy number by treatment of urine cell pellets with RNAlater. J Immunol Methods. 2003 Aug;279(1–2):135–142. doi: 10.1016/s0022-1759(03)00237-0. [DOI] [PubMed] [Google Scholar]
- 5.Crossland RE, Norden J, Bibby LA, Davis J, Dickinson AM. Evaluation of optimal extracellular vesicle small RNA isolation and qRT-PCR normalisation for serum and urine. J Immunol Methods. 2016 Feb;429:39–49. doi: 10.1016/j.jim.2015.12.011. [DOI] [PubMed] [Google Scholar]
- 6.Szeto CC, Chan RW, Lai KB, et al. Messenger RNA expression of target genes in the urinary sediment of patients with chronic kidney diseases. Nephrol Dial Transplant. 2005 Jan;20(1):105–113. doi: 10.1093/ndt/gfh574. [DOI] [PubMed] [Google Scholar]
- 7.Monteiro MB, Santos-Bezerra DP, Thieme K, et al. Optimization of total RNA isolation from human urinary sediment. Clin Chim Acta. 2016 Sep 22;462:158–161. doi: 10.1016/j.cca.2016.09.018. [DOI] [PubMed] [Google Scholar]
- 8.Fleige S, Pfaffl MW. RNA integrity and the effect on the real-time qRT-PCR performance. Mol Aspects Med. 2006 Apr-Jun;27(2–3):126–139. doi: 10.1016/j.mam.2005.12.003. [DOI] [PubMed] [Google Scholar]
- 9.Gomez-Alamillo C, Benito-Hernandez A, Ramos-Barron MA, et al. Analysis of urinary gene expression of epithelial-mesenchymal transition markers in kidney transplant recipients. Transplant Proc. 2010 Oct;42(8):2886–2888. doi: 10.1016/j.transproceed.2010.07.051. [DOI] [PubMed] [Google Scholar]
- 10.Gallego Romero I, Pai AA, Tung J, Gilad Y. RNA-seq: impact of RNA degradation on transcript quantification. BMC Biol. 2014 May 30;12:42. doi: 10.1186/1741-7007-12-42. [DOI] [PMC free article] [PubMed] [Google Scholar]
- 11.Wang Z, Gerstein M, Snyder M. RNA-Seq: a revolutionary tool for transcriptomics. Nat Rev Genet. 2009 Jan;10(1):57–63. doi: 10.1038/nrg2484. [DOI] [PMC free article] [PubMed] [Google Scholar]
- 12.Schoor O, Weinschenk T, Hennenlotter J, et al. Moderate degradation does not preclude microarray analysis of small amounts of RNA. Biotechniques. 2003 Dec;35(6):1192–1196. 1198–1201. doi: 10.2144/03356rr01. [DOI] [PubMed] [Google Scholar]


