Abstract
Cardiovascular diseases are the leading cause of death worldwide. These cardiovascular diseases are associated with mechanical changes in the myocardium and aorta. It is known that stiffness is altered in many diseases including the spectrum of ischemia, diastolic dysfunction, hypertension, and hypertrophic cardiomyopathy. Additionally, the stiffness of the aortic wall is altered in multiple diseases including hypertension, coronary artery disease, and aortic aneurysm formation. For example in diastolic dysfunction where the ejection fraction is preserved stiffness can potentially be an important biomarker. Similarly, in aortic aneurysms, stiffness can provide valuable information regarding rupture potential. A number of studies have addressed invasive and noninvasive approaches to test and measure the mechanical properties of the myocardium and aorta. One of the noninvasive approaches is magnetic resonance elastography (MRE). MRE is a phase-contrast magnetic resonance imaging technique that measures tissue stiffness noninvasively. This review paper highlights the technical details and application of MRE in quantifying myocardial and aortic stiffness in different disease states.
Keywords: MR elastography (MRE), myocardial stiffness, shear stiffness, cardiac MRE, heart failure, aortic stiffness, aortic MRE
Graphical Abstract
Cardiovascular diseases are the leading cause of death worldwide. These cardiovascular diseases are associated with mechanical changes in the myocardium and aorta. A number of studies have addressed an invasive and noninvasive approaches to test and measure the mechanical properties of the myocardium and aorta. One of the noninvasive approaches is magnetic resonance elastography (MRE). MRE is a phase-contrast magnetic resonance imaging technique that measures tissue stiffness noninvasively. This review paper highlights the technical details and application of MRE in quantifying myocardial and aortic stiffness in different disease states.
Introduction
Cardiovascular diseases (CVDs) are the leading cause of death worldwide. Health data compiled from more than 190 countries show that 31% of all global deaths are caused by CVDs. An estimated 85.6 million people in the U.S. are affected by CVDs, including heart attack, high blood pressure and chest pain1. The estimated economic cost of CVDs for 2009 was $313 billion, out of which $192 billion were in direct health expenditures and $121 billion in indirect cost of mortality2. Therefore, development of techniques for early diagnosis and treatment response monitoring for CVDs is an important research area.
A number of studies have shown that common CVDs are accompanied by abnormalities in mechanical properties of the myocardium and the aorta. Additionally, ventricular-vascular coupling associated with functional properties of both the organs in conjunction, play an important role in different disease states including hypertension, aortic stenosis etc. One of the mechanical properties i.e. myocardial stiffness is a major determinant of cardiac function and is increased in many diseases including the spectrum of ischemia3, diastolic dysfunction4, hypertension5, and hypertrophic cardiomyopathy6. Similarly, aortic wall stiffness is a fundamental biomechanical parameter that reflects the structural integrity of aortic tissue. Aortic compliance and distensibility reflect overall wall stiffness, an extremely important and fundamental parameter altered in multiple diseases including hypertension, coronary artery disease, and aortic aneurysm formation7. Therefore, it is important to estimate the stiffness of both heart and aorta.
Invasive Techniques
To date, myocardial stiffness can only be measured with ex-vivo mechanical testing8 or in-vivo by indirectly inferring it from pressure-volume (P-V) relationships9. There are many challenges and limitations associated with P-V relationships to determine both end-diastolic and end-systolic elastance as described by Burkhoff et al.9 P-V methods are invasive; assess only global left ventricular (LV) chamber, rather than the true intrinsic properties of the myocardium9 and requires technical precision. Similarly, mechanical testing is performed on myocardial strips to estimate passive stiffness in a uniaxial10–12 or biaxial13 directions and does not account for the dynamic behavior of the heart. Furthermore, these strips have to be tested within an hour before rigor mortis occurs in addition to many limitations associated with loading conditions during testing. Similarly in the aorta, in-vitro mechanical testing of aortic tissue specimens14–17 provides the only direct estimate of stiffness. Invasive catheter-based techniques18–20 have served as the gold standard for in-vivo estimation of aortic stiffness. However, besides the invasiveness and risks of the procedure associated with catheter-based techniques, it is challenging to obtain accurate measurements of the vessel diameter since the change in the diameter during the cardiac cycle is very small, and the high-fidelity pressure catheters require great technical precision for operation; these factors have adversely affected the robustness of the calculated values18–21. In addition, catheter-based techniques provide only indirect measurements, and no information regarding spatial variation of stiffness. Therefore, there is a need for techniques enabling non-invasive measurement of myocardial and aortic stiffness.
Non-invasive techniques
A non-invasive method for assessing myocardial stiffness does not yet exist in standard clinical practice. Instead, clinicians and researchers have attempted to infer myocardial stiffness from measures of Doppler assessment of the mitral valve, myocardial deformation (e.g. strain/tagging), or from measures of LV structure, such as: 1. inflow and tissue velocity indices such as Doppler E and A inflow parameters and E′ and A′ tissue velocity parameters22; 2. strain and strain-rate imaging such as circumferential strain or torsion using MRI myocardial tagging23,24, Displacement Encoding with Stimulated Echoes (DENSE)25, Strain-Encoded MRI (SENC)26; or 3. structural imaging including eccentric and concentric remodeling indices. The strain imaging methods measure large displacements (mm) over the cardiac cycle. When combined with in-vivo pressures, geometry and boundary conditions, finite strain can be used to estimate finite elastic stiffness parameters27,28. These strain based methods do not directly quantify stiffness as it only provides relative displacement of the myocardium from one phase of the cardiac cycle to the other and, therefore, the characterization of disease processes and the quantification of the effects of treatment are currently problematic.
Pulse wave velocity (PWV) measured by pulse tonometry and ultrasound is a non-invasive method to indirectly measure arterial stiffness29–32. PWV requires measurement of wave velocity in peripheral arteries to calculate central pulse characteristics33–35. However, the peripheral PWV is a poor reflection of central aortic stiffness36,37. Therefore, there is a discrepancy between pulse readings at different sites33 and, consequently, the accuracy of PWV measured suffers from errors in distance and time delay measurements38,39. While magnetic resonance imaging (MRI) also allows the measurement of PWV40,41 with a major advantage of providing the path length of propagating wave with more accuracy, it lacks the temporal resolution of ultrasound-based techniques. Similarly, ultrasound imaging42,43 used for measuring PWV is limited by acoustic windows and imaging depth. A limitation common to all the aforementioned techniques is that they only provide a global measure of stiffness. Consequently, any abnormalities in the stiffness cannot be localized.
Based on above literature there is a need for non-invasive elastography techniques that can spatially and temporally resolve myocardial and aortic stiffness throughout the cardiac cycle. Therefore, this review article describes in detail a novel non-invasive imaging technique known as magnetic resonance elastography (MRE) to estimate stiffness for CVD applications. We first provide information on the technical aspects of cardiovascular MRE, such as introduction of external motion into the heart, pulse sequences, and analysis tools. We then review the current application of cardiovascular MRE. Finally, we discuss the limitations of the technique and future work.
Magnetic Resonance Elastography
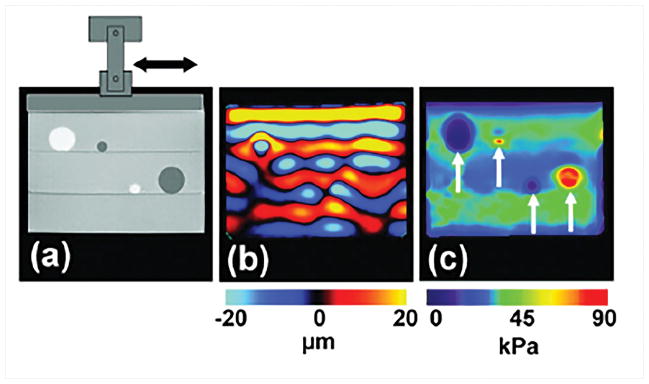
MRE is a phase contrast MR imaging technique to estimate stiffness of soft tissues7,44–47. In MRE, the shear waves induced by external motion (Figure 1a) are encoded in the phase of an MR image using a phase contrast MRI sequence with motion encoding gradients (MEG) synchronized with the external motion. These wave images (Figure 1b) are usually processed on a pixel-by-pixel basis using a mathematical algorithm known as inversion to obtain the stiffness maps (Figure 1c). These stiffness maps are spatially and temporally resolved. However, there are some challenges in performing MRE for CVD applications due its location for introducing external motion, faster pulse sequences due to acquisition of required data during physiologic motion and finally inversion to obtain stiffness maps due to their complex structure and wave pattern.
Figure 1. Steps involved in MRE.
a) A mechanical driver is used to introduce shear waves in the sample with soft (bright) and stiff (dark) inclusions. Shear waves are encoded into the phase image b) obtained using an MRE sequence. Waves in stiffer areas have longer wavelength. An inversion algorithm is utilized to compute stiffness map c) using the phase image. Reproduced with permission from reference48.
Drivers
As mentioned above, MRE relies on generation of shear waves in the region of interest (ROI) using an external driver. An MRE driver consists of three components: 1) A wave generator which is the main source of waves. For example, this wave generator can be a loud speaker that generates acoustic waves, or an electromagnetic coil that oscillates at a given frequency, etc. 2) An MR compatible medium to transfer the generated waves. 3) A passive driver that is positioned on the ROI48.
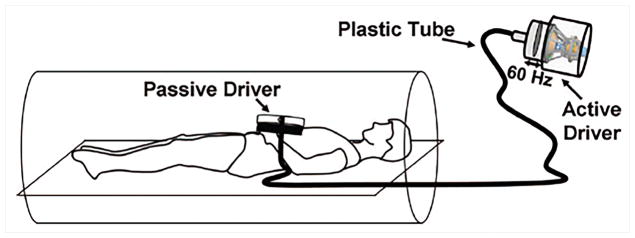
A majority of cardiovascular MRE studies use a pneumatic driver owing to its simple design49–56. A pneumatic driver consists of an acoustic source for wave generation, a plastic tube as a transmission medium and a passive driver (i.e. plastic drum) positioned on the subject as shown in Figure 2. In studies conducted by Kolipaka et al.47,57 both pneumatic and electromechanical drivers have been used on a heart simulating phantom and for in-vivo applications at a vibration frequencies of 200Hz and 80Hz, respectively. Studies conducted by Elgeti et al.52,58,59 used a rigid piston driver at frequencies of 24.13, 48.3, 22.83Hz on volunteers, patients and animal models. In another study by Sinkus et al.60 used aortic valve closure (intrinsic physiologic motion) as the source of vibrations.
Figure 2. Pneumatic driver setup for cardiovascular MRE.
The passive driver is placed on the subject’s chest. The vibration energy is generated by the active drive placed in the MR equipment room, and conveyed by a hollow tube to the passive driver. Reproduced with permission from reference66.
Each type of the drivers has its own limitations. The main limitation of the pneumatic driver system is that it cannot generate higher frequencies (i.e. >150 Hz) efficiently, because of the air compressibility, where the energy decreases significantly. Higher frequency of mechanical vibration will produce shorter wavelengths which will result in higher resolution stiffness maps and will enable to calculate robust stiffness maps. On the other hand it is flexible and has good penetration of waves up to 140Hz in the cardiovascular system61. For these advantages it is widely used in cardiovascular MRE studies. The rigid piston rod is not flexible and might be challenging in orienting the subject in the scanner. But it can efficiently transfer high frequency waves with minimal loss of energy compared to pneumatic driver system. Whereas, the aortic valve closure method (i.e. intrinsic vibration), it becomes extremely challenging to synchronize the intrinsic motion to MEG to acquire the wave images. Additionally, any issues with the functionality of the aortic valve can lead to improper closure of the aortic valve leading to inefficient vibrations.
Cardiovascular MRE Sequences
Cardiovascular MRE sequences are variants of typical cardiac MRI sequences, with MEGs placed before the readout. MEGs are typically first moment nulled to avoid additional phase accumulation due to cardiac motion. Like typical cardiovascular MRI sequences, cardiac MRE (CMRE) sequences are ECG gated (prospective or retrospective triggering) and rely on either breath-holds or navigators to avoid the artifacts resulting from heartbeat and respiration. Furthermore, these sequences need to acquire images with multiple phases of the cardiac cycle along with multiple phases of external motion. Therefore, these sequences have to be fast so that all the data can be acquired in a breath-hold.
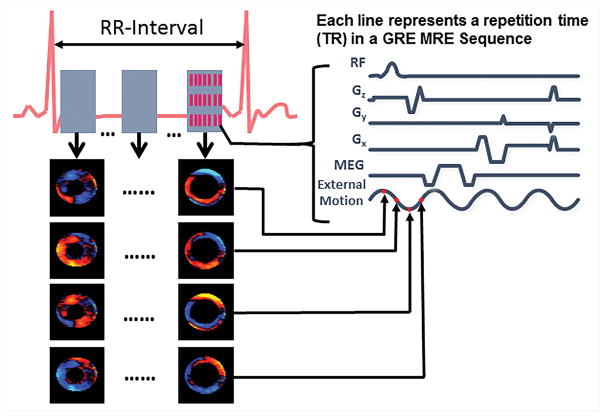
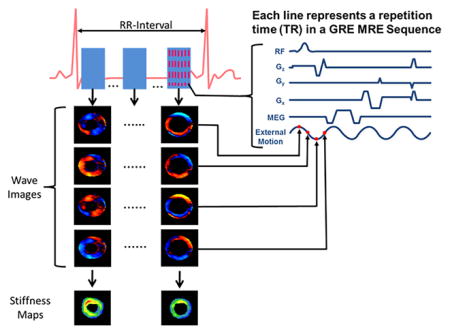
A retrospectively gated multiphase (i.e. cine) gradient echo (GRE) MRE sequence has been developed to acquire images for cardiovascular application57. The sequence diagram is shown in Figure 3, this sequence involves segmented acquisition with 8 views being shared for each heart beat to reconstruct a cardiac phase. It also incorporates an in-plane acceleration factor of 2 to acquire the data for a single slice along one encoding direction in a breath-hold. Furthermore, in this sequence it is important to match the cycles of external motion to each repetition time (TR). Additionally, the echo time (TE) should be as minimal as possible to avoid any motion artifacts of the moving heart or aorta. For application in the heart, an 80Hz external motion was applied which enabled a minimum TR of 12.5ms and a fractional MEG of 160Hz with first moment nulled was used to minimize the TE (i.e~9ms)47. Whereas in the aorta, a 70Hz external motion was applied with a TR of 14.7ms and a fractional MEG of 120Hz was used with a TE of ~11ms46. However, for imaging abdominal aorta a non gated GRE MRE sequence7 was also used to obtain wave images at a point in the cardiac cycle. This sequence was performed under a breath-hold. It is important to minimize the TE to avoid any motion/flow related artifacts.
Figure 3. Cine MRE sequence.
A whole cardiac cycle is reconstructed by 8 positive motion encoding gradients and 8 negative motion encoding gradients within an R-R interval. The external motion is tracked by four time points (red dots on external motion wave) for each cardiac cycle to encode the propagation of the wave within the heart. For a single slice and one encoding direction, 16 R-R intervals are needed.
Sack et al. 53 used a GRE sequence for imaging the left ventricular myocardium as shown in the Figure 4. The sequence collected many snapshots across cardiac cycle with a very short breath-hold durations separated by 2.5s breathing intervals53. During each breath-hold, acquisition of a single phase-encode line was repeated 8 times per mechanical cycle for 47.5 mechanical cycles. This process was repeated for 34 phase-encoding steps (with GeneRalized Autocalibrating Partial Parallel Acquisition - GRAPPA) and 3 MEG directions. A low mechanical frequency of 24.3 Hz was used to ensure deep penetration of the shear waves, and a short TR of 5.16ms was achieved with fractional encoding employing MEG frequency of 500Hz. This sequence required 2.5 minutes for each MEG direction. Eight images acquired for each mechanical cycle were later combined to obtain shear wave amplitudes to compute relative stiffness, as discussed in the next section.
Figure 4. A GRE sequence for wave-amplitude based MRE.
Fractionally encoded signal is sampled 8 times during each mechanical oscillation, and the process is repeated throughout the cardiac cycle. Multiple short breath-holds are used to fill the k-space. Reproduced with permission from reference53.
A single-shot spin-echo echo planar imaging sequence was developed by Arani et al, with MEG cycles placed before and after the refocusing pulse61. TEs of 52 to 79 ms were used depending upon the mechanical frequencies (between 80 and 220 Hz). Multiple MEG cycles were placed on either side of the refocusing pulse for higher mechanical frequencies to compensate for lower sensitivity caused by increased wave attenuation. Single-slice acquisition with 4 MEG directions (0, x, y, z) and 4 phase offsets relative to the mechanical motion was acquired within a breath-hold lasting ~27 seconds. Feasibility of MRE with mechanical frequencies as high as 140 Hz was demonstrated using this sequence.
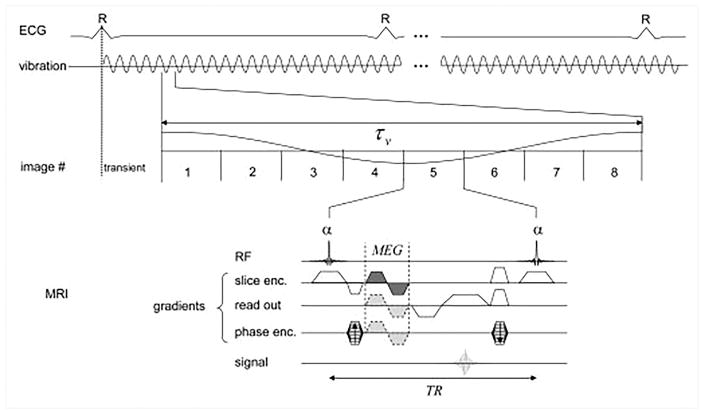
Robert et al.62 developed a DENSE based sequence to achieve short echo times (~5ms) for mechanical excitation frequencies as low as 50 Hz while avoiding fractional encoding for improved spectral specificity (Figure 5)62. First MEG lobe is placed between a pair of closely spaced 90° RF pulses. The second MEG is synchronized with the opposite phase of the mechanical excitation, following the excitation, α pulse. Since the spins spend most of the MEG sensitization period along the longitudinal axis, imaging with short TEs (compared with SE and GE sequences) is possible even with long preparation durations associated with low mechanical frequencies required for greater penetration. A segmented EPI readout with 3 segments was used, resulting in a scan time of ~25 seconds per 64x64 resolution image. Therefore, multiple breath-holds were required for different MEG polarities/durations and cardiac phases.
Figure 5. A DENSE based MRE sequence.
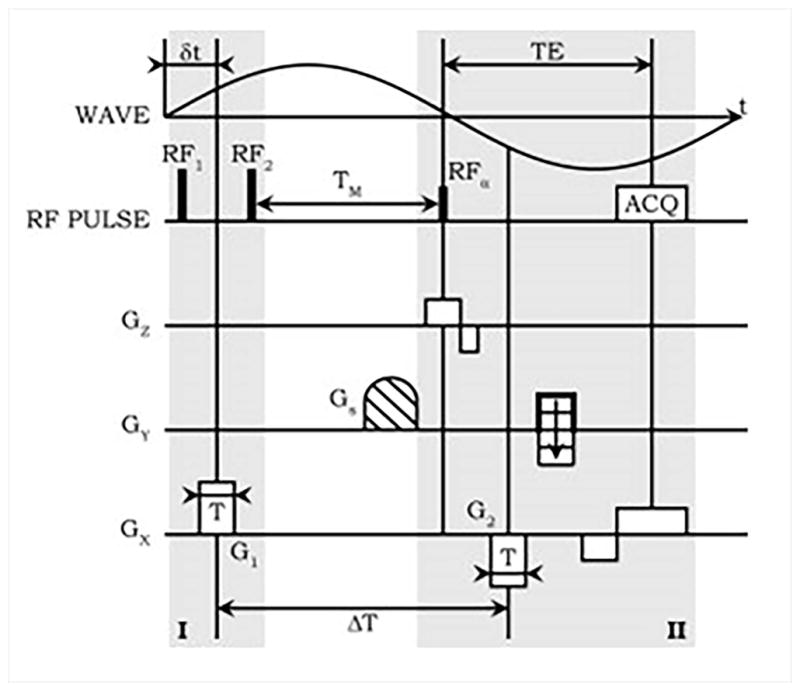
Motion sensitizing gradient G1 is applied between a pair of 900 pulses during part I, followed by spoiler G1. In part II, the excitation RF pulse is followed by motion sensitizing gradient G2. G1 and G2 are played during exactly the opposite phases of mechanical excitation, resulting in high spectral specificity. TEs shorter than half the time-period of the mechanical excitation can be achieved at the expense of 50% reduction in the available magnetization. Reproduced with permission from reference62.
Another sequence by Elgeti et al.58 used balanced SSFP to capture macroscopic tissue deflections caused by low frequency mechanical excitation (25 Hz) in magnitude images58. This is completely a different approach, compared with conventional MRE, in that the motion is not encoded in the phase images using MEGs. Instead, the acquisition is synchronized to the mechanical excitation to obtain images for different phases of mechanical waves and cardiac cycle. Image intensity at tissue interfaces is then used to estimate the wave amplitudes.
Calculation of Stiffness Maps: MRE Inversion
In mechanics, stiffness is a structural parameter, which is deflection per unit load with units of N/mm. However, in cardiovascular MRE, the term “stiffness” refers to shear modulus, which is estimated from wave speed square of the propagating wave multiplied by density of the material with units of kPa. The approaches used to estimate stiffness of the myocardium and the heart from MRE data can be classified into two categories: The first category includes approaches that rely on approximating the solution to the Helmholtz equation under some simplifying assumptions. The approaches that fall into the second category estimate relative stiffness using the ratio of wave amplitude in the region of interest (such as myocardium) to that in a reference region (such as chest wall).
Stiffness estimation based on approximate solutions to the Helmholtz equation
For an infinite, locally homogeneous and incompressible material, the solution to the Helmholtz equation can be determined if the local spatial frequency of the shear waves is known. Local Frequency Estimation (LFE) relies on this principle, and has been widely used in cardiovascular MRE63. Local frequency is determined by combining the local frequency estimates obtained over a wide range of scales using oriented lognormal quadrature wavelets64. Oblique wave-propagation can bias the stiffness estimate when 2D data are used. Therefore, LFE has been extended to obtain 3D stiffness maps for multi-slice datasets with motion sensitivity along x, y and z directions63. Similarly, Arani et al. used a Direct Inversion approach to estimate 3D myocardial stiffness, based upon the least squares solution to the Helmholtz equation61.
The spherical shell inversion method for MRE was proposed by Kolipaka et al.65 takes into consideration of the complex nature of wave propagation in the left ventricle65. Left ventricle is a thin chamber filled with blood, and cannot be considered a uniform, infinite medium for wave propagation. It was therefore modeled as a thin-walled spherical shell by incorporating the diameter and thickness of the heart wall, and the equation of wave propagation under these assumptions were derived to obtain an expression for stiffness based upon the wave displacement data.
First harmonic displacement field is obtained by performing the Fourier transform along the temporal dimension of the external waves with temporal frequency equal to the mechanical excitation frequency in the data acquired with multiple phase offsets to obtain the stiffness maps7,46,47,61,66–69. Before computing the stiffness maps using the aforementioned inversion strategies, several preprocessing methods are typically performed to remove undesired components from the phase data: 1) shear waves are of primary interest when estimating the shear stiffness, and therefore the longitudinal waves are removed using the curl operator61 or bandpass filtering61,66–68. The use of directional filtering with 8 different directions has been proposed to eliminate the reflections7,45,46,55,66,69–71. The stiffness maps obtained from data processed with different directional filters are then combined using a weighted averaging approach.
Amplitude based estimation of relative stiffness
Sack et al.53 used the first harmonic of the shear wave amplitudes as a surrogate to stiffness measurements. It is known that lower shear wave amplitudes correspond to higher stiffness and higher amplitudes correspond to lower stiffness. However, there amplitudes depend on the driver location as well as breath-hold position and also power from the driver. Therefore, the amplitudes are normalized with respect to the amplitudes in the chest wall to amplitudes at each of the cardiac cycle. This leads to a different approach toward relative stiffness estimation: Wave amplitudes are estimated using a phase contrast53 or magnitude based58 approach. The amplitude ratios are then used to determine relative stiffness in the ROI throughout the cardiac cycle53.
Applications of Cardiovascular MRE
Cardiac MRE (CMRE)
The application of CMRE to measure myocardial elastic properties has the potential to facilitate non-invasive assessment of myocardial dysfunction and relaxation abnormalities related to increased myocardial stiffness.
Phantom Studies
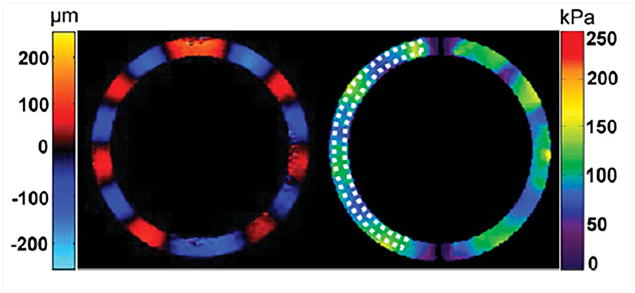
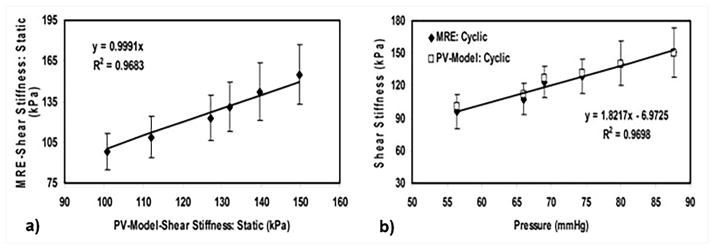
Phantom and animal studies have been used to validate CMRE as a technique to estimate myocardial stiffness. Kolipaka et al. used a heart-simulating phantom to measure stiffness at static pressure as well as under cyclic variation of pressure in the phantom (Figure 6)65. The study demonstrated a linear correlation between CMRE derived stiffness and pressure with an R2 of 0.97. The estimated stiffness values were also compared against those obtained using P-V measurements. Excellent agreement was observed between the stiffness values obtained using CMRE and P-V measurements under static as well as cyclically varying pressure (Figure 7), suggesting that CMRE can be used to estimate in-vivo myocardial stiffness.
Figure 6. MRE results from a heart simulating phantom.
Left: Radial component of the displacement field in a heart simulating phantom. Right: Stiffness map obtained using the Spherical Shell Inversion approach. Mean stiffness in the ROI (indicated by the dotted contour) was found to be 96.2 ± 16.2 kPa. Reproduced with permission from reference65.
Figure 7. Comparison of MRE stiffness with P-V model based stiffness.
MRE and P-V model based stiffness at static and cyclically varying pressure. a) Excellent agreement is observed between MRE and PV model based stiffness values at static pressure. b) MRE and PV model based stiffness values increase linearly with pressure, and are in agreement with each other. Reproduced with permission from reference65.
Animal Studies
P-V Loops vs. Stiffness –Volume Loops
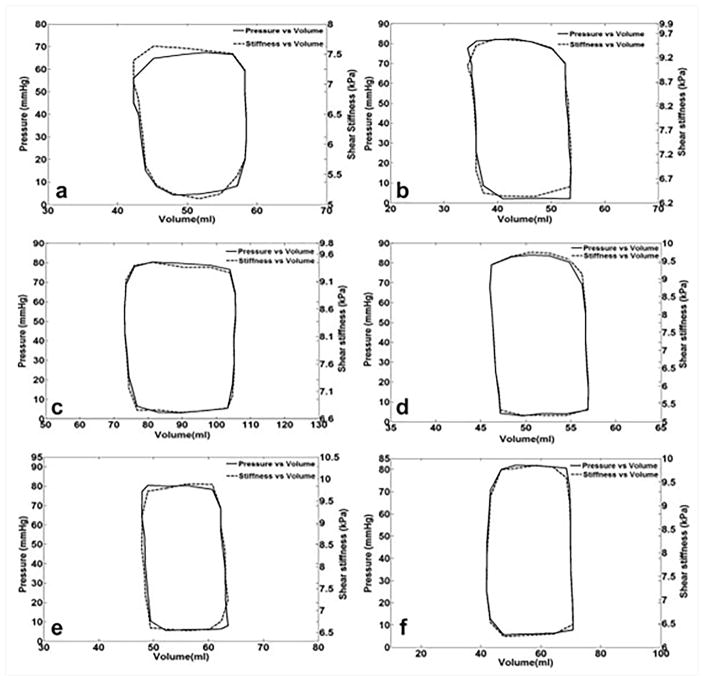
Recent animal studies have investigated the application of MRE in measuring the myocardial stiffness, and compared the results with the gold standard P-V loops47,72. These studies have demonstrated good correlation between MRE-derived stiffness and pressure, and also showed an excellent agreement between P-V loops and stiffness-volume loops (Figure 8)47. Therefore, cardiac MRE can be potentially used to estimate stiffness-volume loops instead of invasive P-V loops. Furthermore, it was shown that myocardium is stiffer during systole compared to diastole, demonstrating the cardiac MRE is sensitive to active contraction of the muscle and increase in pressure during systole compared to the passive relaxation during diastole.
Figure 8. Pressure-volume and shear stiffness - volume loops for 6 different animals.
Pressure-volume and shear stiffness – volume curves were similar. It is important to observe that Pressure and stiffness are on a different scale. Reproduced with permission from reference47.
Myocardial Contractility
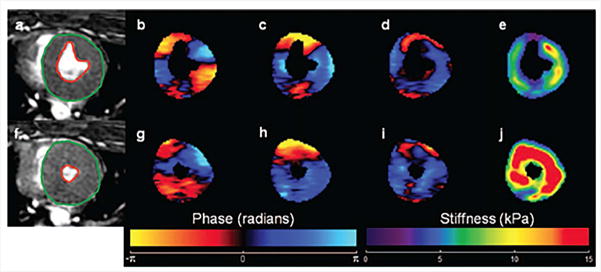
CMRE was performed to assess myocardial contractility based on the stiffness estimates in a porcine animal model73. First, baseline CMRE was performed during end-systole using a cine MRE sequence and then epinephrine was intravenously injected to increase the heart rate and myocardial contractility. As shown in Figure 9, after the fifth infusion of epinephrine the myocardium exhibited higher stiffness, and hence, higher contractility compared to the baseline74.
Figure 9. Effect of epinephrine infusion on LV stiffness.
(a) and (f) show end-systolic magnitude image of a pig’s heart at baseline and after fifth infusion of epinephrine, respectively. Snapshots of wave propagation through the myocardium in x, y and z directions for the baseline as well as for the fifth epinephrine infusion are shown in (b–d) and (g–i) respectively. The corresponding stiffness maps (e and j) demonstrate an increase in LV stiffness post infusion. Reproduced with permission from reference74.
Myocardial Infarction
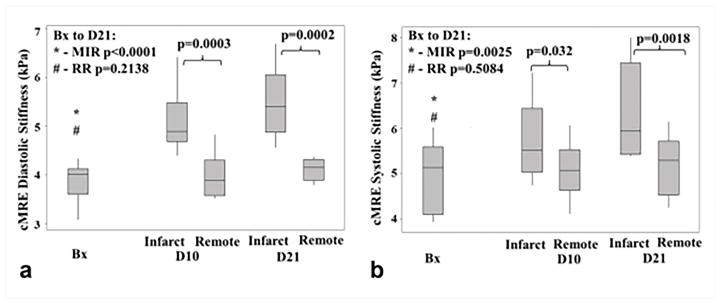
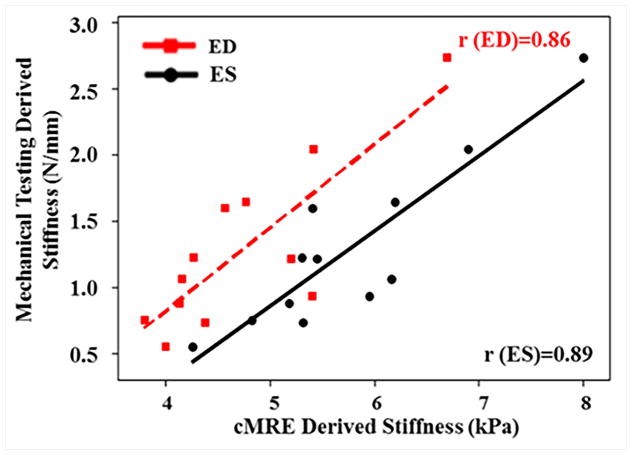
Myocardial infracts were created in a porcine animal model73. CMRE was performed pre-surgery (baseline) and at 10 days and 21 days post-surgery. After all imaging was performed on the 21st day, the animals were euthanized and the strips of infarct and remote normal myocardium were analyzed using mechanical testing to obtain the stiffness measurements73. As can be seen in Figure 10, a significant increase in CMRE-derived stiffness of infarct zone was observed from baseline to 10 days and 21 days post-surgery, whereas the stiffness of the remote normal myocardium remained unchanged. Furthermore, cardiac MRE-derived stiffness demonstrated good correlation with mechanical testing derived stiffness during end-diastole and end-systole by pooling both infarcted myocardium and remote normal myocardium as shown in the Figure 11. It is also important to understand that mechanical testing used in this study provides only the structural parameter (i.e. deflection per unit load, which has the units of N/mm. Whereas, MRE-derived stiffness measurement is in kPa (estimated based on wave speed of the propagating wave); therefore, both the measurements can only be correlated to demonstrate their relationship but the absolute values cannot be compared against each other. This study demonstrated the feasibility of cardiac MRE to estimate infarct stiffness. Similarly, another study by Arunachalam et al.75 also confirmed that infarcted myocardium was stiffer compared to the normal myocardium.
Figure 10. Effect of myocardial infarction on MRE-derived stiffness.
Box plots for cardiac MRE derived stiffness at baseline (Bx), 10 days (D10) and 21 days (D21) post infarction during systolic (a) and diastolic phases (b) phases are shown. Infarcted region exhibits monotonic increase in stiffness from baseline to 21 days post infarction, whereas no significant change in stiffness was observed in the remote normal region. Reproduced with permission from reference73.
Figure 11. Stiffness measurements obtained using MRE vs mechanical testing in a porcine study of myocardial infarction.
A linear relationship was observed at end-systole and as well as at end-diastole between MRE-derived stiffness and mechanical testing by pooling both infarcted myocardial and remote normal myocardium. Reproduced with permission from reference73.
Hypertensive animal model
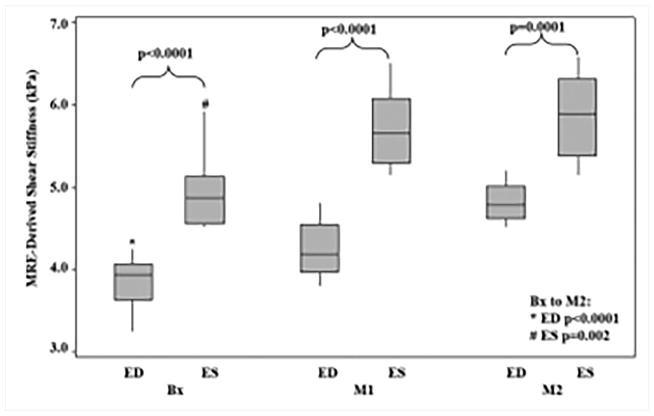
Renal wrapping surgery was performed in porcine animals to induce hypertension and hypertrophy, which eventually leads to heart failure. Cine MRE data and invasive pressure measurements were obtained at baseline, 1 month and 2 month post-surgery68. This study demonstrated that MRE-derived stiffness increased linearly with thickness and pressure and also showed that stiffness during end-systole and end-diastole was significantly higher at months 1 and 2 compared to the baseline (Figure 12)68.
Figure 12. Box plots for end-diastolic and end systolic cardiac phases.
The end systolic shear stiffness was significantly higher than the end diastolic from baseline to month 2 (end diastolic: P<0.0001, end systolic: P=0.002). For end diastolic the mean stiffness was 3.84 ± 0.4, 4.24 ± 0.3, and 4.82 ± 0.2, at Bx, M1 and M2, respectively. And for the end systolic the mean stiffness was 4.94 ± 0.5, 5.70 ± 0.5, and 5.88 ± 0.5, at Bx, M1, and M2, respectively. Reproduced with permission from reference68.
Human Studies
Normal Volunteers
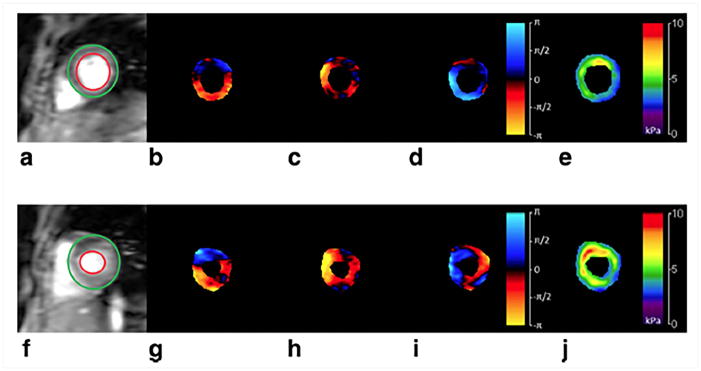
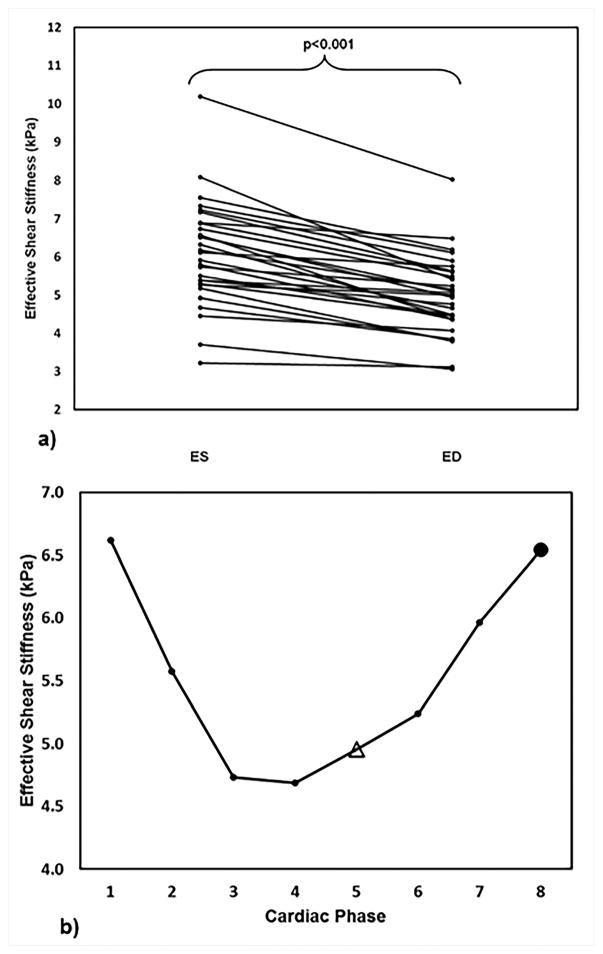
CMRE was performed on 29 normal volunteers, where the repeated measurements were obtained by asking the volunteer to leave the scan room after the first scan and repositioned again for the repeatability study. This study demonstrated that the technique is reproducible with a concordance correlation of 0.7767. Wave images and stiffness maps at end-systole and end-diastole from one of the volunteers are shown in Figure 13. Additionally, it was shown that the stiffness changes cyclically across the cardiac cycle and also demonstrating that end-systolic stiffness was significantly higher than the end-diastole (Figure 14). Furthermore, no correlation was found between increase in age and stiffness. However, this study provided normal stiffness values across age at an external driving frequency of 80Hz. Furthermore, a study by Elgeti et al.58 demonstrated that in 10 normal volunteer the shear wave amplitudes were significantly lower during end-systole compared to end-diastole indicating that end-systole is stiffer than end-diastole. Arani et al.61 also demonstrated feasibility of performing high frequency (i.e. 140Hz) CMRE in eight normal volunteers.
Figure 13. Shear waves and LV stiffness at end-diastole (top row) and end-systole (bottom row).
Wave propagation along three orthogonal axes at end-diastole and end-systole is shown in b–d and g–i respectively. Where X component of displacement is shown in b and g, Y component of displacement is shown in c and h, Z component of displacement is shown in d and i. Waves were generated by using a pneumatic driver at 60Hz. 3D LFE stiffness maps were generated and as expected, stiffness in systolic phase (j) is higher, as compared to that of diastolic phase (e). Reproduced with permission from reference67.
Figure 14. LV stiffness at different cardiac phases.
a) Consistently lower CMRE derived LV stiffness is observed at end-diastole, compared to end-systole. b) Plot of CMRE derived LV stiffness against cardiac phases in one of the volunteers demonstrating that CMRE is sensitive to changes in myocardial stiffness throughout the cardiac cycle. End-systole and end-diastole are represented by solid circle and open triangle, respectively. As expected, higher stiffness is observed at end systole. Reproduced with permission from reference67.
Diastolic dysfunction Patients
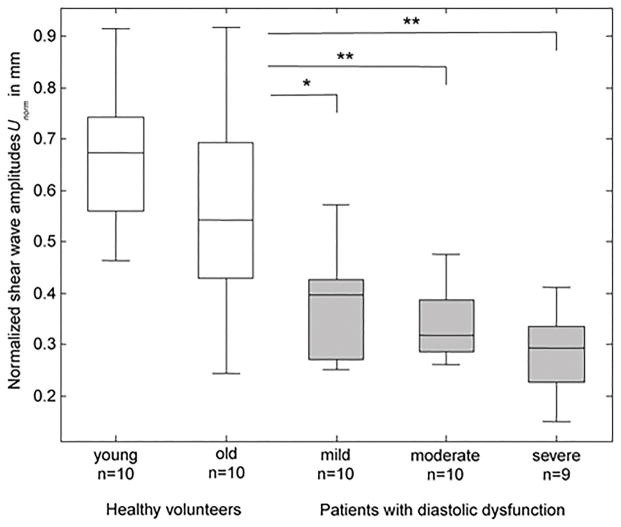
Elgeti et al.59,76,77 have performed a few cardiac MRE studies in 29 patients with relaxation abnormalities using a steady state GRE sequence, with a mechanical excitation frequency of 24.13 Hz. These studies reported significantly lower shear wave amplitudes in patients with mild to severe diastolic dysfunction or relaxation abnormalities, as compared with 20 normal subjects (Figure 15). Furthermore, it was shown that patients with diastolic dysfunction exhibited distinct isovolumetric elasticity relaxation of the left ventricle when compared to young or age matched old normal subjects.
Figure 15.
Shear wave amplitudes obtained in healthy volunteers (white boxes) and patients with diastolic dysfunction (gray boxes). Asterisks indicate significant difference between different groups of patients compared to normal subjects. Reproduced with permission from reference76.
Hypertrophic Cardiomyopathy and Cardiac Amyloidosis
Preliminary work was performed by Kolipaka et al.78 to estimate myocardial stiffness in two hypertrophic cardiomyopathy patients. Figure 16 shows an example of wave images and stiffness map in one of the patients. This study used a cine MRE sequence with an external driving frequency of 80Hz and demonstrated that myocardial stiffness was higher in the patients as compared to 18 normal subjects during end-diastole as well as end-systole with a mean stiffness of 7kPa and 14.5 kPa for patients and 2.7kPa and 5.6kPa for normal subjects respectively. Similarly, Arani et al.79 performed cardiac MRE using a cardiac gated SE-EPI sequence with 140Hz mechanical excitation in 22 cardiac amyloidosis patients during systolic phase and reported significantly higher myocardial stiffness in patients (median: 11.4kPa, min: 9.2kPa and max: 15.7kPa) compared to 16 normal controls (median: 8.2Kpa, min:7.2kPa and max: 11.8kPa).
Figure 16. Cardiac MRE results from a Hypertrophic cardiomyopathy patient.
a) End-systole magnitude image. Epicardium and endocardium contours are shown in green and red respectively. b–e) Through-plane component of the wave-displacement at 4 phase offsets were generated by using a pneumatic driver at 80 Hz of mechanical motion. f) Corresponding stiffness map were generated by using 2D phase gradient inversion algorithm. Reproduced with permission from reference78.
Anisotropic myocardial stiffness
All the above studies have demonstrated the use of cardiac MRE for potential clinical diagnosis and prognosis. However, all the measurements are assumed to be isotropic and termed “effective” as they do not consider anisotropy as well as complex geometry of the heart. Mazumder et al.80 developed waveguide cardiac MRE, in which diffusion tensor imaging (DTI) is performed in conjunction with cardiac MRE at the same spatial resolution to estimate the anisotropic stiffness of the myocardium. DTI is performed to obtain the fiber orientation. The CMRE displacement field is then resolved along and across the fibers to estimate the diagonal components of the stiffness tensor. This was the first study to demonstrate the feasibility of obtaining anisotropic stiffness in an in-vivo healthy porcine heart. This study showed that compressional stiffness along fibers is greater compared to that across the fibers. Additionally, compressional stiffness coefficients along and across fibers are greater than shear stiffness coefficients. However, it did not take geometry of the heart into account. Furthermore, Miller et al.81 performed finite element method (FEM) based inversion to estimate transverse isotropic stiffness in an ex-vivo canine left ventricular geometry (obtained from anatomical, cardiac cine and tagged images) and also incorporating fiber structure from ex-vivo DTI. CMRE based displacement field was simulated using FEM by assuming the stiffness tensor and solved to identify the determinability of anisotropic stiffness coefficients. This study demonstrated that CMRE could estimate anisotropic stiffness coefficients. However, more work is further warranted in this area.
Aortic MRE
Estimating the stiffness of the aortic wall has great potential in characterizing many aortic diseases such as systemic hypertension82, aortic aneurysms83 and Marfan syndrome84 etc. It is known that imaging the aortic wall is very challenging and requires high spatial resolution, leading to long scan times. Furthermore, inducing external vibrations in this thin aortic wall for aortic MRE is very challenging. However, recent studies have demonstrated the feasibility of visualizing the shear waves in the aortic wall and lumen. It is well known that shear waves do not propagate through liquids. Nevertheless, wave propagation in the lumen along with the aortic wall has been observed. This observed wave propagation in the aorta can be explained by the waveguide effect. When an aorta is vibrated, the aortic wall and the adjacent blood in the lumen vibrate with the same frequency, resulting in similar motion in the blood and aortic wall, which is encoded by MRE-MEG. Therefore, processing the waves in the lumen including aortic wall provides the stiffness map, which thus reflects the stiffness of the aortic wall. The studies discussed below were performed to show initial feasibility and validation of aortic MRE technique in phantoms, ex-vivo specimens and human subjects.
Phantom and Ex-vivo studies
To demonstrate the feasibility of aortic MRE in a fluid-filled vessel, MRE was performed on a thin walled latex vessel model with pressure sensitive wall thickness and luminal diameter. MRE was performed using the frequencies ranging from 100–500Hz to visualize the propagating waves and estimate the stiffness54, defined as the product between Young’s modulus and thickness of the wall. The stiffness of the fluid-filled latex vessel increased with increase in pressure and thickness, which is consistent with the Moens-Korteweg’s theory. Another aortic MRE study was performed in a vascular phantom made of silicone tubes embedded in a gel85, in which one of the tubes had higher stiffness compared to the other tube. MRE-derived stiffness maps confirmed the regional variation of stiffness in this vascular phantom. Furthermore, aortic MRE was performed in five ex-vivo porcine aortas under static pressure at 200Hz and demonstrated the propagating waves both in the lumen and aortic wall with stiffness values comparable to that reported in literature86.
Additional aortic MRE studies were performed in a control and hypertensive ex-vivo porcine aortas, where the mean arterial pressure was significantly higher in the hypertensive group compared to the control group71. As mentioned in the above studies, the Young’s modulus-thickness product was significantly higher in hypertensive group compare to control group. Histological analysis confirmed that intima-media thickness and collagen content increased in the hypertensive group, while elastin remained unchanged71. Furthermore, aortic MRE was performed in formalin fixed porcine aorta in which the MRE-derived stiffness measurements were compared against mechanical testing demonstrating an excellent correlation of R2 = 0.9786. Therefore, all the above studies have validated aortic MRE in phantoms and ex-vivo specimens against gold standard measurements.
In-vivo Animal Studies
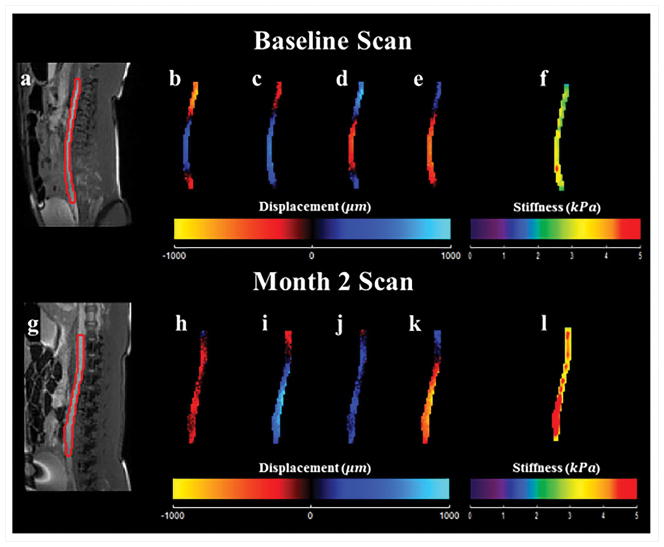
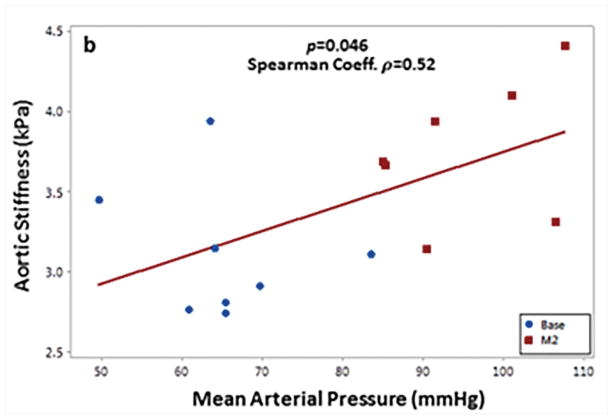
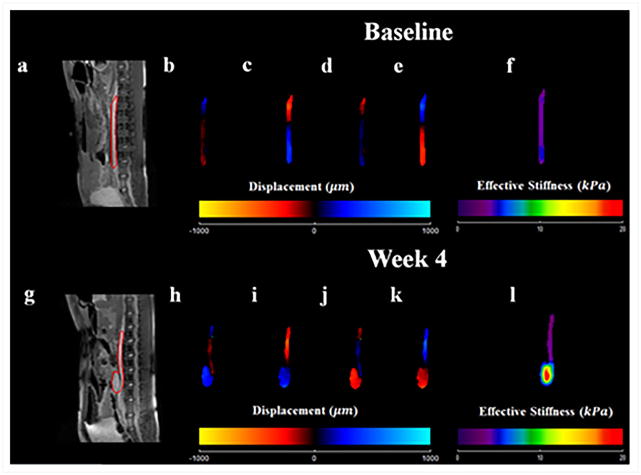
Systemic arterial hypertension was induced in eight porcine animals by performing renal wrapping surgery. Abdominal aortic MRE was performed at baseline and 2 months post-surgery55. This study demonstrated a significant increase in abdominal aortic stiffness from baseline to month 2 (Figure 17). A moderate linear correlation between mean arterial pressure and MRE-derived stiffness was also observed (Figure 18). In another animal study, abdominal aortic aneurysms were created in 10 porcine animals56 and the aneurysm stiffness was significantly higher than the normal aorta, as shown in the Figure 19 with a mean stiffness of 4.25 kPa and 10.16 kPa, respectively.
Figure 17. Hypertension related changes in aortic stiffness.
The top (a–f) and bottom (g–l) rows show acquired and calculated images from the baseline scan, and the scan 2 months after renal wrapping surgery, respectively. Magnitude images are displayed in (a) and (g). Snapshot of wave images in x-direction at 4 time points are shown in (b–e) and (h–k). These wave images were generated by using a pneumatic driver at 70 Hz of mechanical motion. As seen in the 3D LFE stiffness maps (f) and (l), higher stiffness was observed 2 months after renal wrapping surgery compared to baseline, suggesting that hypertension results in an increase in aortic stiffness and MRE is sensitive to these changes. Reproduced with permission from reference55.
Figure 18. Mean arterial pressure vs. aortic stiffness.
A moderate but significant spearman correlation was observed between aortic stiffness and mean arterial pressure. Reproduced with permission from reference55.
Figure 19. Aneurysm related changes in aortic stiffness.
The top (a–f) and bottom (g–l) rows show acquired and calculated images from the baseline scan, and the scan after 4 months of inducing AAA. Magnitude images are displayed in (a) and (g). Snapshot of wave images in x-direction at 4 time points are shown in (b–e) and (h–k). These wave images were generated by using a pneumatic driver at 70 Hz of mechanical motion. As seen in the 3D LFE stiffness maps (f) and (l), higher stiffness was observed 4 weeks after inducing AAA compared to baseline. Reproduced with permission from reference56.
Normal Volunteers
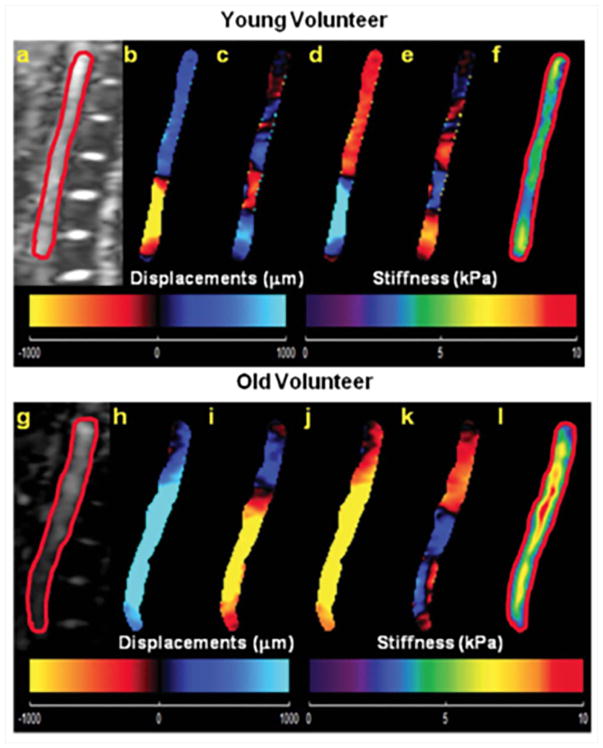
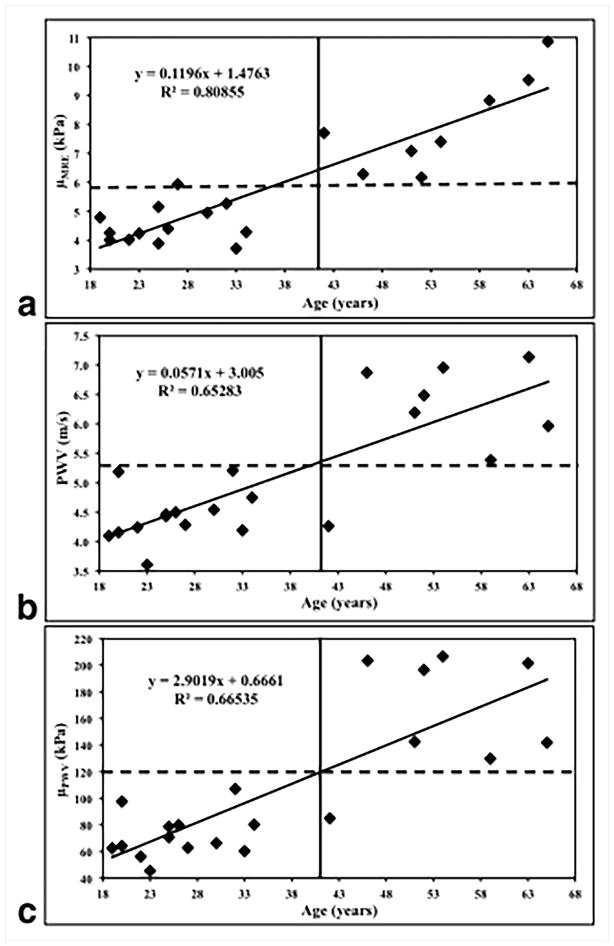
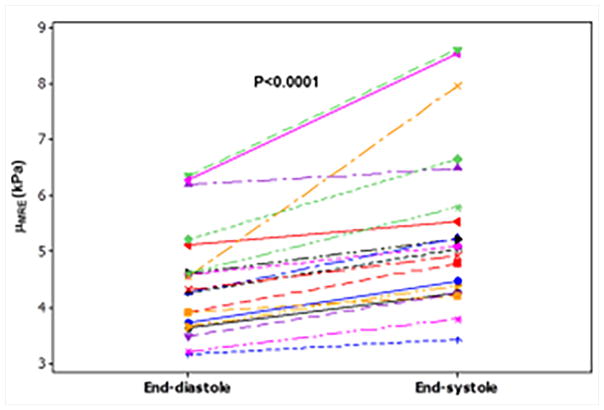
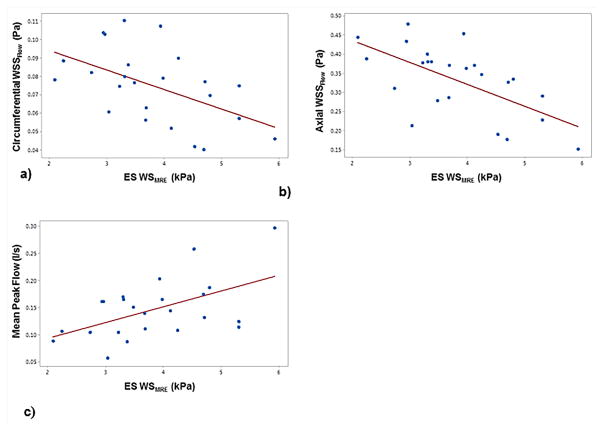
Abdominal aortic MRE and phase-contrast MRI was performed in 21 healthy volunteers with ages ranging from 18–65 years to obtain stiffness maps and PWV7. Figure 20 shows an example of wave images and stiffness map in a young and an old volunteer, demonstrating that the old volunteer has higher aortic stiffness compared to the young volunteer. It was shown that MRE-derived stiffness and PWV increased linearly with increase in age as shown in Figure 21. Because of the viscoelastic behavior of the aorta, a poor correlation was observed between MRE-derived stiffness and PWV-derived stiffness, as MRE was performed at 60Hz, whereas PWV was obtained at ~1Hz (which is based on the heart rate). Kenyhercz et al.46 demonstrated in 20 normal volunteers that aortic stiffness changed cyclically across the cardiac cycle and aortic stiffness is significantly higher during end-systole compared to end-diastole (Figure 22) due to the change in pressure across cardiac cycle. Recently, a study was performed in 24 normal volunteers to determine the relationship between aortic wall stiffness and wall shear stress87. As shown in Figure 23a–b, both the axial and circumferential wall shear stress correlated inversely with MRE-derived stiffness. Furthermore, positive correlation was found between wall stiffness and mean peak flow (Figure 23c).
Figure 20. Aortic MRE results from a young and an old subject.
Magnitude images of an abdominal aorta from a young and an old healthy volunteer are shown in a) and g) respectively. Wave images with 4 phase offsets in x-direction with adequate SNR were successfully obtained in young (b–e) as well as in old (h–k) volunteers by using a pneumatic driver at 60Hz of mechanical motion. Stiffness maps were calculated by using a single slice (2D) LFE inversion for the young and the old volunteer displayed in f) and l) respectively, and suggest an age-related increase in aortic stiffness. Indeed, a linear relationship between age and aortic stiffness was observed in this study. Reproduced with permission from reference7.
Figure 21. Age-related changes in aortic PWV and stiffness.
(a) Plot of MRE-derived stiffness (μMRE) against age. (b) Plot of MRI-based PWV against age. (c) Plot of the PWV-based stiffness (μPWV) against age. A strong linear relationship was observed in all three plots, as indicated by high R2 values. Reproduced with permission from reference7.
Figure 22. Stiffness values at end-diastole and end-systole for 20 healthy volunteers.
Higher aortic stiffness is observed at end-systole for all subjects. Reproduced with permission from reference46.
Figure 23. MRE-derived end-systolic wall stiffness (WSMRE) versus a) circumferential wall shear stress (WSSFlow), b) axial WSSFlow and c) mean peak flow.
A negative pearson correlation was observed between the wall stiffness and circumferential (r = 0.52, p < 0.016) as well as axial (r = 0.52, p < 0.006) wall shear stress, whereas a positive pearson correlation was observed between the wall stiffness and mean peak flow (r = 0.53, p < 0.016). Reproduced with permission from reference87.
Hypertension and Abdominal aortic aneurysms
It was demonstrated that aortic MRE-derived aortic stiffness was significantly higher in four hypertensive patients with a mean stiffness of 9.3kPa compared to four normotensives with a mean stiffness of 3.7kPa as shown in Figure 24 with an example of snapshot of wave images and stiffness map66. This study confirmed that aortic MRE can detect increase in stiffness in hypertensive patients as expected in the literature88.
Figure 24.
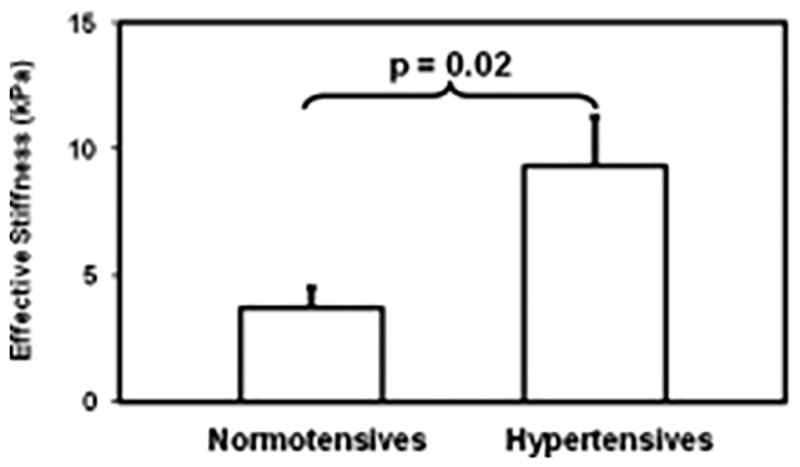
Shows a plot of mean aortic stiffness measurement for normotensive and hypertensive patients. The mean aortic stiffness was 3.7±0.8 kPa and 9.4±1.9 kPa for normotensives and hypertensives, respectively. A significant difference can be observed with a p-value of 0.02. Reproduced with permission from reference66.
Aortic MRE was performed on 25 AAA patients and 12 age matched normal volunteers69. It was shown that AAA stiffness (mean stiffness: 13.97kPa) was significantly higher than age matched normal aortic stiffness (mean stiffness: 8.87kPa). Furthermore, no correlation was found between AAA diameter and AAA stiffness with an example of AAA stiffness maps with different diameters as shown in Figure 25. This study demonstrated that AAA stiffness can potentially provide rupture risk when compared to AAA diameter.
Figure 25.
Stiffness maps for aortas with different diameters. Magnitude images (G, I and K) and corresponding aortic stiffness maps (H, J and L) for 3 patients with different AAA diameter. No clear relationship can be observed between aortic diameter and stiffness. Reproduced with permission from reference69.
Future work
All the above studies have demonstrated the potential of cardiovascular MRE for clinical translational research. However, it is important to develop a cardiac gated rapid cardiovascular MRE sequence to obtain the 3D wave field with 3D spatial data in a breath-hold or free breathing using respiratory navigator. One of the strategies can be an incorporation of random sampling approach with compressed sensing reconstruction. Furthermore, it is also important incorporate the geometry of the aorta and heart to obtain the true stiffness measurements. The current isotropic stiffness measurements are based on the assumption that waves are propagating in a uniform, infinite, homogeneous medium. However, because of the complex geometry of the heart and thickness of the myocardial wall changing during the cardiac cycle the wavelengths of the propagating waves are longer than the dimensions of the heart at currently applied frequencies. Similarly, aorta also experiences complex waves because of the geometric conditions, where the wavelengths are longer compared to its one of the dimensions. Therefore, the obtained isotropic stiffness estimates are termed “effective”. Future work requires developing inversions that consider geometry of the heart and aorta as well as fiber architecture of the heart to report the absolute stiffness estimates. Additionally, developing better drivers that generate high frequency waves which penetrate deeper into to the heart and aorta producing shorter wavelengths is also critical. These technical developments can enable cardiovascular MRE to transition into clinical practice.
This review article demonstrates that cardiovascular MRE is an emerging technology with a potential for clinical application of MRI for prognostic and diagnostic purposes.
Acknowledgments
Grant Sponsors:
This manuscript has been supported by grant sponsor: NIH–NHLBI; Grant number: NIHR01HL124096. Grant sponsor: American Heart Association; grant number: AHA13SDG14690027.
We would like to thank our grant sponsors: NIH–NHLBI; Grant number: NIHR01HL124096. And grant sponsor: American Heart Association; grant number: AHA13SDG14690027. FSF receives his scholarship from King Saud University, Department of Biomedical Technology.
Abbreviations
- MRE
Magnetic resonance elastography
- CVD
cardiovascular diseases
- LV
Left Ventricular
- P-V
pressure-volume
- DENSE
displacement encoding with stimulated echoes
- SENC
strain-encoded MRI
- PWV
pulse wave velocity
- MRI
magnetic resonance imaging
- MEG
motion encoding gradient
- ROI
region of interest
- CMRE
cardiac MRE
- GRE
gradient echo
- TR
repetition time
- TE
echo time
- GRAPPA
generalized autocalibrating partial parallel acquisition
- LFE
local frequency estimation
- DTI
diffusion tensor imaging
- FEM
finite element method
References
- 1.Mozaffarian D, Benjamin EJ, Go AS, et al. Executive summary. Circulation. 2015;131(4):434–441. [Google Scholar]
- 2.Bethesda M. [Accessed 04/19, 2017];NHLBI fact book, fiscal year 2012. http://www.nhlbi.nih.gov/about/documents/factbook/2012/chapter4. Updated 2012.
- 3.Pislaru C, Bruce CJ, Anagnostopoulos PC, et al. Ultrasound strain imaging of altered myocardial stiffness: Stunned versus infarcted reperfused myocardium. Circulation. 2004;109(23):2905–2910. doi: 10.1161/01.CIR.0000129311.73402.EF. [DOI] [PubMed] [Google Scholar]
- 4.Zile MR, Baicu CF, Gaasch WH. Diastolic heart failure—abnormalities in active relaxation and passive stiffness of the left ventricle. N Engl J Med. 2004;350(19):1953–1959. doi: 10.1056/NEJMoa032566. [DOI] [PubMed] [Google Scholar]
- 5.Miller CE, Wong CL, Sedmera D. Pressure overload alters stress-strain properties of the developing chick heart. Am J Physiol Heart Circ Physiol. 2003;285(5):H1849–56. doi: 10.1152/ajpheart.00384.2002. [DOI] [PubMed] [Google Scholar]
- 6.Hoskins AC, Jacques A, Bardswell SC, et al. Normal passive viscoelasticity but abnormal myofibrillar force generation in human hypertrophic cardiomyopathy. J Mol Cell Cardiol. 2010;49(5):737–745. doi: 10.1016/j.yjmcc.2010.06.006. [DOI] [PMC free article] [PubMed] [Google Scholar]
- 7.Damughatla AR, Raterman B, Sharkey-Toppen T, et al. Quantification of aortic stiffness using MR elastography and its comparison to MRI–based pulse wave velocity. J Magn Reson Imaging. 2015;41(1):44–51. doi: 10.1002/jmri.24506. [DOI] [PMC free article] [PubMed] [Google Scholar]
- 8.Holmes JW, Borg TK, Covell JW. Structure and mechanics of healing myocardial infarcts. Annu Rev Biomed Eng. 2005;7:223–253. doi: 10.1146/annurev.bioeng.7.060804.100453. [DOI] [PubMed] [Google Scholar]
- 9.Burkhoff D, Mirsky I, Suga H. Assessment of systolic and diastolic ventricular properties via pressure-volume analysis: A guide for clinical, translational, and basic researchers. Am J Physiol Heart Circ Physiol. 2005;289(2):H501–12. doi: 10.1152/ajpheart.00138.2005. [DOI] [PubMed] [Google Scholar]
- 10.Connelly CM, Vogel WM, Wiegner AW, et al. Effects of reperfusion after coronary artery occlusion on post-infarction scar tissue. Circ Res. 1985;57(4):562–577. doi: 10.1161/01.res.57.4.562. [DOI] [PubMed] [Google Scholar]
- 11.Lerman RH, Apstein CS, Kagan HM, et al. Myocardial healing and repair after experimental infarction in the rabbit. Circ Res. 1983;53(3):378–388. doi: 10.1161/01.res.53.3.378. [DOI] [PubMed] [Google Scholar]
- 12.Laird JD, Vellekoop HP. The course of passive elasticity of myocardial tissue following experimental infarction in rabbits and its relation to mechanical dysfunction. Circ Res. 1977;41(5):715–721. doi: 10.1161/01.res.41.5.715. [DOI] [PubMed] [Google Scholar]
- 13.Gupta KB, Ratcliffe MB, Fallert MA, Edmunds LH, Jr, Bogen DK. Changes in passive mechanical stiffness of myocardial tissue with aneurysm formation. Circulation. 1994;89(5):2315–2326. doi: 10.1161/01.cir.89.5.2315. [DOI] [PubMed] [Google Scholar]
- 14.Vorp DA, Raghavan M, Muluk SC, et al. Wall strength and stiffness of aneurysmal and nonaneurysmal abdominal aorta. Ann N Y Acad Sci. 1996;800(1):274–276. doi: 10.1111/j.1749-6632.1996.tb33330.x. [DOI] [PubMed] [Google Scholar]
- 15.Raghavan ML, Webster MW, Vorp DA. Ex vivo biomechanical behavior of abdominal aortic aneurysm: Assessment using a new mathematical model. Ann Biomed Eng. 1996;24(5):573–582. doi: 10.1007/BF02684226. [DOI] [PubMed] [Google Scholar]
- 16.Vorp DA, Vande Geest JP. Biomechanical determinants of abdominal aortic aneurysm rupture. Arterioscler Thromb Vasc Biol. 2005;25(8):1558–1566. doi: 10.1161/01.ATV.0000174129.77391.55. [DOI] [PubMed] [Google Scholar]
- 17.Azadani AN, Chitsaz S, Mannion A, et al. Biomechanical properties of human ascending thoracic aortic aneurysms. Ann Thorac Surg. 2013;96(1):50–58. doi: 10.1016/j.athoracsur.2013.03.094. [DOI] [PubMed] [Google Scholar]
- 18.Ferguson JJ, Julius S, Randall OS. Stroke volume--pulse pressure relationships in borderline hypertension: A possible indicator of decreased arterial compliance. J Hypertens Suppl. 1984;2(3):S397–9. [PubMed] [Google Scholar]
- 19.Slørdahl S, Piene H, Linker DT, Vik A. Segmental aortic wall stiffness from intravascular ultrasound at normal and subnormal aortic pressure in pigs. Acta Physiologica. 1991;143(3):227–232. doi: 10.1111/j.1748-1716.1991.tb09226.x. [DOI] [PubMed] [Google Scholar]
- 20.Patel DJ, Janicki JS, Carew TE. Static anisotropic elastic properties of the aorta in living dogs. Circ Res. 1969;25(6):765–779. doi: 10.1161/01.res.25.6.765. [DOI] [PubMed] [Google Scholar]
- 21.Young T. The croonian lecture. on the functions of the heart and arteries. 1800;1:314–316. [Google Scholar]
- 22.Paulus WJ, van Ballegoij JJ. Treatment of heart failure with normal ejection fraction: An inconvenient truth! J Am Coll Cardiol. 2010;55(6):526–537. doi: 10.1016/j.jacc.2009.06.067. [DOI] [PubMed] [Google Scholar]
- 23.Zerhouni EA, Parish DM, Rogers WJ, Yang A, Shapiro EP. Human heart: Tagging with MR imaging--a method for noninvasive assessment of myocardial motion. Radiology. 1988;169(1):59–63. doi: 10.1148/radiology.169.1.3420283. [DOI] [PubMed] [Google Scholar]
- 24.Kolipaka A, Chatzimavroudis GP, White RD, Lieber ML, Setser RM. Relationship between the extent of non-viable myocardium and regional left ventricular function in chronic ischemic heart disease. J Cardiovasc Magn Reson. 2005;7(3):573–579. doi: 10.1081/jcmr-200060652. [DOI] [PubMed] [Google Scholar]
- 25.Aletras AH, Ding S, Balaban RS, Wen H. DENSE: Displacement encoding with stimulated echoes in cardiac functional MRI. J Magn Reson. 1999;137(1):247–252. doi: 10.1006/jmre.1998.1676. [DOI] [PMC free article] [PubMed] [Google Scholar]
- 26.Pan L, Stuber M, Kraitchman DL, Fritzges DL, Gilson WD, Osman NF. Real-time imaging of regional myocardial function using fast-SENC. Magn Reson Med. 2006;55(2):386–395. doi: 10.1002/mrm.20770. [DOI] [PubMed] [Google Scholar]
- 27.Augenstein K, Cowan B, LeGrice I, Nielsen P, Young A. Method and apparatus for soft tissue material parameter estimation using tissue tagged magnetic resonance imaging. J Biomech Eng -Trans ASME. 2005;127(1):148–157. doi: 10.1115/1.1835360. [DOI] [PubMed] [Google Scholar]
- 28.Wang VY, Lam HI, Ennis DB, Cowan BR, Young AA, Nash MP. Modelling passive diastolic mechanics with quantitative MRI of cardiac structure and function. Med Image Anal. 2009;13(5):773–784. doi: 10.1016/j.media.2009.07.006. [DOI] [PMC free article] [PubMed] [Google Scholar]
- 29.Laurent S, Cockcroft J, Van Bortel L, et al. Expert consensus document on arterial stiffness: Methodological issues and clinical applications. Eur Heart J. 2006;27(21):2588–2605. doi: 10.1093/eurheartj/ehl254. [DOI] [PubMed] [Google Scholar]
- 30.Parati G, De Buyzere M. Evaluating aortic stiffness through an arm cuff oscillometric device: Is validation against invasive measurements enough? J Hypertens. 2010;28(10):2003–2006. doi: 10.1097/HJH.0b013e32833f0e93. [DOI] [PubMed] [Google Scholar]
- 31.Salvi P, Lio G, Labat C, Ricci E, Pannier B, Benetos A. Validation of a new non-invasive portable tonometer for determining arterial pressure wave and pulse wave velocity: The PulsePen device. J Hypertens. 2004;22(12):2285–2293. doi: 10.1097/00004872-200412000-00010. [DOI] [PubMed] [Google Scholar]
- 32.Salvi P, Safar ME, Parati G. Arterial applanation tonometry: Technical aspects relevant for its daily clinical use. J Hypertens. 2013;31(3):469–471. doi: 10.1097/HJH.0b013e32835e3422. [DOI] [PubMed] [Google Scholar]
- 33.O’Rourke MF. Wave travel and reflection in the arterial system. J Hypertens Suppl. 1999;17(5):S45–7. [PubMed] [Google Scholar]
- 34.O’Rourke MF. Isolated systolic hypertension, pulse pressure, and arterial stiffness as risk factors for cardiovascular disease. Curr Hypertens Rep. 1999;1(3):204–211. doi: 10.1007/s11906-999-0022-9. [DOI] [PubMed] [Google Scholar]
- 35.DeLoach SS, Townsend RR. Vascular stiffness: Its measurement and significance for epidemiologic and outcome studies. Clin J Am Soc Nephrol. 2008;3(1):184–192. doi: 10.2215/CJN.03340807. [DOI] [PubMed] [Google Scholar]
- 36.KARAMANOGLU M, OROURKE M, AVOLIO A, KELLY R. An analysis of the relationship between central aortic and peripheral upper limb pressure waves in man. Eur Heart J. 1993;14(2):160–167. doi: 10.1093/eurheartj/14.2.160. [DOI] [PubMed] [Google Scholar]
- 37.Lehmann ED. Clinical value of aortic pulse-wave velocity measurement. The Lancet. 1999;354(9178):528–529. doi: 10.1016/S0140-6736(99)00179-8. [DOI] [PubMed] [Google Scholar]
- 38.Zhang X, Kinnick R, Fatemi M, Greenleaf J. Noninvasive method for estimation of complex elastic modulus of arterial vessels. IEEE Trans Ultrason Ferroelectr Freq Control. 2005;52(4):642–652. doi: 10.1109/tuffc.2005.1428047. [DOI] [PubMed] [Google Scholar]
- 39.Segers P, Kips J, Trachet B, et al. Limitations and pitfalls of non-invasive measurement of arterial pressure wave reflections and pulse wave velocity. Artery Research. 2009;3(2):79–88. [Google Scholar]
- 40.Yu HY, Peng H, Wang J, Wen C, Tseng WI. Quantification of the pulse wave velocity of the descending aorta using axial velocity profiles from phase-contrast magnetic resonance imaging. Magn Reson Med. 2006;56(4):876–883. doi: 10.1002/mrm.21034. [DOI] [PubMed] [Google Scholar]
- 41.Fielden SW, Fornwalt BK, Jerosch-Herold M, Eisner RL, Stillman AE, Oshinski JN. A new method for the determination of aortic pulse wave velocity using cross-correlation on 2D PCMR velocity data. J Magn Reson Imaging. 2008;27(6):1382–1387. doi: 10.1002/jmri.21387. [DOI] [PubMed] [Google Scholar]
- 42.Luo J, Fujikura K, Tyrie LS, Tilson MD, Konofagou EE. Pulse wave imaging of normal and aneurysmal abdominal aortas in vivo. IEEE Trans Med Imaging. 2009;28(4):477–486. doi: 10.1109/TMI.2008.928179. [DOI] [PubMed] [Google Scholar]
- 43.Vappou J, Luo J, Konofagou EE. Pulse wave imaging for noninvasive and quantitative measurement of arterial stiffness in vivo. Am J Hypertens. 2010;23(4):393–398. doi: 10.1038/ajh.2009.272. [DOI] [PMC free article] [PubMed] [Google Scholar]
- 44.Murphy MC, Jones DT, Jack CR, et al. Regional brain stiffness changes across the alzheimer’s disease spectrum. NeuroImage: Clinical. 2016;10:283–290. doi: 10.1016/j.nicl.2015.12.007. [DOI] [PMC free article] [PubMed] [Google Scholar]
- 45.Xu L, Chen J, Glaser KJ, Yin M, Rossman PJ, Ehman RL. MR elastography of the human abdominal aorta: A preliminary study. J Magn Reson Imaging. 2013;38(6):1549–1553. doi: 10.1002/jmri.24056. [DOI] [PMC free article] [PubMed] [Google Scholar]
- 46.Kenyhercz WE, Raterman B, Illapani VSP, et al. Quantification of aortic stiffness using magnetic resonance elastography: Measurement reproducibility, pulse wave velocity comparison, changes over cardiac cycle, and relationship with age. Magn Reson Med. 2015 doi: 10.1002/mrm.25719. [DOI] [PMC free article] [PubMed] [Google Scholar]
- 47.Kolipaka A, Araoz PA, McGee KP, Manduca A, Ehman RL. Magnetic resonance elastography as a method for the assessment of effective myocardial stiffness throughout the cardiac cycle. Magn Reson Med. 2010;64(3):862–870. doi: 10.1002/mrm.22467. [DOI] [PMC free article] [PubMed] [Google Scholar]
- 48.Mariappan YK, Glaser KJ, Ehman RL. Magnetic resonance elastography: A review. Clinical Anatomy. 2010;23(5):497–511. doi: 10.1002/ca.21006. [DOI] [PMC free article] [PubMed] [Google Scholar]
- 49.Ugander M, Oki AJ, Hsu LY, et al. Extracellular volume imaging by magnetic resonance imaging provides insights into overt and sub-clinical myocardial pathology. Eur Heart J. 2012;33(10):1268–1278. doi: 10.1093/eurheartj/ehr481. [DOI] [PMC free article] [PubMed] [Google Scholar]
- 50.Liu Y, Royston TJ, Klatt D, Lewandowski ED. Cardiac MR elastography of the mouse: Initial results. Magn Reson Med. 2016 doi: 10.1002/mrm.26030. [DOI] [PMC free article] [PubMed] [Google Scholar]
- 51.Rump J, Klatt D, Braun J, Warmuth C, Sack I. Fractional encoding of harmonic motions in MR elastography. Magn Reson Med. 2007;57(2):388–395. doi: 10.1002/mrm.21152. [DOI] [PubMed] [Google Scholar]
- 52.Elgeti T, Laule M, Kaufels N, et al. Cardiac MR elastography: Comparison with left ventricular pressure measurement. J Cardiovasc Magn Reson. 2009;11(1):44. doi: 10.1186/1532-429X-11-44. [DOI] [PMC free article] [PubMed] [Google Scholar]
- 53.Sack I, Rump J, Elgeti T, Samani A, Braun J. MR elastography of the human heart: Noninvasive assessment of myocardial elasticity changes by shear wave amplitude variations. Magn Reson Med. 2009;61(3):668–677. doi: 10.1002/mrm.21878. [DOI] [PubMed] [Google Scholar]
- 54.Woodrum DA, Romano AJ, Lerman A, et al. Vascular wall elasticity measurement by magnetic resonance imaging. Magn Reson Med. 2006;56(3):593–600. doi: 10.1002/mrm.20991. [DOI] [PubMed] [Google Scholar]
- 55.Dong H, Mazumder R, Illapani VSP, Mo X, White RD, Kolipaka A. In vivo quantification of aortic stiffness using MR elastography in hypertensive porcine model. Magn Reson Med. 2017 doi: 10.1002/mrm.26601. [DOI] [PMC free article] [PubMed] [Google Scholar]
- 56.Dong H, Joseph M, Kalra P, et al. In vivo magnetic resonance elastography of abdominal aortic aneurysm in a porcine model. Proc Intl Soc Mag Reson Med. 2017;25:6543. [Google Scholar]
- 57.Kolipaka A, McGee KP, Araoz PA, Glaser KJ, Manduca A, Ehman RL. Evaluation of a rapid, multiphase MRE sequence in a heart-simulating phantom. Magn Reson Med. 2009;62(3):691–698. doi: 10.1002/mrm.22048. [DOI] [PMC free article] [PubMed] [Google Scholar]
- 58.Elgeti T, Tzschaetzsch H, Hirsch S, et al. Vibration-synchronized magnetic resonance imaging for the detection of myocardial elasticity changes. Magn Reson Med. 2012;67(4):919–924. doi: 10.1002/mrm.24185. [DOI] [PubMed] [Google Scholar]
- 59.Elgeti T, Beling M, Hamm B, Braun J, Sack I. Cardiac magnetic resonance elastography toward the diagnosis of abnormal myocardial relaxation. Invest Radiol. 2010;45(12):782–787. doi: 10.1097/RLI.0b013e3181ec4b63. [DOI] [PubMed] [Google Scholar]
- 60.Sinkus R, Robert B, Gennisson J, Tanter M, Fink M. Single breath hold transient MR-elastography of the heart-imaging pulsed shear wave propagation induced by aortic valve closure. Proc Intl Soc Mag Reson Med. 2006;14:77. [Google Scholar]
- 61.Arani A, Glaser KL, Arunachalam SP, et al. In vivo, high-frequency three-dimensional cardiac MR elastography: Feasibility in normal volunteers. Magn Reson Med. 2016 doi: 10.1002/mrm.26101. [DOI] [PMC free article] [PubMed] [Google Scholar]
- 62.Robert B, Sinkus R, Gennisson J, Fink M. Application of DENSE-MR-elastography to the human heart. Magn Reson Med. 2009;62(5):1155–1163. doi: 10.1002/mrm.22124. [DOI] [PubMed] [Google Scholar]
- 63.Manduca A, Oliphant TE, Dresner M, et al. Magnetic resonance elastography: Non-invasive mapping of tissue elasticity. Med Image Anal. 2001;5(4):237–254. doi: 10.1016/s1361-8415(00)00039-6. [DOI] [PubMed] [Google Scholar]
- 64.Knutsson H, Westin C, Granlund G. Local multiscale frequency and bandwidth estimation. Proc IEEE Intl Conf 1st Intl Conf Image Processing. 1994;1:36–40. [Google Scholar]
- 65.Kolipaka A, McGee KP, Araoz PA, et al. MR elastography as a method for the assessment of myocardial stiffness: Comparison with an established pressure–volume model in a left ventricular model of the heart. Magn Reson Med. 2009;62(1):135–140. doi: 10.1002/mrm.21991. [DOI] [PMC free article] [PubMed] [Google Scholar]
- 66.Kolipaka A, Woodrum D, Araoz PA, Ehman RL. MR elastography of the in vivo abdominal aorta: A feasibility study for comparing aortic stiffness between hypertensives and normotensives. JMRI. 2011;35(3):582–586. doi: 10.1002/jmri.22866. [DOI] [PMC free article] [PubMed] [Google Scholar]
- 67.Wassenaar PA, Eleswarpu CN, Schroeder SA, et al. Measuring age-dependent myocardial stiffness across the cardiac cycle using MR elastography: A reproducibility study. Magn Reson Med. 2015 doi: 10.1002/mrm.25760. [DOI] [PMC free article] [PubMed] [Google Scholar]
- 68.Mazumder R, Schroeder S, Mo X, Clymer BD, White RD, Kolipaka A. In vivo quantification of myocardial stiffness in hypertensive porcine hearts using MR elastography. J Magn Reson Imaging. 2017;45(3):813–820. doi: 10.1002/jmri.25423. [DOI] [PMC free article] [PubMed] [Google Scholar]
- 69.Kolipaka A, Illapani VSP, Kenyhercz W, et al. Quantification of abdominal aortic aneurysm stiffness using magnetic resonance elastography and its comparison to aneurysm diameter. Journal of vascular surgery. 2016;64(4):966–974. doi: 10.1016/j.jvs.2016.03.426. [DOI] [PMC free article] [PubMed] [Google Scholar]
- 70.Manduca A, Lake DS, Kruse SA, Ehman RL. Spatio-temporal directional filtering for improved inversion of MR elastography images. Med Image Anal. 2003;7(4):465–473. doi: 10.1016/s1361-8415(03)00038-0. [DOI] [PubMed] [Google Scholar]
- 71.Woodrum DA, Herrmann J, Lerman A, Romano AJ, Lerman LO, Ehman RL. Phase-contrast MRI-based elastography technique detects early hypertensive changes in ex vivo porcine aortic wall. J Magn Reson Imaging. 2009;29(3):583–587. doi: 10.1002/jmri.21702. [DOI] [PMC free article] [PubMed] [Google Scholar]
- 72.Elgeti T, Rump J, Hamhaber U, et al. Cardiac magnetic resonance elastography. initial results. Invest Radiol. 2008;43(11):762–772. doi: 10.1097/RLI.0b013e3181822085. [DOI] [PubMed] [Google Scholar]
- 73.Mazumder R, Schroeder S, Mo X, et al. In vivo magnetic resonance elastography to estimate left ventricular stiffness in a myocardial infarction induced porcine model. J Magn Reson Imaging. 2017;45(4):1024–1033. doi: 10.1002/jmri.25432. [DOI] [PMC free article] [PubMed] [Google Scholar]
- 74.Kolipaka A, Aggarwal SR, McGee KP, et al. Magnetic resonance elastography as a method to estimate myocardial contractility. J Magn Reson Imaging. 2012;36(1):120–127. doi: 10.1002/jmri.23616. [DOI] [PMC free article] [PubMed] [Google Scholar]
- 75.Arunachalam SP, Arani A, Baffour F, et al. Regional assessment of in vivo myocardial stiffness using 3D magnetic resonance elastography in a porcine model of myocardial infarction. Magn Reson Med. 2017 doi: 10.1002/mrm.26695. [DOI] [PMC free article] [PubMed] [Google Scholar]
- 76.Elgeti T, Knebel F, Haettasch R, Hamm B, Braun J, Sack I. Shear-wave amplitudes measured with cardiac MR elastography for diagnosis of diastolic dysfunction. Radiology. 2014;271(3):681–687. doi: 10.1148/radiol.13131605. [DOI] [PubMed] [Google Scholar]
- 77.Elgeti T, Steffen IG, Knebel F, et al. Time-resolved analysis of left ventricular shear wave amplitudes in cardiac elastography for the diagnosis of diastolic dysfunction. Invest Radiol. 2016;51(1):1–6. doi: 10.1097/RLI.0000000000000198. [DOI] [PubMed] [Google Scholar]
- 78.Kolipaka A, McGee K, Aggarwal S, et al. A feasibility study: MR elastography as a method to compare stiffness estimates in hypertrophic obstructive cardiomyopathy and in normal volunteers. Proc Int Soc Magn Reson Med Sci Meet Exhib. 2011 [Google Scholar]
- 79.Arani A, Arunachalam SP, Chang IC, et al. Cardiac MR elastography for quantitative assessment of elevated myocardial stiffness in cardiac amyloidosis. J Magn Reson Imaging. 2017 doi: 10.1002/jmri.25678. [DOI] [PMC free article] [PubMed] [Google Scholar]
- 80.Mazumder R, Clymer BD, White RD, Romano A, Kolipaka A. In-vivo waveguide cardiac magnetic resonance elastography. J Cardiovasc Magn Reson. 2015;17(Suppl 1):P35. [Google Scholar]
- 81.Miller R, Jiang H, Mazumder R, et al. Determining anisotropic myocardial stiffness from magnetic resonance elastography: A simulation study. Intl Conf Funct Imaging and Modeling the Heart; 2015; pp. 346–354. [Google Scholar]
- 82.Agabiti-Rosei E, Porteri E, Rizzoni D. Arterial stiffness, hypertension, and rational use of nebivolol. Vasc Health Risk Manag. 2009;5(1):353–360. doi: 10.2147/vhrm.s3056. [DOI] [PMC free article] [PubMed] [Google Scholar]
- 83.Kadoglou NP, Papadakis I, Moulakakis KG, et al. Arterial stiffness and novel biomarkers in patients with abdominal aortic aneurysms. Regul Pept. 2012;179(1):50–54. doi: 10.1016/j.regpep.2012.08.014. [DOI] [PubMed] [Google Scholar]
- 84.Kiotsekoglou A, Moggridge JC, Saha SK, et al. Assessment of aortic stiffness in marfan syndrome using Two-Dimensional and doppler echocardiography. Echocardiography. 2011;28(1):29–37. doi: 10.1111/j.1540-8175.2010.01241.x. [DOI] [PubMed] [Google Scholar]
- 85.Zhang N, Chen J, Yin M, Glaser KJ, Xu L, Ehman RL. Quantification of regional aortic stiffness using MR elastography: A phantom and ex-vivo porcine aorta study. Magn Reson Imaging. 2016;34(2):91–96. doi: 10.1016/j.mri.2015.10.011. [DOI] [PMC free article] [PubMed] [Google Scholar]
- 86.Xu L, Chen J, Yin M, et al. Assessment of stiffness changes in the ex vivo porcine aortic wall using magnetic resonance elastography. Magn Reson Imaging. 2012;30(1):122–127. doi: 10.1016/j.mri.2011.09.009. [DOI] [PMC free article] [PubMed] [Google Scholar]
- 87.Kolipaka A, Illapani VSP, Kalra P, et al. Quantification and comparison of 4D-flow MRI-derived wall shear stress and MRE-derived wall stiffness of the abdominal aorta. J Magn Reson Imaging. 2017;45(3):771–778. doi: 10.1002/jmri.25445. [DOI] [PMC free article] [PubMed] [Google Scholar]
- 88.O’Rourke MF, Nichols WW. Aortic diameter, aortic stiffness, and wave reflection increase with age and isolated systolic hypertension. Hypertension. 2005;45(4):652–658. doi: 10.1161/01.HYP.0000153793.84859.b8. [DOI] [PubMed] [Google Scholar]


