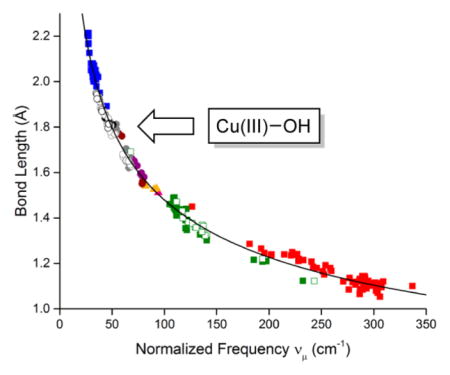
Abstract
The stretching frequency, ν(Cu–O), of the [CuOH]2+ core in the complexes LCuOH (L = N,N′-bis(2,6-diisopropyl-4-R-phenyl)pyridine-2,6-dicarboxamide, R = H or NO2, or N,N′-bis(2,6-diisopropylphenyl)-1-methylpiperidine-2,6-dicarboxamide) was determined to be ~630 cm−1 by resonance Raman spectroscopy and verified by isotopic labeling. In efforts to use Badger’s rule to estimate the bond distance corresponding to ν(Cu–O), a modified version of the rule was developed through use of stretching frequencies normalized by dividing by the appropriate reduced masses. The modified version was found to yield excellent fits of normalized frequencies to bond distances for >250 data points from theory and experiment for a variety of M–X and X–X bond distances in the range ~1.1–2.2 Å (root mean squared errors for the predicted bond distances of 0.03 Å). Using the resulting general equation, the Cu–O bond distance was predicted to be ~1.80 Å for the reactive [CuOH]2+ core. Limitations of the equation and its use in predictions of distances in a variety of moieties for which structural information is not available were explored.
Graphical Abstract
INTRODUCTION
The recently discovered [CuOH]2+ core1–4 represents a new motif in copper–oxygen chemistry5 of potential relevance to oxidation catalysis.6 Complexes with this core (Figure 1), which may be viewed as a protonated version of the [CuO]+ moiety that has been elusive in synthetic chemistry,7 exhibit high rates of proton-coupled electron transfer reactions with C–H and O–H bonds. Mechanistic studies have elucidated many aspects of the kinetic and thermodynamic characteristics of these reactions. Yet, due to their high reactivity which is manifested by thermal instability, efforts to define the detailed structure of the complexes through X-ray crystallography have been stymied so far. Thus, their description as copper(III)-hydroxide species has relied upon spectroscopy and theory. Cu K-edge X-ray absorption spectroscopy for the parent system, 1,1 showed increases in edge energies of ~1.7 eV upon 1-electron oxidation of the Cu(II) precursor complex, [1]−, consistent with primarily metal-centered oxidation to Cu(III). Also consistent with this formulation, the oxidized EPR silent complexes exhibit an intense feature in UV–vis absorption spectra at ~550 nm assigned by TD-DFT as a ligand aryl π → Cu dx2−y2 transition, and the average Cu–O/N bond distances were found by EXAFS to decrease upon oxidation from 1.95 to 1.86 Å. Nonetheless, because EXAFS gives only average Cu–O/N distances, experimental determination of the key Cu(III)–OH bond length has not been possible. Seeking to understand more fully the nature of the bonding in the reactive [CuOH]2+ core and how it differs from that of its precursor [CuOH]+ unit, we therefore targeted an alternative method to determine the Cu(III)–OH bond distance.
Figure 1.
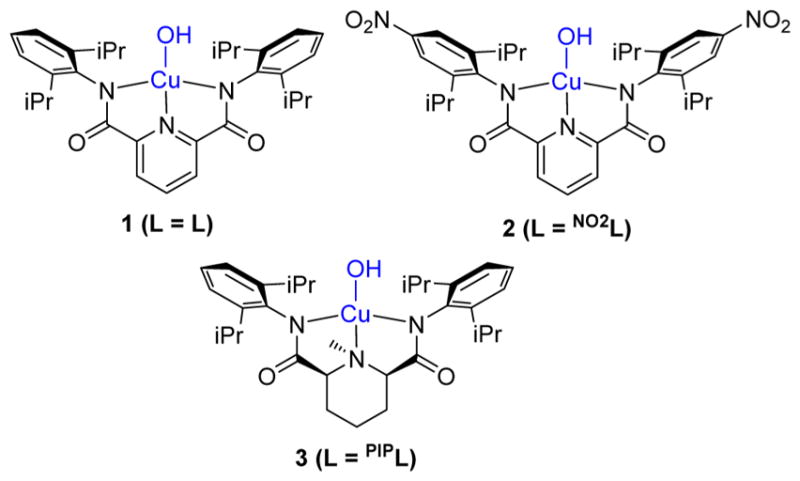
Complexes studied in this work.
Previous work demonstrated the utility of Badger’s rule to relate vibrational frequencies to bond distances for various atomic pairs. Badger’s rule is usually written as eq 1, where re is equilibrium bond distance, k is force constant (which can be substituted with ν, the stretching frequency), and Cij and dij are empirically fitted values.8 Typically, plots of bond distances vs ν−2/3 or k−1/3 for a set of compounds comprising a particular atomic pair are fit to eq 1 to determine Cij and dij, which then allows a newly measured force constant or vibrational frequency to be used to calculate an unknown bond distance (or vice versa). This type of analysis has been applied toward many atomic pairs of relevance to inorganic compounds, including O–O,9,10 N–N,10 S–S,11 Cu–S,12 Mn–O,13 and Fe–O(H).14 Badger’s rule relationships also have been assembled through DFT calculations, which are less subject to experimental interference found in EXAFS spectroscopy or X-ray crystallography.9b,14 The empirically fitted values (Cij and dij) require reparameterization for each atomic pair, as plots of bond length vs force constant for different atomic pairs exhibit “striations” (multiple trend lines), with a relationship between a given striation and the rows of the periodic table that comprise the atomic pair.8 Thus, we envisioned that if ν(Cu–O) for the [CuOH]2+ complexes could be measured, Badger’s rule could be applied to determine the Cu–O distances. However, this method would only give precise results if sufficient vibrational and structural data for Cu–O over a large range of values were available so that Cij and dij for that pair could be accurately determined. Unfortunately, a literature search revealed that such data are lacking, so a more general version of Badger’s rule that would enable use of data for a variety of atomic pairs over a larger range of force constants and bond distances was sought.15
| (1) |
Herein, we report the successful determination of ν(Cu–O) for the [CuOH]2+ complexes 1–3 using resonance Raman (rR) spectroscopy. We also developed and validated a useful normalized version of Badger’s rule that has broad applicability for correlating vibrational frequencies and bond distances, determined via theory or experiment, for a wide range of atomic pairs. Using this relationship, we were able to estimate the Cu–O bond distance within 1–3, thus enabling comparisons to their Cu(II) precursors.
EXPERIMENTAL SECTION
General Procedures
All reagents and solvents were purchased from commercial sources and used as received unless otherwise noted. Tetrahydrofuran (THF) was dried over sodium/benzophenone and vacuum distilled. 1,2-Difluorobenzene (DFB) and dichloromethane were dried over calcium hydride and vacuum distilled. Diethyl ether and toluene were passed through solvent purification columns (Glass Contour, Laguna, CA). All solvents were stored over 3 Å molecular sieves in a N2 filled glovebox prior to use. Metal complexes were synthesized and manipulated in a Vacuum Atmospheres glovebox under an inert atmosphere of nitrogen or through use of standard Schlenk-line techniques under argon. HPLC grade water (from Sigma-Aldrich) was used for synthesis, and H218O (97% labeled) was purchased from Cambridge Isotope Laboratories, Inc. The compounds LCuII–NCMe,1 [NEt4][NO2LCuII–OH],3 and [NBu4][PIPLCuII–OH]3 were prepared using previously described methods.
Physical Methods
X-ray diffraction measurements were collected with Mo Kα radiation with a graphite monochromator and a Bruker APEX II CCD instrument. Resonance Raman (rR) spectra were recorded on an Acton 506 spectrometer using a Princeton Instruments LN/CCD-11100-PB/UBAR detector and ST-1385 controller interfaced with Winspec software. The spectra were obtained at 77 K using a backscattering geometry. Excitation at 514.5 nm was provided by a Spectra-Physics BeamLok 2060-KR-V Argon ion laser while excitation at 515 nm was provided by a Fandango 50 mW solid state laser. Raman shifts were externally referenced to indene and internally referenced to solvent (CH2Cl2 or DFB). Two concentrations of every sample were made to ensure a linear response in the peak intensity. Spectra were baseline corrected and normalized using Origin (2016) software. Hooke’s law was used to determine the force constant (k) and the expected shift upon isotopic labeling:
| (2) |
| (3) |
where ν is the stretching frequency (in Hz), μ is the reduced mass (in kg), and m1 and m2 are the masses of the atoms involved in the vibration (in kg).16 The final units of k are N m−1, which are converted to mdyn Å−1 by dividing by 100. We note that the expected Hooke’s Law shift can be calculated using Cu–O or Cu–OH, keeping the –OH moiety as one of the masses. Calculating the expected shift for the 633 cm−1 peak of 1, we predict ν(Cu–O) Δ18O = 29 cm−1 or ν(Cu–OH) Δ18O = 27 cm−1. All data fitting was performed using the Origin (2016) software with convergence criteria set to 1e−15.
X-ray Diffraction of [NBu4][LCuII–OH]
Crystals were obtained as blue needles by layering toluene over THF at −20 °C in an inert atmosphere drybox. Full details of the structure determination are provided as Supporting Information (CIF).
Synthesis and rR Preparation of (LCuIII–16/18OH), 1
This procedure is a modified preparation of 1, as previously reported.1 Under a stream of Ar, powdered NEt4OH·5H2O (10 mg, 0.04 mmol) was added to a 10 mL Schlenk tube. Dry diethyl ether (5 mL) was cannulated into the tube, and 50 μL of water [either H2O or H218O] was added, which is >10 equiv of added water per oxygen found in NEt4OH·5H2O. This was left to stir under Ar at room temperature overnight. Under a stream of Ar, powdered LCuII–NCMe (23 mg, 0.04 mmol) was added to the tube immediately precipitating a blue powder that was left to stir for 10 min (forming [NEt4][1(16/18OH)]). The sample was dried under vacuum to remove any solvent. The tube was brought into an inert-atmosphere drybox where (assuming quantitative conversion) 5 mL of dry CH2Cl2 was added (forming an 8 mM solution). A 0.4 mL aliquot was added to an EPR tube and capped with a septum. A needle and syringe were preloaded with 0.4 mL of 8 mM FcPF6 [Fc = ferrocenium] in CH2Cl2 and inserted into the septum. The EPR tube with syringe was removed from the drybox and placed under a stream of Ar and cooled to −80 °C. The contents of the syringe were very slowly added to the EPR tube allowing time for the solution in the needle to cool down to −80 °C in the EPR tube prior to vigorous mixing. The EPR tube was slowly bubbled three times by filling the emptied syringe with the Ar atmosphere to mix the solution, turning the solution deep purple (forming 1(16/18OH)) at a final concentration of 4 mM. A second EPR tube was prepared in an analogous fashion with a final concentration of 2 mM. The EPR tubes were immediately flash frozen, and stored in a 77 K dewar. The 18O labeling incorporation was estimated by integration of the rR peak at 633 cm−1 compared to the integration of standard peaks at 395 cm−1 (ligand based) or 701 cm−1 (solvent based) (54–58% 18O).17
rR Preparation of NO2LCuIII–16OH (2) and PIPLCuIII–16OH (3)
rR samples were generated similar to the method described above for 1, and using previously reported conditions.3 10 and 20 mM samples of 3 were generated from [NBu4][3] using Fc(BArF4) in DFB. 5 and 10 mM samples of 2 were generated from [NEt4][2] using AcFc(BArF4) in DFB [AcFc = acetylferrocenium, BArF4 = B(3,5- (CF3)2C6H3)4−].
Theoretical Methods
Density functional theory (DFT) calculations were performed using the ORCA (v.3.0.2) program.18 Starting geometries for all copper-hydroxide complexes were based on the respective X-ray crystal structures. Copper(I and III)-hydroxides were optimized spin-restricted whereas copper(II)-hydroxides were optimized spin-unrestricted using the mPWPW functional with a TZVP basis set, the Resolution of identity (RI) approximation, TZV/J auxiliary basis set, and a large integration grid (Grid4).19–21 The mPWPW functional was chosen after a functional screen and was previously used to formulate an O–O Badger’s rule plot.9b Analytical frequency calculations on all complexes confirmed stable structures with no imaginary frequencies observed. A comparison of the Cu–O bond lengths for the DFT optimized structures with the crystal structures is shown in Table S2. To determine the Cu–O vibration, the generated Hessian file was rerun through the “orca_vib” program where the mass of oxygen was changed to 18 amu, as documented in the ORCA manual. The largest shift in energy was then assigned as the Cu–O stretching vibration, which was also confirmed upon visualization of the vibration.
Predicted resonance Raman (rR) spectra were produced by first running numerical frequency calculations with the Raman keyword (Polar 1) to calculate the polarizabilities using the aforementioned level of theory (mPWPW/TZVP). Time-dependent DFT (TD-DFT) calculations were performed switching to the BP86 functional22 because the mPWPW functional was not implemented for rR calculations. Also, the Tamm-Dancoff approximation23 was used with an energy window of ±3 hartree for 20 excited states. The generated file from this calculation was used as the input for the “orca_asa” program with the rR excitation energy set to the predicted λmax for the LMCT band.24
RESULTS
Resonance Raman Spectroscopy
Solution samples of the three complexes 1–3 were generated at −80 °C (for 1) or −25 °C (for 2 and 3) using established procedures, involving 1-electron oxidation of [LCuOH]− precursors.1–3 Thus, a solution of [NEt4][1] in CH2Cl2 (4 mM) was treated with FcPF6 and the resulting deep purple solution of 1 was flash frozen in liquid N2. Similarly, samples of 2 in 1,2-difluorobenzene (DFB) were prepared from [NEt4][2] and AcFc(BArF4), and samples of 3 in DFB were prepared from [NBu4][3] and Fc(BArF4).
Resonance Raman spectra were acquired using λex = 515 or 514.5 nm, close to the λmax values for the LMCT features for 1–3 at 513–563 nm (Figures S1–S3). For the case of 1, an 18O-isotope enriched sample (54–58%) was accessed by preparing [NEt4][1] from a sample of NEt4OH·5H2O that had been treated with excess H218O (see Experimental Section for details). The rR spectrum (Figure 2) for this 18O-enriched sample of 1 exhibited a peak at 607 cm−1 that was not present in the unlabeled sample, 26 cm−1 lower than a peak at 633 cm−1 that we therefore assign as ν(Cu–O) (Δ18O(calc) = 29 cm−1, force constant 302 N m−1 or 3.02 mdyn Å−1). Similar peaks at 628 cm−1 in the rR spectra for 2 and 3 were observed, and also assigned as ν(Cu–O), although isotopic labeling for these cases was not performed (Figures S2 and S3).
Figure 2.
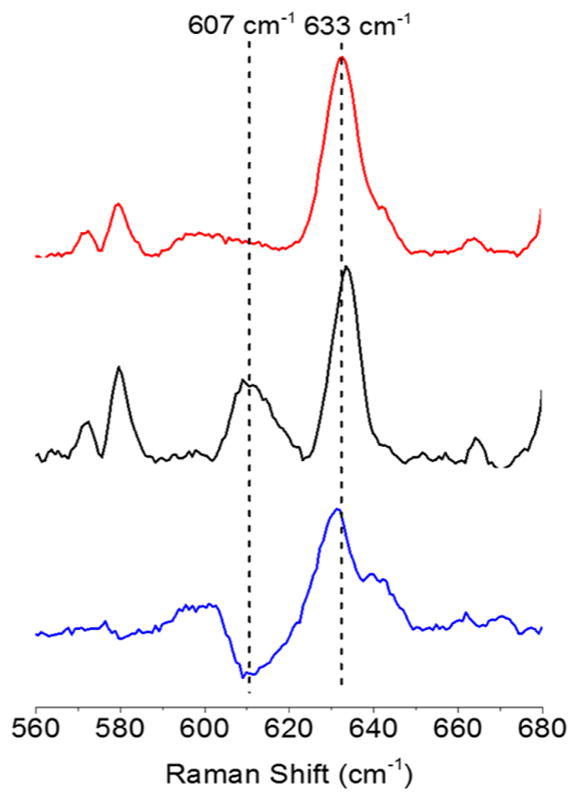
rR spectra of 1 (red, ν(Cu–O) = 633 cm−1), 18O-enriched 1 (black, ν(Cu–O) = 607 cm−1), and the difference spectrum (blue, 16O–18O), using λex = 515 nm, CH2Cl2 solutions at 77 K.
Corroboration of the assignments was obtained by DFT using numerical frequency calculations using mPWPW/TZVP. Calculated rR spectra match well with the experimental data (Figures S4–S6). Most importantly, using unscaled frequencies, the computed ν(Cu–O) values were 601 (1), 597 (2), and 591 (3) cm−1, which differ from the experimental values by only 31–35 cm−1. This good agreement between experiment and theory confirms the spectroscopic assignments.
X-ray Crystal Structure of [NBu4][LCuII–OH], [1]−
Because of compositional disorder with [LCuII–Cl]−, the initially reported crystal structure of [1]− had a longer than expected Cu–O bond length.1 To facilitate better comparison with the other two crystallographically characterized complexes, [2]− and [3]−,3 and accurately determine the change in Cu–O bond length upon oxidation from CuII to CuIII, we obtained a new crystal structure of [1]− by replacing the [PPN]+ cation (source of the chloride contamination) with [NBu4]+. The structure is similar overall to the original report (Table 1), except the Cu–O bond length is shortened from 1.9465(19) Å to 1.845(4) Å. This new structure has an average Cu–O/N(×4) bond length of 1.95 Å and compares favorably to both the EXAFS fit (1.95 Å) and previous DFT optimized structures.1,3
Table 1.
Structural Data for [1]−a
Normalized Badger’s Rule
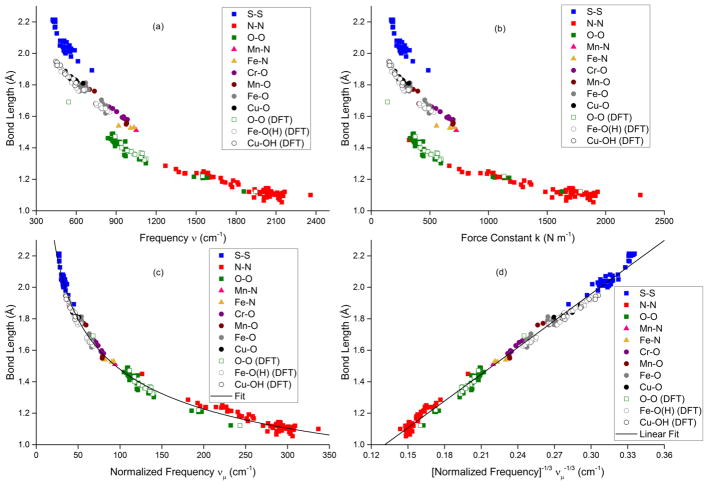
To relate the ν(Cu–O) determined by resonance Raman spectroscopy with the Cu–O bond length, we attempted to construct a Cu–OH Badger’s rule plot. However, we were unable to find any experimental Cu–OH bond lengths with corresponding isotopically labeled stretching frequencies, so we turned to computational studies. A series of six representative Cu–OH complexes were mined from the Cambridge Structural Database (CSD).26 The X-ray coordinates for these complexes, as well as those described in this work, were then geometrically optimized and analytical frequency calculations were performed (mPWPW/TZVP) (Tables S2 and S3). We combined this and other theoretical data (Table S4) with experimentally determined stretching frequencies (validated by isotope labeling) and either EXAFS or crystallographic bond length characterization for a variety of atomic pairs in a wide range of reported complexes to create a comprehensive (theory n = 61, experimental n = 194) bond length vs frequency plot (Figure 3a and Tables S4–S6 and references therein). We also show the data in a bond length vs force constant plot (Figure 3b). In both figures, three separate trend lines, or striations, appear, just as Badger observed for plots that include different atomic pairs.8
Figure 3.
(a) Bond length vs frequency. (b) Bond length vs force constant. (c) Bond length vs normalized frequency, νμ. (d) Bond length vs [normalized frequency]−1/3. Data set contains computational (n = 61) [designated by (DFT)] and experimental (n = 194) sources, see Tables S2–S6.
Reasoning that the striations in Figures 3a and 3b reflected a dependence of the empirical Cij value on the reduced mass associated with the vibrations, we hypothesized that simply normalizing the vibrational frequencies by the reduced mass (μ) of the atomic pair would correct for those striations. The resulting plot of normalized frequencies (νμ = ν/μ) is shown in Figure 3c, with a best fit shown using eq 1 (R2 value >0.99) that yields the generalized eq 4. In an alternate presentation, the normalized frequency was taken to the (−1/3) power to yield the linear plot in Figure 3d (eq 5, R2 > 0.99). Although there have been efforts to create a normalized Badger’s rule,15,27 our approach is unique in utilizing reduced mass normalization with confirmation from a large, disparate data set of both computational (n = 61) and experimental (n = 194) sources. The root mean squared errors (RMSE) in Figure 3c for the predicted bond lengths is 0.03 Å and for the predicted vibrational frequencies is 97 cm−1. The same RMSE for the bond lengths was also found using a statistical, 5-fold cross validation of the data (Supporting Information).28 Although alternative fits are equally viable (for example, Green’s equation14 [re = 12.1 νμ−2/3 + 0.88)] or power [re = 5.3 νμ−0.28] or logarithmic [re = 2.8–0.3 ln (νμ + 0.4)] fits), we prefer the simpler version (eqs 4 and 5) more closely related to the classical Badger’s rule. It is worth noting that substituting νμ = ν/μ, into eq 4 yields eq 6, which may be used to fit the striations in Figure 3a to different curves with variable average reduced mass (μ) values (Figure 4).
Figure 4.
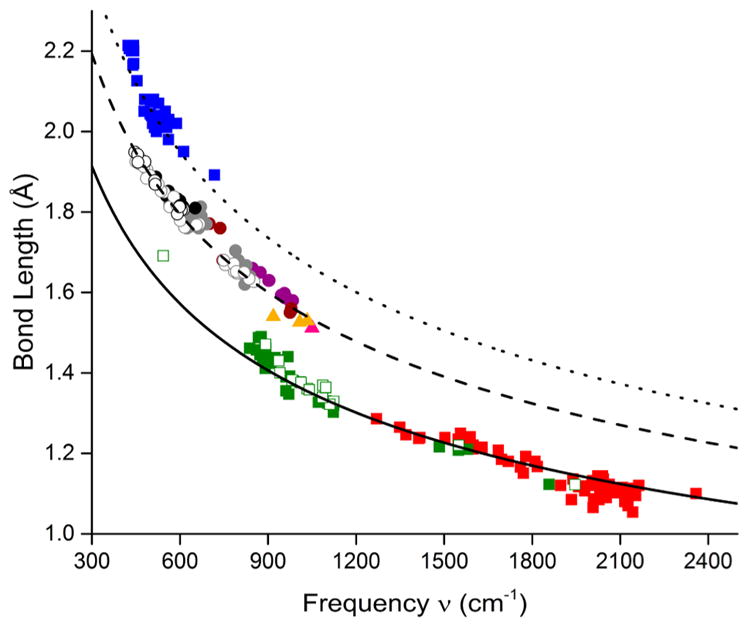
Bond length vs frequency (ν) plot (same as in Figure 3a) fit to eq 6 using different values of the average reduced mass (μ). The solid line has μ = 7.5, the average reduced mass of O–O and N–N; the dashed line has μ = 12, the average of all M–N/O (listed in Table S1); the dotted line has μ = 16, the value for S–S.
| (4) |
| (5) |
| (6) |
On the basis of the normalized Badger’s rule fit, we return to the key issue of CuIII–OH bond distances for 1–3. Given the experimentally determined ν(Cu–O) values from rR of 633 cm−1 (1) and 628 cm−1 (2 and 3), the CuIII–OH bond distances (computed from normalized Badger’s rule) are 1.80 Å (1) and 1.81 Å (2 and 3).
DISCUSSION
Determination of the Cu–OH Distance
By exciting into the intense absorption feature (λmax ~ 500–580 nm, ε ~ 10 to 15 000 M−1 cm−1) of the complexes 1–3, we observed a peak in the Raman spectrum at ~630 cm−1 that we assigned to the ν(Cu–O) on the basis of 18O isotope labeling (Δ18O = 26 cm−1). Resonance enhancement of this peak is consistent with the previous assignment of the absorption band as a ligand aryl π → Cu dx2−y2 charge transfer (LMCT) transition.1,3 The significant metal–ligand antibonding character of the acceptor molecular orbital (Figure 5) underlies the successful observation of the ν(Cu–O) feature in the Raman spectra. This is in contrast to the starting [CuII–OH]− complexes where the aforementioned chromophore is absent, which has precluded identification of the ν(Cu–O) stretch by resonance Raman spectroscopy so far.
Figure 5.
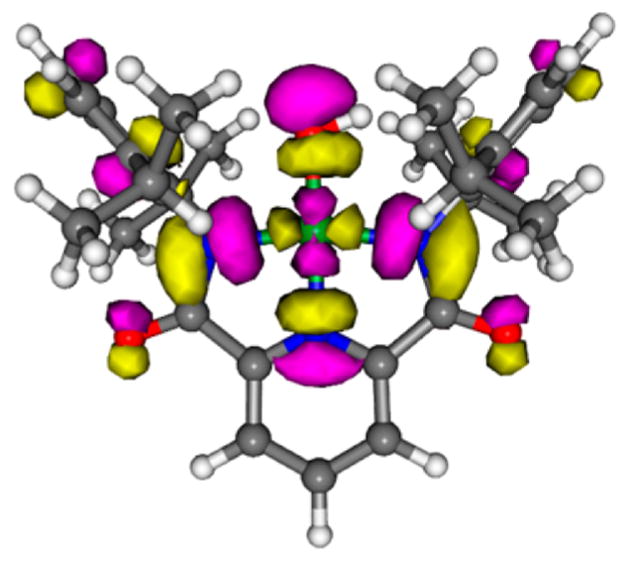
Kohn–Sham lowest unoccupied molecular orbital (LUMO) for 1 (PBE0/TZVP level of theory). Gray, white, blue, red, and green atoms represent C, H, N, O, and Cu, respectively; yellow = positive density, pink = negative density. Figure adapted with permission from ref 3. Copyright 2016 American Chemical Society.
We then used the normalized version of Badger’s rule (discussed in more detail later) to determine the CuIII–OH bond distances for the complexes from the ν(Cu–O) values. These distances are compared in Table 2 to the precursor CuII–OH distances determined via X-ray crystallography (XRD) and to DFT computed distances for both oxidation states.
Table 2.
Cu–O Bond Lengths in CuII– and CuIII–OH Complexes
| complex | XRD CuII–O (Å)a | predicted Badger’s CuIII–O (Å)b | ΔCu(II)–Cu(III) (Å)c | DFT predicted ΔCu(II)–Cu(III) (Å)d |
|---|---|---|---|---|
| 1 | 1.845(4) | 1.80 | 0.05 | 0.048 |
| 2 | 1.859(2) | 1.81 | 0.05 | 0.045 |
| 3 | 1.885(2)e | 1.81 | 0.08f | 0.102 |
| 1.891(2)e |
Determined from crystal structure, with estimated standard deviations indicated in parentheses.
Determined by Badger’s Rule (Figure 3c) from ν(Cu–O).
CuII–O distance (XRD) minus CuIII–O distance (predicted by Badger’s rule).
Two independent molecules in the asymmetric unit.
Using the average CuII–O value of the two independent molecules in the asymmetric unit.
The Cu–O distance determined by Badger’s rule for the CuIII complexes is shorter than that for the CuII precursors determined by XRD, consistent with the differences in metal oxidation states. The average difference (Δavg) is a modest 0.06 Å, in good agreement with that determined by DFT (Δavg = 0.065 Å).3 Interestingly, the computed Δavg for the Cu–N(×3) bonds is significantly larger (0.113 Å, Table 3), indicating a greater sensitivity of these bonds to metal oxidation state changes compared to the Cu–OH bond. Bond valence sum (BVS) analyses29 performed using either experimental data (XRD for CuII, EXAFS for CuIII) or DFT data further corroborated the metal oxidation state assignments, yielding BVS values of 2.0–2.2 and 2.8–3.1 for the CuII and CuIII complexes, respectively (Table 3).
Table 3.
Comparison of Experimental and Calculated Bond Lengths (in Å) for CuII–OH and CuIII–OH Complexesa
| complex | method | Cu–O | Cu–NPy | Cu–NAm1 | Cu–NAm2 | BVSb |
|---|---|---|---|---|---|---|
| [NBu4][1] | XRDc | 1.845(4) | 1.924(3) | 2.016(3) | 2.019(3) | 2.2 |
| EXAFSd | 1.95 [Cu–O/N avg.] | 2.2 | ||||
| DFTe | 1.868 | 1.95 | 2.089 | 2.081 | 2.0 | |
| 1 | EXAFSd | 1.86 [Cu–O/N avg.] | 3.1 | |||
| rR + EXAFSf | 1.80 | 1.88 [Cu–N avg.] | 3.1 | |||
| DFTe | 1.820 | 1.874 | 1.962 | 1.955 | 2.7 | |
| [NEt4][2] | XRDg | 1.8589(13) | 1.9359(13) | 1.9982(13) | 2.0053(13) | 2.2 |
| DFTe | 1.858 | 1.943 | 2.081 | 2.077 | 2.0 | |
| 2 | DFTe | 1.813 | 1.879 | 1.959 | 1.949 | 2.8 |
| [Na][3] | XRDh | 1.885(2) | 2.032(3) | 1.959(3) | 1.963(3) | 2.2 |
| 1.891(2) | 2.035(3) | 1.948(3) | 1.960(3) | 2.2 | ||
| DFTe | 1.879 | 2.091 | 2.028 | 2.005 | 2.0 | |
| 3 | DFTe | 1.795 | 1.944 | 1.909 | 1.901 | 2.9 |
Bond lengths (in Å). XRD structures have estimated standard deviations indicated in parentheses. Bond valence sums calculated using eq S1.
Parameters used to calculate BVS: B is 0.37 and R0 is 1.679 (CuII–O); 1.751 (CuII–N); 1.735 (CuIII–O); 1.768 (CuIII–N).29
This work.
From ref 1.
DFT optimized structures (PBE0/TZVP), from ref 3.
Cu–NAvg from EXAFS value (Cu–O/NAvg: 1.86 Å) with predicted Badger’s Cu–O distance removed from average.
From ref 3.
From ref 3 with two independent molecules in the asymmetric unit.
Normalized Badger’s Rule
Although standard Badger’s rule plots (Figure 3a,b) for wide-ranging experimental and theoretical data revealed trend lines associated with different atomic pairs, a simple normalization involving dividing the vibrational frequency by the reduced mass yielded a single curve (Figure 3c) or line (Figure 3d). The fits to these plots (eqs 4 and 5, respectively) are excellent (R2 > 0.999, RMSE = 0.03 Å), cover a large range of bond distances (~1.0–2.2 Å), and include many atomic pairs in a variety of compounds. With caveats as described below, eqs 4 and 5 appear to have general utility for predicting bond distances or vibrational frequencies for a plethora of atomic pairs in synthetic complexes, protein active sites, and materials. This method is a variation of a related normalization using effective bond length instead of normalized frequency that was used to generate a limited C–X (X = C, N, O, F) Badger’s rule.15 A principal limitation of Badger’s rule in any form is that the stretching frequency must be localized to the bond between the two atoms, such that Hooke’s law (eq 2) applies. Special attention should thus be paid to complex stretching vibrations that seem to follow the normalized Badger’s rule fitting lines in Figure 3c,d. For example, it is intriguing that many of the experimental data points feature M–O bonds where the oxygen moiety is part of an oxo, hydroxo, alkoxo, superoxo, or peroxo ligand, or a bis(μ-oxo)dimetal core. For some of these, the agreement can be ascribed to relatively insignificant coupling of the M–O vibration to other (e.g., O–O) vibrations, but this cannot be the case for most of the bis(μ-oxo)dimetal complexes that have been shown to exhibit complex core “breathing” and related vibrational modes.30 It would thus appear fortuitous that for the case of M = Cu, the observed 18O-sensitive symmetric core stretches correlate well using the normalized frequency calculated from the simple Cu–O reduced mass (a similar observation was made for a trans-dioxoMnV system).13 For the related (μ-oxo)dimetal complexes (M = Fe), symmetric and asymmetric core stretches have been identified,31 and computing the normalized frequency from either using the Fe–O reduced mass yields inaccurate bond distances. However, taking the average of the symmetric and asymmetric stretches and then normalizing by reduced mass (Fe–O) shows excellent agreement with the fit line (Figure 6). All cores described above were included in the plots shown in Figure 3.
Figure 6.
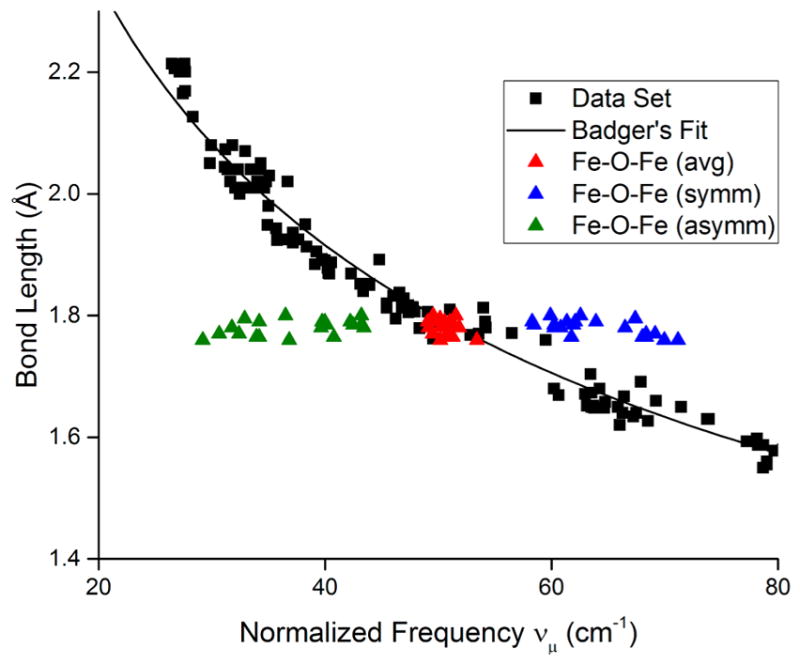
Selected portion of Badger’s rule data with fit line (black points and line, from Figure 3c) with data for (μ-oxo)diiron complexes31 shown using the normalized symmetric (blue), asymmetric (green), or the average of the symmetric and asymmetric stretching frequencies (red).
Also, the fit line in Figure 3c was applied to Mo–O32 and Nb–O33 Badger’s rule correlations, but the RMSE’s were high (0.07 and 0.09 Å, respectively). As these correlations were derived from solid lattice frameworks, it is possible that crystal packing forces and/or coupling of simple vibrational modes are responsible for the discrepancies. The Cu–S12 systems also fit poorly (RMSE = 0.26 Å), but these data were derived from protein studies where S was part of the amino acid methionine, such that the Cu–S vibration is coupled to motion of the entire amino acid side chain. Finally, we also note that an analysis of a diverse set of 358 data points of diatomic molecules in the gas phase with representation from 70 atoms within the periodic table34–36 showed more complicated trends than the simple eqs 4 and 5, for reasons that are unclear at present (Supporting Information, Figure S7). Subsequently, none of these examples were included in the plots shown in Figure 3.
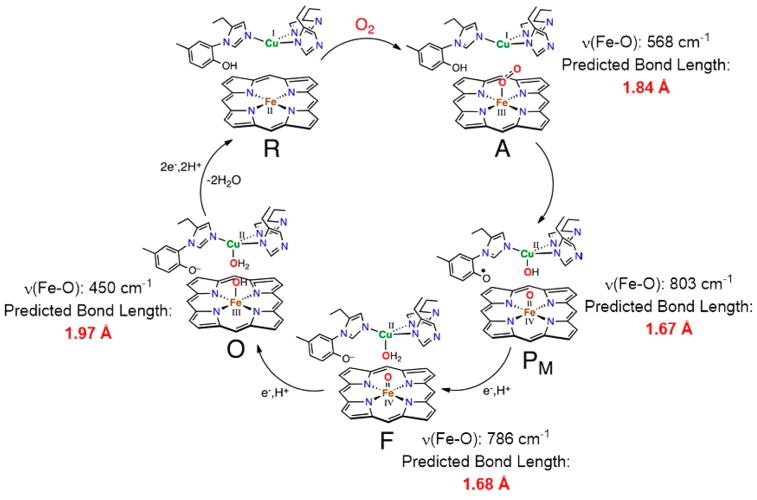
Notwithstanding this result for diatomics in the gas phase and the aforementioned caveats, the relationship shown in Figure 3c,d (eqs 4 and 5) appears to be broadly useful, with potential applications for making predictions for a variety of complex molecules, metalloprotein active sites, and metal-containing motifs in solids for which structural information is not available. For example, several key intermediates in the catalytic cycle of cytochrome c oxidase (CcO) have been characterized by rR spectroscopy but no corresponding structural information is available (Figure 7). Using the experimentally determined ν(Fe–O) values, we used eq 4 to predict the Fe–O bond distances shown. Note that Green’s Badger’s rule also predicts similar bond lengths within 0.02 Å.14
Figure 7.
Cytochrome c oxidase postulated intermediates with experimental resonance Raman ν(Fe–O) with the bond lengths predicted from Badger’s rule. Resonance Raman data for intermediates A, F, and O: ref 37; PM: ref 38. Figure adapted with permission from ref 39. Copyright 2010 American Chemical Society.
Another application concerns the Cu–O distance in the catalytic site in Cu-ZSM-5.40 This material is capable of the selective oxidation of methane to methanol using what has been proposed to be a (μ-oxo)dicopper(II) site on the basis of resonance Raman spectroscopy and DFT calculations. Because of the presence of multiple copper atoms in the zeolite and the active site only accounting for ~5% of those copper atoms, EXAFS is not a viable technique for identifying the structural features of the Cu–O core. Using the average of the measured ν(Cu–O) of 870 cm−1 (asymm.) and 456 cm−1 (symm.), we predict a Cu–O bond distance of 1.74 Å, within 0.04 Å of the DFT predicted model and consistent with the proposed (μ-oxo)dicopper formulation.
Another example, soluble methane monooxygenase (sMMO), is also able to convert methane into methanol and is proposed to do so via a Fe2(μ-O)2 diamond core structure (intermediate “Q”).41 Recent resonance Raman data for Q revealed a ν(Fe–O) of 690 cm−1, which leads to a predicted Fe–O bond distance of 1.75 Å that matches well with the EXAFS distance of 1.77 Å.42 Comparison of Q to a synthetic model complex with the Fe2(μ-O)2 diamond core also shows good agreement in stretching frequency (ν(Fe–O) is 674 cm−1) and EXAFS bond length (1.78 Å), with a predicted bond length of 1.76 Å.43
CONCLUSION
We have successfully determined the ν(Cu–O) of the [CuOH]2+ core in complexes 1–3 through resonance Raman spectroscopy to be 633 cm−1 (1) or 628 cm−1 (2 and 3), with verification by 18O isotope labeling (for 1, (Δ18O(exp) = 26 cm−1, Δ18O(calc) = 29 cm−1). A simple modification of Badger’s rule revealed a correlation of bond distance with normalized stretching frequency for a large data set (n > 250) of distances and frequencies from theory and experiment (Figure 3c,d), with an excellent fit to eq 4 or its linearized form, eq 5. Using this general relationship, the Cu–O bond distances in 1–3 were estimated to be 1.80 Å (1) or 1.81 Å (2 and 3). Although some caveats to application of the modified Badger’s rule apply, such as when considering vibrations that are not simply described by Hooke’s law (i.e., are not localized) or in simple diatomics in the gas phase, we postulate it is nonetheless generally useful for estimating structural data from vibrational frequencies (or vice versa) for a wide variety of diatomic units in synthetic molecules, metalloprotein active sites, and materials. The few predictions we have made using this relationship are illustrative, and we envision further use across many areas of chemistry.
Supplementary Material
Acknowledgments
We thank the National Institutes of Health (R37GM47365 to W.B.T.) for financial support of this research. The authors thank Benjamin D. Neisen and Dr. Victor G. Young, Jr. for assistance with X-ray crystallography and Dr. Patrick L. Holland for sharing O–O and N–N Badger’s rule data. This work was carried out in part using computing resources at the University of Minnesota Supercomputing Institute.
Footnotes
Notes
The authors declare no competing financial interest.
The Supporting Information is available free of charge on the ACS Publications website at DOI:10.1021/jacs.7b00210.
X-ray crystallographic data (CIF)
Raman spectra, data analysis methods, tables of data, plots of data for diatomics in the gas phase, and coordinates for structures optimized by DFT (PDF)
References
- 1.Donoghue PJ, Tehranchi J, Cramer CJ, Sarangi R, Solomon EI, Tolman WB. J Am Chem Soc. 2011;133:17602–17605. doi: 10.1021/ja207882h. [DOI] [PMC free article] [PubMed] [Google Scholar]
- 2.Dhar D, Tolman WB. J Am Chem Soc. 2015;137:1322–1329. doi: 10.1021/ja512014z. [DOI] [PMC free article] [PubMed] [Google Scholar]
- 3.Dhar D, Yee GM, Spaeth AD, Boyce DW, Zhang H, Dereli B, Cramer CJ, Tolman WB. J Am Chem Soc. 2016;138:356–368. doi: 10.1021/jacs.5b10985. [DOI] [PMC free article] [PubMed] [Google Scholar]
- 4.Gagnon N, Tolman WB. Acc Chem Res. 2015;48:2126–2131. doi: 10.1021/acs.accounts.5b00169. [DOI] [PMC free article] [PubMed] [Google Scholar]
- 5.(a) Mirica LM, Ottenwaelder X, Stack TDP. Chem Rev. 2004;104:1013–1045. doi: 10.1021/cr020632z. [DOI] [PubMed] [Google Scholar]; (b) Lewis EA, Tolman WB. Chem Rev. 2004;104:1047–1076. doi: 10.1021/cr020633r. [DOI] [PubMed] [Google Scholar]; (c) Elwell CE, Gagnon NL, Neisen BD, Dhar D, Spaeth AD, Yee GM, Tolman WB. Chem Rev. 2017;117:2059–2107. doi: 10.1021/acs.chemrev.6b00636. [DOI] [PMC free article] [PubMed] [Google Scholar]; (d) Karlin KD, Itoh S, Rokita S, editors. Wiley Series of Reactive Intermediates in Chemistry and Biology. Vol. 4 John Wiley & Sons, Inc; Hoboken, NJ: 2011. [Google Scholar]; (e) Haack P, Limberg C. Angew Chem, Int Ed. 2014;53:4282–4293. doi: 10.1002/anie.201309505. [DOI] [PubMed] [Google Scholar]
- 6.Selected recent reports on the possibility of [CuOH]2+ as a reactive intermediate: Frandsen KEH, Simmons TJ, Dupree P, Poulsen J-CN, Hemsworth GR, Ciano L, Johnston EM, Tovborg M, Johansen KS, von Freiesleben P, Marmuse L, Fort S, Cottaz S, Driguez H, Henrissat B, Lenfant N, Tuna F, Baldansuren A, Davies GJ, Lo Leggio L, Walton PH. Nat Chem Biol. 2016;12:298–303. doi: 10.1038/nchembio.2029.Yamada M, Karlin KD, Fukuzumi S. Chem Sci. 2016;7:2856–2863. doi: 10.1039/c5sc04312c.
- 7.Illustrative reports of [CuO]+ in the gas phase: Schröder D, Holthausen MC, Schwarz H. J Phys Chem B. 2004;108:14407–14416.Dietl N, van der Linde C, Schlangen M, Beyer MK, Schwarz H. Angew Chem, Int Ed. 2011;50:4966–4969. doi: 10.1002/anie.201100606.Dietl N, Schlangen M, Schwarz H. Angew Chem, Int Ed. 2012;51:5544–5555. doi: 10.1002/anie.201108363.Schwarz H. Chem Phys Lett. 2015;629:91–101.
- 8.(a) Badger RM. J Chem Phys. 1934;2:128–131. [Google Scholar]; (b) Badger RM. J Chem Phys. 1935;3:710–714. [Google Scholar]
- 9.(a) Cramer CJ, Tolman WB, Theopold KH, Rheingold AL. Proc Natl Acad Sci U S A. 2003;100:3635–3640. doi: 10.1073/pnas.0535926100. [DOI] [PMC free article] [PubMed] [Google Scholar]; (b) Cramer CJ, Tolman WB. Acc Chem Res. 2007;40:601–608. doi: 10.1021/ar700008c. [DOI] [PMC free article] [PubMed] [Google Scholar]
- 10.Holland PL. Dalton Trans. 2010;39:5415–5425. doi: 10.1039/c001397h. [DOI] [PMC free article] [PubMed] [Google Scholar]
- 11.Brown EC, Bar-Nahum I, York JT, Aboelella NW, Tolman WB. Inorg Chem. 2007;46:486–496. doi: 10.1021/ic061589r. [DOI] [PMC free article] [PubMed] [Google Scholar]
- 12.Blair DF, Campbell GW, Cho WK, English AM, Fry HA, Lum V, Norton KA, Schoonover JR, Chan SI. J Am Chem Soc. 1985;107:5755–5766. [Google Scholar]
- 13.Jin N, Ibrahim M, Spiro TG, Groves JT. J Am Chem Soc. 2007;129:12416–12417. doi: 10.1021/ja0761737. [DOI] [PMC free article] [PubMed] [Google Scholar]
- 14.Green MT. J Am Chem Soc. 2006;128:1902–1906. doi: 10.1021/ja054074s. [DOI] [PubMed] [Google Scholar]
- 15.Other variations of Badger’s rule have been summarized: Kraka E, Larsson JA, Cremer D. Computational Spectroscopy. Wiley-VCH Verlag GmbH & Co. KGaA; Weinheim, Germany: 2010. pp. 105–149.
- 16.Harris DC, Bertolucci MD. Symmetry and Spectroscopy: An Introduction to Vibrational and Electronic Spectroscopy. Dover Publications; New York, NY: 1989. pp. 93–224. [Google Scholar]
- 17.Draksharapu A, Codolà Z, Gómez L, Lloret-Fillol J, Browne WR, Costas M. Inorg Chem. 2015;54:10656–10666. doi: 10.1021/acs.inorgchem.5b01463. [DOI] [PubMed] [Google Scholar]
- 18.Neese F. Wiley Interdiscip Rev Comput Mol Sci. 2012;2:73–78. [Google Scholar]
- 19.(a) Perdew JP, Wang Y. Phys Rev B: Condens Matter Mater Phys. 1992;45:13244–13249. doi: 10.1103/physrevb.45.13244. [DOI] [PubMed] [Google Scholar]; (b) Burke K, Perdew JP, Wang Y. In: Electronic Density Functional Theory: Recent Progress and New Directions. Dobson JF, Vignale G, Das MP, editors. Springer US; Plenum, NY: 1998. pp. 81–111. [Google Scholar]; (c) Adamo C, Barone V. J Chem Phys. 1998;108:664–675. [Google Scholar]
- 20.Schafer A, Horn H, Ahlrichs R. J Chem Phys. 1992;97:2571–2577. [Google Scholar]
- 21.Neese F. J Comput Chem. 2003;24:1740–1747. doi: 10.1002/jcc.10318. [DOI] [PubMed] [Google Scholar]
- 22.(a) Becke AD. J Chem Phys. 1986;84:4524–4529. [Google Scholar]; (b) Perdew JP. Phys Rev B: Condens Matter Mater Phys. 1986;33:8822–8824. doi: 10.1103/physrevb.33.8822. [DOI] [PubMed] [Google Scholar]
- 23.(a) Hirata S, Head-Gordon M. Chem Phys Lett. 1999;302:375–382. [Google Scholar]; (b) Hirata S, Head-Gordon M. Chem Phys Lett. 1999;314:291–299. [Google Scholar]
- 24.Petrenko T, Neese F. J Chem Phys. 2007;127:164319. doi: 10.1063/1.2770706. [DOI] [PubMed] [Google Scholar]
- 25.Yang L, Powell DR, Houser RP. Dalton Trans. 2007:955–964. doi: 10.1039/b617136b. [DOI] [PubMed] [Google Scholar]
- 26.(a) Fortman GC, Slawin AMZ, Nolan SP. Organometallics. 2010;29:3966–3972. [Google Scholar]; (b) Harata M, Hasegawa K, Jitsukawa K, Masuda H, Einaga H. Bull Chem Soc Jpn. 1998;71:1031–1038. [Google Scholar]; (c) Lee SC, Holm RH. J Am Chem Soc. 1993;115:11789–11798. [Google Scholar]; (d) Jitsukawa K, Harata M, Arii H, Sakurai H, Masuda H. Inorg Chim Acta. 2001;324:108–116. [Google Scholar]; (e) Tubbs KJ, Fuller AL, Bennett B, Arif AM, Berreau LM. Inorg Chem. 2003;42:4790–4791. doi: 10.1021/ic034661j. [DOI] [PubMed] [Google Scholar]; (f) Berreau LM, Mahapatra S, Halfen JA, Young VG, Tolman WB. Inorg Chem. 1996;35:6339–6342. [Google Scholar]; (g) Groom CR, Bruno IJ, Lightfoot MP, Ward SC. Acta Crystallogr, Sect B: Struct Sci, Cryst Eng Mater. 2016;72:171–179. doi: 10.1107/S2052520616003954. [DOI] [PMC free article] [PubMed] [Google Scholar]
- 27.Lippincott ER, Schroeder RI. J Chem Phys. 1955;23:1131–1141. [Google Scholar]
- 28.McLachlan GJ, Do K-A, Ambroise C. Analyzing Microarray Gene Expression Data. John Wiley & Sons, Inc; Hoboken, NJ: 2005. pp. 185–220. [Google Scholar]
- 29.(a) Brown ID, Altermatt D. Acta Crystallogr, Sect B: Struct Sci. 1985;41:244–247. [Google Scholar]; (b) Liu W, Thorp HH. Inorg Chem. 1993;32:4102–4105. [Google Scholar]; (c) Shields GP, Raithby PR, Allen FH, Motherwell WDS. Acta Crystallogr, Sect B: Struct Sci. 2000;56:455–465. doi: 10.1107/s0108768199015086. [DOI] [PubMed] [Google Scholar]; (d) Mahapatra S, Halfen JA, Wilkinson EC, Pan G, Wang X, Young VG, Cramer CJ, Que L, Jr, Tolman WB. J Am Chem Soc. 1996;118:11555–11574. [Google Scholar]
- 30.(a) Holland PL, Cramer CJ, Wilkinson EC, Mahapatra S, Rodgers KR, Itoh S, Taki M, Fukuzumi S, Que L, Tolman WB. J Am Chem Soc. 2000;122:792–802. [Google Scholar]; (b) Henson MJ, Mukherjee P, Root DE, Stack TDP, Solomon EI. J Am Chem Soc. 1999;121:10332–10345. [Google Scholar]
- 31.(a) Sanders-Loehr J, Wheeler WD, Shiemke AK, Averill BA, Loehr TM. J Am Chem Soc. 1989;111:8084–8093. [Google Scholar]; (b) Zheng H, Zang Y, Dong Y, Young VG, Que L., Jr J Am Chem Soc. 1999;121:2226–2235. [Google Scholar]
- 32.Hardcastle FD, Wachs IE. J Raman Spectrosc. 1990;21:683–691. [Google Scholar]
- 33.Hardcastle FD, Wachs IE. Solid State Ionics. 1991;45:201–213. [Google Scholar]
- 34.Huber KP, Herzberg G. Molecular Spectra and Molecular Structure: IV Constants of Diatomic Molecules. Springer US; Boston, MA: 1979. [Google Scholar]
- 35.Jules JL, Lombardi JR. J Phys Chem A. 2003;107:1268–1273. [Google Scholar]
- 36.Baudhuin MA. PhD Dissertation. University of Minnesota; Twin Cities: 2016. A Study of Gas Phase Heterobimetallic and Organometallic Complexes by Anion Photoelectron Spectroscopy. [Google Scholar]
- 37.Han SW, Ching YC, Rousseau DL. Proc Natl Acad Sci U S A. 1990;87:2491–2495. doi: 10.1073/pnas.87.7.2491. [DOI] [PMC free article] [PubMed] [Google Scholar]
- 38.Ogura T, Kitagawa T. Biochim Biophys Acta, Bioenerg. 2004;1655:290–297. doi: 10.1016/j.bbabio.2003.10.013. [DOI] [PubMed] [Google Scholar]
- 39.Solomon EI, Heppner DE, Johnston EM, Ginsbach JW, Cirera J, Qayyum M, Kieber-Emmons MT, Kjaergaard CH, Hadt RG, Tian L. Chem Rev. 2014;114:3659–3853. doi: 10.1021/cr400327t. [DOI] [PMC free article] [PubMed] [Google Scholar]
- 40.(a) Woertink JS, Smeets PJ, Groothaert MH, Vance MA, Sels BF, Schoonheydt RA, Solomon EI. Proc Natl Acad Sci U S A. 2009;106:18908–18913. doi: 10.1073/pnas.0910461106. [DOI] [PMC free article] [PubMed] [Google Scholar]; (b) Vanelderen P, Vancauwenbergh J, Sels BF, Schoonheydt RA. Coord Chem Rev. 2013;257:483–494. [Google Scholar]; (c) Vanelderen P, Snyder BER, Tsai ML, Hadt RG, Vancauwenbergh J, Coussens O, Schoonheydt RA, Sels BF, Solomon EI. J Am Chem Soc. 2015;137:6383–6392. doi: 10.1021/jacs.5b02817. [DOI] [PubMed] [Google Scholar]
- 41.Banerjee R, Proshlyakov Y, Lipscomb JD, Proshlyakov DA. Nature. 2015;518:431–434. doi: 10.1038/nature14160. [DOI] [PMC free article] [PubMed] [Google Scholar]
- 42.Shu L, Nesheim JC, Kauffmann K, Münck E, Lipscomb JD, Que L., Jr Science. 1997;275:515–518. doi: 10.1126/science.275.5299.515. [DOI] [PubMed] [Google Scholar]
- 43.Xue G, Wang D, De Hont R, Fiedler AT, Shan X, Münck E, Que L., Jr Proc Natl Acad Sci U S A. 2007;104:20713–20718. doi: 10.1073/pnas.0708516105. [DOI] [PMC free article] [PubMed] [Google Scholar]
Associated Data
This section collects any data citations, data availability statements, or supplementary materials included in this article.


