
Fig. 3.
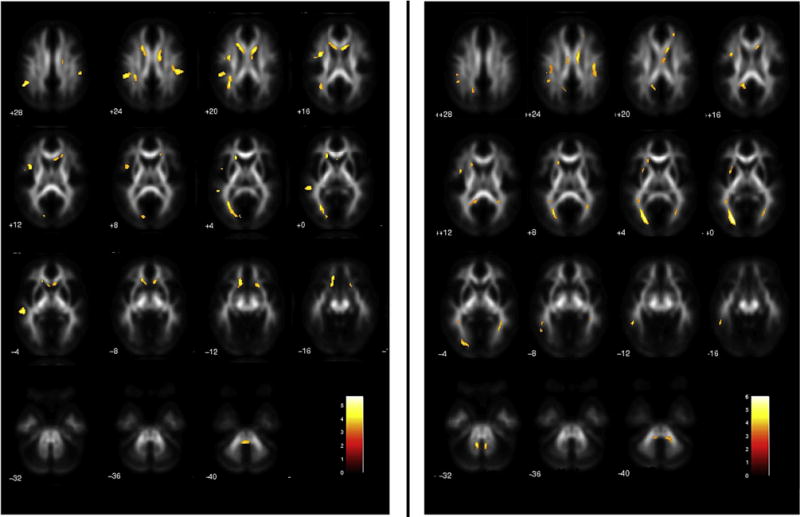
Statistical parametric maps of decreased FA in DYS + versus NR− (left panel), and in DYS − versus NR− (right panel). Threshold: p < .05 FDR corrected at the voxel level (k > 100 voxels).
Official websites use .gov
A
.gov website belongs to an official
government organization in the United States.
Secure .gov websites use HTTPS
A lock (
) or https:// means you've safely
connected to the .gov website. Share sensitive
information only on official, secure websites.
Statistical parametric maps of decreased FA in DYS + versus NR− (left panel), and in DYS − versus NR− (right panel). Threshold: p < .05 FDR corrected at the voxel level (k > 100 voxels).