Abstract
Only limited research has examined the development and application of visible light responsive photocatalytic oxidation (PCO), although such materials have great potential for mitigating concentrations of volatile organic compounds (VOCs) when applied to building surfaces. This study evaluates the performance and characteristics of a visible light responsive photocatalyst, specially, a co-alloyed TiNbON compound with a band energy of 2.3 eV. The PCO material was developed using urea-glass synthesis, characterized by scanning electron microscopy (SEM), diffuse reflectance spectra (DRS), powder X-ray diffraction (PXRD), and Brunauer-Emmett-Teller (BET) methods, and VOC removal efficiency was measured under visible light for toluene (1–5 ppm) at room temperature (21.5°C) and a range of relative humidity (RH: 25 to 65%), flow rate (0.78 to 7.84 cm/s), and irradiance (42 to 95 W/m2). A systematic parametric evaluation of kinetic parameters was conducted. In addition, we compared TiNbON with a commercial TiO2-based material under black light, estimated TiNbON’s long-term durability and stability, and tested its ability to thermally regenerate. Using mass transfer and kinetic analysis, three different Langmuir-Hinshelwood (LH) type reaction rate expressions were proposed and evaluated. A LH model considering one active site and competitive sorption of toluene and water was superior to others. The visible-light driven catalyst was able to remove up to 58 % of the toluene, generated less formaldehyde than the commercial TiO2, could be fully regenerated at 150°C, and had reasonable durability and stability. This evaluation of TiNbON shows the potential to remove VOCs and improve air quality for indoor applications. Further research is needed to evaluate the potential for harmful by-products, to identify optimal conditions, and to use field tests to show real-world performance.
Keywords: Photocatalytic oxidation (PCO), volatile organic compounds (VOCs), indoor air quality (IAQ), visible light, formaldehyde
Graphical Abstract
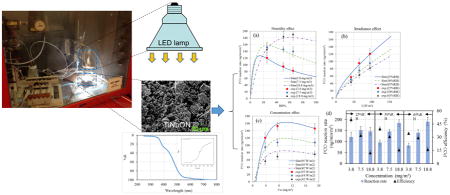
1. Introduction
Indoor and outdoor air pollution represents a challenging public health issue that is receiving increasing attention in both developed and developing countries. Poor air quality in China and India, for example, reduces average life expectancy by an estimated two years, and globally, air pollution is considered to be the fourth-largest environmental threat to human health [1]. Volatile organic compounds (VOCs), which are precursors to ozone (O3) and particulate matter (PM), play a critical role in air quality. VOCs are emitted from motor vehicles, chemical manufacturing facilities, refineries, factories, consumer and commercial products, biogenic sources, among numerous other sources [2–7]. Pollutants in outdoor air also affect indoor air quality (IAQ). While filtration and air cleaning in a building’s heating, ventilating and air conditioning (HVAC) system can improve IAQ, filters installed in typical HVAC systems control only PM and do not remove VOCs [8]. Gas phase filtration of VOCs is expensive and applications have been limited [9]. Moreover, many buildings do not utilize mechanical HVAC systems and thus have limited opportunities for filter-based air cleaning systems. These challenges have motivated the development of innovative technologies that can control gaseous pollutants and improve IAQ.
Photocatalytic oxidation (PCO) technology is an emerging advanced technology that promises offers new and cost-effective opportunities for improving IAQ. PCO materials can be applied on indoor surfaces, including walls, windows, floors and ceilings, and potentially can utilize visible light provided by room lighting and sunlight to oxidize VOCs. These materials could represent a sustainable or “green” approach if effective visible-light driven catalysts can be developed. While some PCO-based technologies have been evaluated [10–19], research addressing the development and evaluation of visible light driven PCO materials is limited [20–23]. It is known, however, that materials such as TiO2 can be co-alloyed with niobium (Nb) and oxynitrites to significantly reduce adsorption energy down to 2.0 eV, which enables visible light activation [24–26]. Most evaluations have focused on NOx (NO, NO2) removal using UV lights for outdoor applications [27–32]. Several studies have evaluated VOC removal (e.g., ethanol, heptane, decane, benzene, toluene, p-xylene, and acetone) at relatively high concentrations, e.g., tens to hundreds of ppm [33–38], but these levels are well above those usually encountered outside relatively few industrial environments. Other studies have evaluated VOC removal using heated PCO reactors [39, 40], which are not suitable for indoor applications and which have other cost and environmental issues, and to date, field studies of commercial PCO-based products have not demonstrated VOC removal [41, 42]. Hence, the development of reliable and efficient PCO materials for remains a research priority.
An important concern with PCO as well as other VOC removal and treatment technologies is the formation of hazardous by-products [43]. For example, degradation of benzene by O3-assisted PCO has been shown to form octane, decane, nonane, decanal, and decanoic acid (all in gas-phase), as well as (solid phase) p-benzoquinone [43]. PCO degradation of toluene formed benzene, and degradation of p-xylene produced both benzene and toluene [38]. Under simulated solar irradiation, TiO2-based paints exposed to n-decane formed C6–C11 alkanes, 4-methylnonane, 2,6-dimethyloctane, butanoic acid, propanoic acid and butanal [44]. Formaldehyde was the major by-product in several PCO studies [18, 45–48]; this compound is of special concern as it is a potent human carcinogen. Another concern is that PCO materials tested at low VOC concentrations (e.g., ppm levels) can produce byproduct levels too low for quantification by many gas chromatography (GC) methods [49]. Because PCO mechanisms are complex and experimental conditions in the literature vary considerably, it is difficult to compare by-product formation.
The stability and durability of PCO coatings on building substrates is another key issue. PCO materials must be long-lived for practical applications, and thus materials must both resist abrasion and maintain chemical activity. While considerable effort has been devoted to improving photocatalytic activity, few studies have examined PCO stability on surfaces [12]. Accelerated weathering (mostly rain rinsing) and aging tests have been conducted for TiO2-coated materials [50–53], however, such tests are designed for outdoor applications. Tests of abrasion resistance for TiO2-based building materials in indoor applications have remained scarcely explored.
The objective of this paper is to evaluate the performance of a new PCO material that could be applied to building surfaces to improve air quality. We characterize this material, present the design of a system intended to evaluate PCO performance, show results pertaining to toluene removal using visible light-driven TiO2-based films, and evaluate the formation of formaldehyde and other byproducts using sensitive GC-MS methods. In addition, we examine long-term durability and physical stability of the coatings using a simple but novel peeling-off test, applied for the first time (to our knowledge) to evaluate resistance to mechanical abrasion. Lastly, we fit the experimental data using mass transfer and kinetic models, which also help to explain and extend results.
2. Experimental
2.1 Materials and chemicals
A new TiNbON catalyst was prepared by co-alloying TiO2 with Nb and oxynitrites using urea-glass synthesis in which TiCl4 reacted with NbCl5 and urea in an ethanol solution. The urea-glass reaction was modified using an additional oxidation step to prepare the active catalyst (details pending publication elsewhere). As a reference PCO material, we used Aeroxide P25 TiO2 (80% anatase, 20% rutile, BET area= 47.39 m2/g, Evonik Degussa GmbH, Essen, Germany). Aluminum plates (85 mm × 105 mm × 0.2 mm) were used as substrates; plates were cleaned to remove potential surface impurities using acetone followed by methanol rinses. The test gas used to evaluate PCO removals was prepared in filtered air (see below) using reagent grade toluene (99.9%, Sigma-Aldrich, St. Louis, USA).
2.2 Film preparation using the doctor-blade technique
To prepare the reference PCO material, 500 mg of P25 TiO2 was added to a plastic cup, along with zirconia mixing balls and 2.7 mL n-methyl pyrrolidone (NMP). NMP was selected as a solvent (rather than water or polymer additions) based on preliminary tests of PCO performance and its (see Supplemental Figures S1 and S2). The cup was placed in a planetary mixer (Thinky Mixer AR-100, Laguna Hills, USA) and mixed for 10 min to create a homogeneous and stable suspension. Then, 0.8 mL of the suspension was spread onto one of the substrates using the doctor blade technique, then the substrate was placed in a drying oven at 160 °C for 30 min to evaporate the NMP. A total of 20 substrate plates was similarly prepared and used for these tests. These substrates, denoted as P25N, had a catalyst loading of 0.5 ± 0.03 mg/cm2, determined as the mass difference before and after coating divided by the area coated. The same approach was used to prepare 40 substrates, each using 500 mg of TiNbON; these plates had a loading of 1.2 ± 0.5 mg/cm2.
2.3 Catalyst characterization
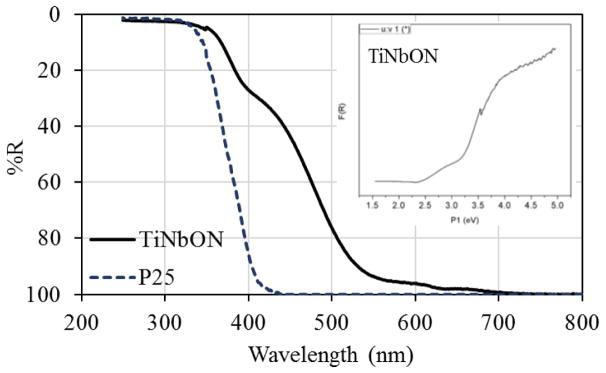
The catalyst surface structure and particle sizes were characterized by scanning electron microscopy (SEM; Physical Electronics Auger Nanoprobe 680, Physical Electronics, Inc., Eden Prairie, USA) using a 10 kV beam voltage and 10 nA beam current. Nitrogen sorption isotherms were measured at 77.3 K using a Quantachrome NOVA 4200 analyzer (Quantachrome Instruments, Boynton Beach, USA) and the Brunauer-Emmett-Teller (BET) method to calculate the specific surface area. Diffuse reflectance spectra (DRS) were collected on a UV-Vis-NIR spectrophotometer (Cary 5000, Agilent Technologies, Santa Clara, USA) using a Harrick Praying Mantis diffuse reflectance accessory and BaSO4 as a 100% reflectance standard. Reflectance data were modified for presentation in Tauc plots (Figure 3, inset) by the indirect Kubelka-Munk function. The crystallite structure of TiNbON was examined using powder X-ray diffraction and Cu Kα radiation (PXRD, D8 Advance, Bruker, Daltonics Inc., Billerica, USA).
Figure 3.
Diffuse re ectance spectra of TiNbON and P25 catalysts.
2.4 PCO test reactor setup
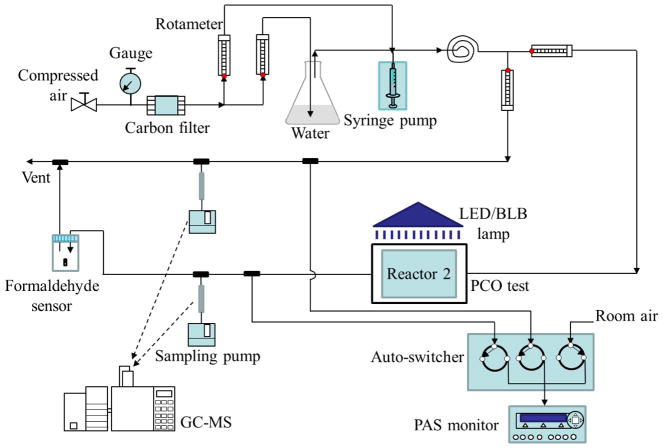
A schematic diagram of the experimental set-up is shown in Fig. 1. The total air flow (5–8 L/min) of VOC-free air at 25, 50 or 65% relative humidity (RH), which spans the RH comfort range [54], was prepared by blending carbon-filtered dry and water saturated (using bubblers) flows at appropriate ratios as controlled by calibrated rotameters (DryCal flow meter, Brandt Instruments, USA). VOC concentrations in the range of 1 to 5 ppm were generated by injecting neat toluene into the air flow at a constant rate of 1.4 to 10.5 μL/h (depending on the concentration and air flow) using a 25 μL syringe and a syringe pump with accuracy of ±0.5% and reproducibility of ±0.1% (Model 74900, Cole Parmer Instrument, Vernon Hills, USA). Tubing, fittings and most other materials in contact with the toluene flow were Teflon and primarily stainless steel.
Figure 1.
Schematic diagram of the PCO system. Only 1 reactor is shown.
PCO substrates were tested using two identical aluminum reactors with internal volumes of 0.12 L. The reactors were gas-tight and equipped with a removable glass window and fittings for incoming and existing flows. Substrates were placed in the center of the reactor at a depth of 5.0 ± 0.5 mm below the glass window. PCO efficiencies were measured using test gas flow rates from 0.2 to 2 L/min. Flows measured before and after each test varied by less than 1%. Given the reactor dimensions and flow rates, test flows of 0.2, 1.0 and 2.0 were in the laminar regime (Re = 5, 25, 50 from Eq. 7), and the surface velocity across the substrate was 0.78, 3.92 and 7.84 cm/s, respectively. A 12 W LED flood lamp with a temperature color of 5000 K (Model 9290011835, Philips, Somerset, USA) placed 5.0 to 12.5 cm from the PCO substrate gave an irradiance of 42 to 95 W/m2 (400 – 540 nm) as measured by a radiometer (Solarmeter, Solartech Inc., Harrison Charter Township, USA). We also tested a 75 W fluorescent black light (BL) using an irradiance of 7.5 ± 0.4 W/m2 (365 nm).
VOC concentrations during each test were measured nearly continuously using a photoacoustic spectrometer (PAS, INNOVA 1312, California Analytical Instruments, Orange, USA) and periodically using a gas chromatograph/mass spectrometer (GC/MS, Model 6890/5973, Agilent Technologies, Santa Clara, USA). The PAS was coupled to a 3-channel automatic switcher that alternately selected reactor inlet and outlet flows at 1 min intervals, thus providing a near-continuous record of concentration changes. Due to the PAS’s high air sampling flow rate (1.3–2 L/min) and lack of VOC speciation, VOC levels for the PCO reactions were quantified by GC/MS. Duplicate inlet and outlet samples were collected on adsorbent tubes containing 160 mg 60/80 mesh Tenax-GR by pumping for 2 to 5 min at 2.5 ± 0.1 mL/min (low flow module, Airchek Sampler, SKC Inc., Pittsburgh, USA); flows were determined using a bubble meter. Prior to use, the adsorbent tubes were conditioned in a flow of ultrapure nitrogen at 325°C for 6 hrs. Adsorbent samples were injected onto the capillary column of the GC/MS using an automated short-path thermal desorption/cryofocusing system (Model 2000, Scientific Instrument Services, Ringoes, USA), which measures a wide range of VOCs with excellent quantification for VOCs eluting between pentane and naphthalene [55]. GC/MS parameters are reported in Supplemental Table S1. Formaldehyde at the reactor exit was measured by photoelectric photometry (GrayWolf FM-801, GrayWolf Sensing Solutions, Shelton, USA) using 0.5 h samples in both PCO and regeneration modes.
The PAS was calibrated using toluene at concentrations of 1, 2, 3, 5 and 10 ppm. Method detection limits (MDL) were determined as the standard deviation of seven replicate low concentration injections multiplied by 3.14. MDLs were 0.25 ppm (942 μg/m3) for the PAS, 0.02 ppb (0.07 μg/m3) for toluene using the GC/MS, and 4.88 ppb (6 μg/m3) for formaldehyde.
2.5 Test protocol
Initial tests were conducted to optimize the system, confirm that it was leak-tight, that sink effects were negligible (<0.5% change between inlet and exit concentrations), and that the air supply was clean (no detectable VOCs). Flow stability was confirmed. Additional tests were conducted using PCO-coated substrates to determine appropriate VOC sampling volumes and flow rates, and to investigate the presence of by-products.
Prior to each test, a new substrate was placed in the reactor, and the reactor system cleaned by purging for 1 h with clean air. Then, the desired humidity and VOC levels were set and maintained for 1 – 2 h to condition and stabilize reactor conditions, as confirmed by real-time VOC (PAS) and humidity measurements. Supplemental Table S2 details the many experimental conditions used to examine UV-PCO performance. Prior to lamp illumination, dark adsorption tests were conducted. Once the PAS confirmed steady-state conditions, the PCO reaction was initiated by turning on the visible lamp, maintained for 1 h (6 h in stabilization tests, see below) so that outlet concentrations were stable (supported by Supplemental Figure S3), duplicate VOC samples collected at reactor inlet and outlet ports to characterize PCO efficiency and by-products, and formaldehyde was measured for 0.5 h in the outlet flow. After these tests were completed, the toluene injection was stopped and the lamp kept on to regenerate the photocatalytic activity on the catalyst surface. Formaldehyde also was measured during regeneration.
2.6 Stability
The stability of the coated substrate was evaluated in two aspects: mechanical stability establishing the integrity and adhesion of the catalyst on the substrate; and the catalyst or photocatalytic stability regarding VOC removal efficiency. A “peel-off” test evaluated mechanical stability. This entailed cutting a 19 × 25 mm section of tape (3M United States, St. Paul, USA), weighing it on a microbalance (1 μg resolution), placing the sticky side of the tape on the catalyst surface, gently pressing it against the substrate, and then peeling off the tape at 2.5 or 0.25 cm/s to characterize adhesion at two abrasion levels. The tape was weighed a second time to determine the amount of PCO that became detached. This test was repeated five times at each peeling speed (using new tape strips) on randomly selected but unused sections of the substrate.
PCO stability was determined using toluene and five exposure cycles with the same substrate, each cycle consisting of 6 h of exposure to 1 ppm toluene at 95 W/m2. Duplicate VOC samples were taken every 2 h. In order to understand any potential new chemical bonds formed after PCO exposure, Raman spectra for the coating before and after PCO exposure was collected on a inVia Raman spectrometer (Renishaw Inc., West Dundee, USA) equipped with a Leica microscope, RenCam CCD Detector, a 785 nm diode laser, and 1200 lines/mm grating, and Raman data was analyzed using the Renishaw’s WiRE software package. An earlier study demonstrated that ultraviolet C (UVC)-induced regeneration can partially restore the photocatalytic activity, however, recovery was limited after long-term UVC exposure [56]. We investigated the ability to increase PCO lifetime and speedup recovery and regeneration of PCO-based materials using a thermal method in which the substrate was heated to 150 °C for 0.5 h in an oven. A second set of five exposure cycles was conducted using the same conditions except that the substrate was thermally treated between each cycle.
2.7 Quantification metrics
The single-pass removal efficiency E (%) represents the percentage of pollutant removed from the air stream after passing through the PCO reactor:
| (1) |
where Cin (mg/m3) = upstream contaminant concentration at steady state; Cout (mg/m3) = downstream contaminant concentration at steady state, and Q (L/min) = flow rate through the reactor. This definition of efficiency is used throughout this paper.
The surface reaction and by-product generation rates are based on the amount of pollutant removed and amount of by-product generated, respectively, on the catalysts effective BET surface area per unit time at steady state:
| (2) |
| (3) |
where ABET = BET surface area of catalyst (m2/g), m = catalyst mass on the tested piece (g), and a = constant accounting for effective catalyst exposure to light, here a value of 0.8 was considered for evaluation on the assumption of exponential decay of the irradiance distribution within the catalyst layer thickness [17]. Another way to estimate the effective illuminated surface area uses the average aggregate size and average effective light path [57]. In this study, the assumed value of a = 0.8 is justified by the comparison between experimental measurements and simulation results, which is presented in Section 3.5.
3. Results and discussion
3.1 Powder/film characterization
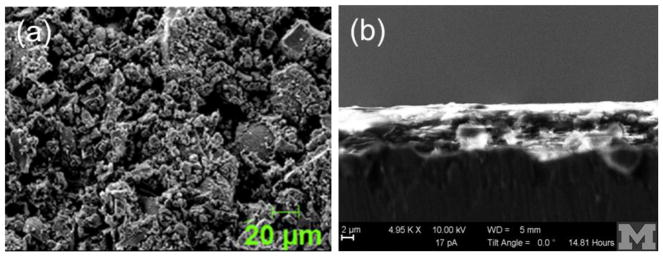
TiNbON is a fine bright yellow powder. SEM micrographs in top and side views (Fig. 2) show nanoparticles that agglomerated into irregularly shaped surfaces. Aggregates were several hundred nm to several μm in size, and the primary particles had a mean diameter of approximate 1–2 μm. The BET surface area was 40.76 m2/g, which indicates that TiNbON was as porous as P25 (50 m2/g), despite large differences in particle morphology. XRD indicated that the TiNbON phase composition was 100% in the anatase phase (Supplemental Figure S4), different from P25 which was 80% anatase and 20% rutile. The film thickness averaged 4 to 5 μm (Figure 2b).
Figure 2.
SEM micrographs of TiNbON: (a) top view, and (b) side view
The UV-vis diffuse reflectance spectra of TiNbON and P25 (Fig. 3) show that most adsorption spectra of P25 were located below 400 nm, and that the absorption edge of TiNbON red-shifts from UV into the visible region (500 to 600 nm). This provides evidence that Nb and N co-alloyed into the TiO2 lattice. The bandgap of TiNbON was estimated as 2.3 eV, corresponding to visible light at 540 nm.
3.2 Effects of operating parameters on toluene removals
Operating parameters affected PCO performance in the steady-state tests using toluene. Fig. 4a shows the effect of humidity and toluene inlet concentration. The single-pass PCO removal efficiency consistently decreased as toluene concentrations increased from 3.8 to 18.8 mg/m3; this applied at each humidity (25, 50 and 65% RH). This can be attributed to the interaction of toluene and water molecules adsorbed on the catalyst surface: given the same humidity, higher concentrations increase the number of toluene molecules per unit time entering the reactor, and a higher number of hydroxyl radicals (OH−) would be required to achieve the same efficiency, however, the amount of catalysts on the substrate surface is fixed, which potentially limits OH− production given the constant RH and irradiance conditions. Hence, efficiencies decreases at higher concentrations, as shown previously [33]. The PCO reaction rate data reveal some seemingly inconsistent trends, e.g., the highest rate occurred at 7.5 mg/m3 and 25% RH, and the apparent rate increased with inlet concentration at both 50% and 65% RH. Fig. 4a also indicates that reaction rates depended strongly on humidity. For inlet concentrations of 3.8 and 7.5 mg/m3, the efficiency and PCO reaction rate decreased as RH increased from 25 to 65%. However, for an inlet concentration of 18.8 mg/m3, humidity slightly increased PCO efficiency and reaction rates. These results can be explained by existence of an “optimal” humidity level at each toluene concentration: water is needed for PCO process since it provides the required OH− for oxidation (i.e., a shortage of water molecules will lower performance due to lack of OH−), however, at high humidity, competitive adsorption may exclude toluene from the substrate and thus inhibit PCO conversion. For example, moderate humidity, then dry conditions provided the highest reaction rates were shown to in the oxidization of benzene at high concentrations (100 ppm) [37]. An “optimal” humidity level can balance the inhibition of physical adsorption with the promotion of photochemical conversion [18]. These effects are explored in Section 3.4 and 3.5.
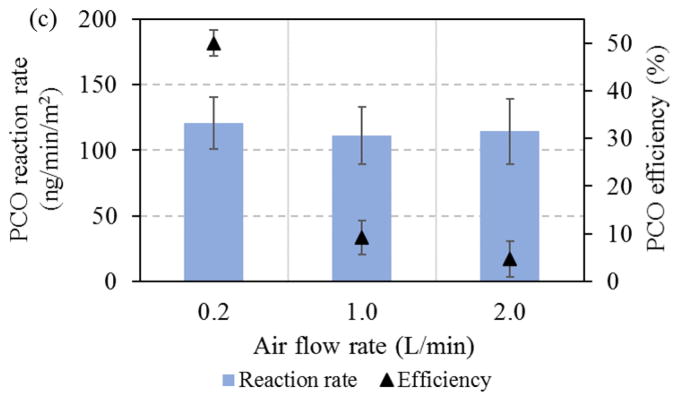
Figure 4.
Influence of operation conditions on the PCO of toluene: (a) Effect of concentration and humidity (I=95 W/m2); (b) Effect of irradiance and humidity (Cin=3.8 mg/m3); and (c) Effect of air flow (Cin=3.8 mg/m3, I=95 W/m2).
PCO efficiency and reaction rate were proportional to the level of irradiance (Fig. 4b), which generates electron-hole pairs that initiate PCO reactions by reacting with water to form OH− radicals. Again, RH levels affected results. More electron-hole pairs on the catalyst surface are produced at higher irradiance, however, recombination of photo-generated charge carriers can reduce the overall quantum efficiency [58]. The recombination time scale has been estimated to range from 1 to 10 picoseconds, much shorter than the time scale of charge carriers trapped by surface chemicals (nanoseconds) [59]. Hence, enhanced irradiance can be effectively utilized for the PCO reaction.
The effect of flow rate is shown in Fig. 4c. While PCO efficiency decreased by 10-fold as air flow rates increased from 0.2 to 2 L/min, PCO reaction rates were nearly constant. This indicates that the surface photochemical reaction rate, and not the mass transfer between gas and solid phases in the reactor, was the controlling step, i.e., the higher VOC loadings at the higher flow rate decreased removal efficiency given the similar reaction rate on the surface. Although the residence time in the reactor was reduced from 13 to 1.3 sec as air flow rates increased from 0.2 to 2.0 L/min, residence times remained much longer than the PCO reaction time (ns). Again, this indicates that surface PCO reactions were the controlling process.
3.3 By-product formation
During the PCO of toluene, no detectable other gas-phase by-products other than formaldehyde were detected in the reactor outlet flow. One possible reason is our use of low concentrations: most studies aimed at observing by-products have used test gases with much higher VOC levels, e.g., hundreds of ppm [33–38]. A second possible reason is the small volume sampled on the adsorbent tube (selected so as not to overload the GC/MS with toluene) that may have limited sensitivity for the generated by-products (possible in the pg range). In addition, some of the anticipated by-products (e.g., methanol, acetaldehyde, benzaldehyde, acetic acid [14, 60]) are unlikely to be trapped effectively and detected by the adsorbent sampling and GC/MS method used. While additional and potentially toxic by-products may be formed by the PCO of toluene, the presence of by-products at very low concentrations may pose insignificant health risks; however, further analyses using different and possibly more sensitive methods are recommended.
3.4 External mass transfer in the reactor
We first assume plug flow (reactor velocity u in m/s), which leads to a concentration boundary layer along the surface (depicted in Supplemental Figure S5). The mass balance at steady-state for the two phases is:
| (4) |
| (5) |
where S = effective BET surface area of catalyst on the plate per unit reactor volume (m−1), Cb = gaseous VOC concentration in the bulk (gas-phase) (mg/m3), Cs = VOC concentration on the catalyst surfaces (mg/m3), and km = average mass transfer coefficient (m/s). For laminar flow over a channel, km can be estimated from the following empirical correlation for the Sherwood number over the length of a plate, L (0.105 m in our case) [61]:
| (6) |
| (7) |
| (8) |
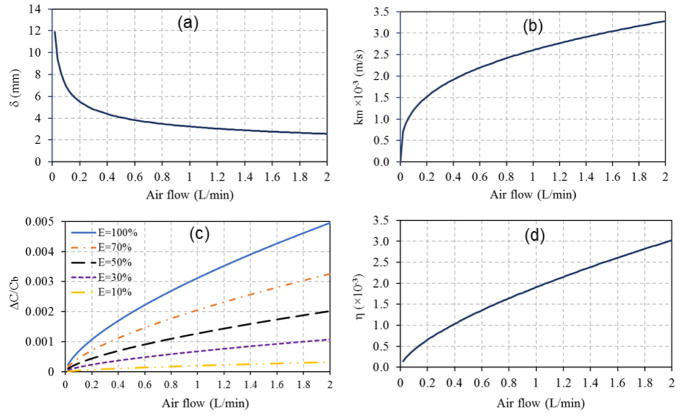
where ν = kinematic viscosity of air for a dilute gas (15.1×10⁻⁶ m2/s at 21°C), dh = hydraulic diameter (m), and D = molecular diffusion coefficient of the VOC, here 8.4×10⁻⁶ m2/s at 21°C for toluene using the WL method [17]. The boundary layer thickness δ and mass transfer coefficient km can be expressed as a function of velocity:
| (9) |
| (10) |
Fig. 5a demonstrates how boundary layer thickness decreases with air velocity, which agrees with previous findings [62]. This is an intuitive result: increasing velocity leads to steeper concentration gradients. The boundary layer thickness always exceeded the height of the shallow (5 mm) PCO reactor. Hence, concentration gradients were large in the vertical direction. Given the slow surface velocity (0.78 to 7.84 cm/s), the gas required a long time (1.3 to 13.4 sec) to pass over the plate, providing sufficient time for mass transfer from bulk flow to the catalyst surface. Fig. 5b indicates that the higher air flows tested increased the mass transfer coefficient.
Figure 5.
Influence of air flow in convective mass transfer over PCO materials on: (a) concentration boundary layer thickness; (b) mass transfer coefficient; (c) concentration gradient; and (d) η.
Assuming that the bulk concentration Cb changes linearly over the plate length in a laminar flow, a reasonably estimated is:
| (11) |
| (12) |
| (13) |
where h = channel height (0.005 m), and w = width of the plate (0.085 m). Eq. (13) further examines the significance of the external mass transfer on the heterogeneous PCO. Normally, ratios greater than 0.15 indicate that the effect of mass transfer is significant [39]. Fig. 5c shows the correlation between air flow and ΔC/Cb for different PCO efficiency profiles. At a fixed air flow and higher concentration gradient, higher removal efficiency can be reached. If the concentration gradient is fixed, a higher air flow will decrease the PCO removal efficiency. For increases in both the concentration gradient and the air flow, the PCO performance will likely remain the same. For all cases, ΔC/Cb<0.15, which indicates the external mass transfer is not significant in the reactor for the tested air flow rakes (0.2 to 2 L/min).
| (14) |
| (15) |
Fig. 5d shows η as a function of low air flows rates. Eq. (15) can be simplified to:
| (16) |
Thus, the surface concentration is approximately equal to the gaseous concentration, which further supports that external mass transfer has only a negligible influence, again supporting findings in Fig. 5c. Hence, the rate-limiting step is the PCO reaction on the catalyst surface.
3.5 Kinetic study and simulation
Three different Langmuir-Hinshelwood (LH)-based reaction rate expressions accounting for various active sites and competition were used to describe the surface reaction. The experimental kinetic data were fitted using MATLAB R2016a (MathWork Inc., Natick, USA) and information in Table 1. Several adsorption equilibrium parameters in the LH-3 model yielded negative values, which had no meaning and were thus excluded. Results in Supplemental Figure 6 show that the LH-2 model (R2 = 0.953) that considers one type of competitive sites was superior to the LH-1 model (R2 = 0.689) that considers two types of non-competitive sites. In addition, the LH-2 predictions almost fell on the 1:1 line with observations (slope = 0.964). This means that the model with one type of bimolecular competitive site provided the most suitable description of this study’s experimental data. In contrast, a different “best” model was reported for PCO of n-hexane in a tube reactor [33], possibly due to the different reactor configuration, photocatalysts, challenge gases, or other parameters.
Table 1.
Fitted parameters in the kinetic model.
| Model | Competition type | Expression | n | k ng/(min·m2)/(w/m2)n | K1 (m3/mg) | K2 (m3/mg) | K3 (m3/mg) | K4 (m3/mg) | R2 | |
|---|---|---|---|---|---|---|---|---|---|---|
| LH-1 | Two types of non-competitive sites |
|
0.8 | 4.512 | 1.240 | 1.612×10⁻³ | --- | --- | 0.814 | |
| LH-2 | One type of competitive sites |
|
0.8 | 20.625 | 0.650 | 1.061×10⁻³ | --- | --- | 0.953 | |
| LH-3 | Two types of competitive sites |
|
0.8 | 0.0110 | −0.389 | 2.469×10⁻⁵ | −0.034 | −8.587×10⁻⁵ | --- |
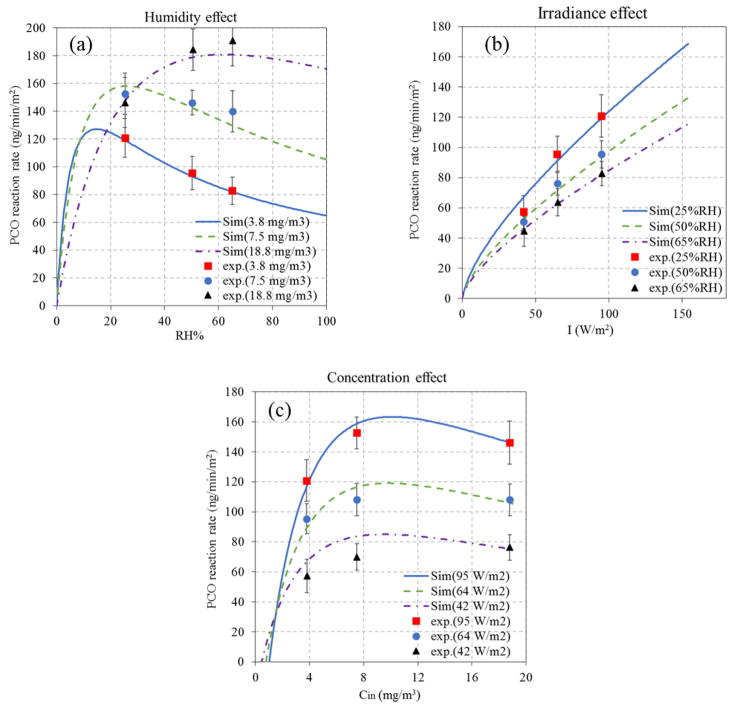
The LH-2 model was employed for simulating the PCO of toluene to examine the influence of a wide range of operational parameters, e.g., RH, irradiance, and inlet concentration, on the PCO reaction rates. Cs in the LH-2 kinetic reaction rate expression (Table 1) is an important parameter, yet it is not forward determined since the outlet concentration is unknown. This problem was solved by determining the correlation between the outlet concentration and one variable (RH or I or Cin) when other variables were kept constant. Table 2 lists outlet concentration expressions for three scenarios. Fig. 6a shows that the PCO reaction rate increases rapidly with humidity level, reaches a maximum rate at the “optimal” humidity, and then slowly declines at higher humidities. This applies at each inlet concentration. In addition, the optimal humidity increases with the inlet concentration. In consequence, relatively dry levels will be favorable for the PCO of VOCs in most non-industrial buildings due to the normally low concentrations (ppb level) of VOCs present. Interestingly, PCO reaction rates of toluene at 7.5 mg/m3 are higher than those at 18.8 mg/m3 for RH below 30%, which explains findings in Fig. 4a at 25% RH. These simulations demonstrate the importance of that competitive sorption between water and toluene molecules on the catalyst surface. Similarly, when the humidity and irradiance are constant, an optimal inlet concentration will maximize the PCO reaction rate (Fig. 6c). The impact of irradiation on the PCO reaction rate is nearly linear (Fig. 6b). In general, our experimental measurements agree with these simulations, indicating the LH-2 model describes PCO behavior in this study.
Table 2.
Surface concentration expressions.
|
| ||||||||||||
|---|---|---|---|---|---|---|---|---|---|---|---|---|
|
| ||||||||||||
| Conditions | Cout (mg/m3) | R2 | Conditions | Cout (mg/m3) | R2 | Conditions | Cout (mg/m3) | R2 | ||||
| I1=95 | Cin2=3.8 | Cout=6.93×10⁻⁵RH+1.61 | 0.963 | RH=25% | Cout=20.05I−0.518 | 0.999 | RH=25% | I1=95 | Cout=0.982Cin-2.016 | 0.999 | ||
| Cin2=7.5 | Cout=2.64×10⁻⁵RH+4.97 | 0.980 | Cin2=3.8 | RH=50% | Cout=10.12I−0.326 | 0.999 | I1=64 | Cout=0.990Cin-1.531 | 1.000 | |||
| Cin2=18.8 | Cout= −9.78×10⁻⁵RH+16.9 | 0.939 | RH=65% | Cout=10.08I−0.313 | 0.982 | I1=42 | Cout=0.983Cin-0.892 | 1.000 | ||||
Unit of I is W/m2
Unit of Cin is mg/m3
Figure 6.
Simulated and observed effects on the PCO reaction rates for toluene at steady-state: (a) influence of humidity with I = 95 w/m2; (b) influence of irradiance with Cin = 3.8 mg/m3; and (c) influence of inlet concentration with RH = 25%.
3.6 Comparison with P25N
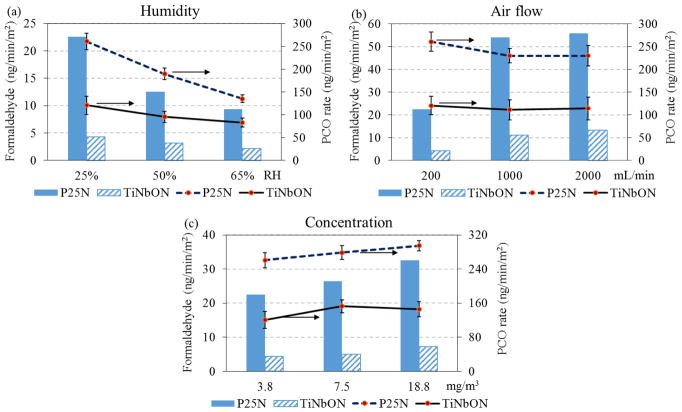
PCO performance of TiNbON initiated by a visible light was compared with that of P25N under black light to demonstrate new features of TiNbON that may relate to real world applications. Fig. 7 shows that the PCO reaction rates and formaldehyde generation rates of the two catalysts under several conditions. Usually, formaldehyde generation rates from P25N were 3 to 5 times higher than those from TiNbON, while PCO reaction rates of P25N were 1–2 fold higher than TiNbON. P25’s higher PCO activity may be attributed to the rutile phase (20%) that promotes electron-hole pair separation, thus suppressing recombination [63]. However, P25 had lower ability to mineralize toluene and the by-products increased health risk. It is interesting to observe that P25N was susceptible to RH (from 261 ng/min-m2 at 25% RH to 135 ng/min-m2 at 65% RH), but TiNbON had slightly lower PCO reaction rate with humidity. Possibly, Nb and oxynitrides may modify the hydrophilicity, rendering TiNbON less vulnerable to humidity, suggesting that TiNbON might apply to a wide range of environments. In general, operation parameters produced similar trends for both P25N and TiNbON since they were TiO2-based catalysts. PCO performance of P25 under visible LED light was negligible (PCO efficiency < 2%), implying that TiNbON successfully expands the adsorption spectrum from UV to visible range and has ability to be applied in the building material surfaces.
Figure 7.
Comparison of PCO performance for P25N with BLB (7.5 W/m2) and TiNbON with LED (95 W/m2) under varying (a) humidity levels (toluene 3.8 mg/m3, air flow 0.2 L/min), (b) air flow rates (toluene 3.8 mg/m3, 25%RH), and (c) inlet concentrations (25%RH, air flow 0.2 L/min).
3.7 Adhesion
The peeling-off test showed average losses of 88 ± 12 μg/cm2 (loss percentage of 7.9 ±1.1%) and 222 ± 20 μg/cm2 (19.9 ± 1.8%) at peeling-off speeds of 0.25 cm/s and 2.5 cm/s, respectively. These results suggest potentially reasonable resistance to mechanical abrasion. This is further supported a lack of visible particles lost from the coated substrates and left in the reactor throughout the tests.
3.8 Stability and regeneration
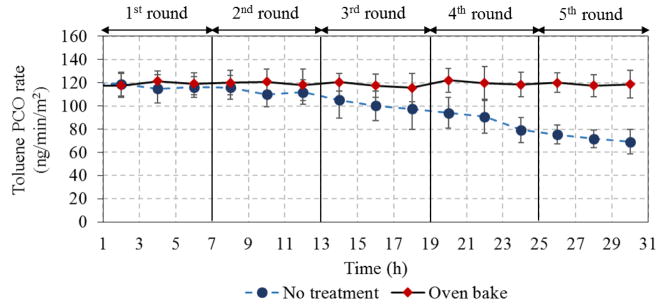
As the amount of chemisorbed-intermediates, e.g., carboxylic acids [14, 60], on active sites increased, the net transfer from toluene to intermediates declined and decreased the available vacant sites. In turn, this decreased site availability caused a gradual decline in the adsorption of toluene from the gas-phase, which led to an obvious decline of the PCO reaction rate. After two cycles of photo-degradation, TiNbON exhibited a significant loss of PCO activity, and as the reaction proceeded, reaction rates continued to decrease (Fig. 8) as did generation of the by-product formaldehyde. This can be attributed to chemisorbed intermediates with high affinity that gradually blocked active PCO sites and inhibited water molecules from adsorbing and converting intermediates into small gaseous molecules. We also observed a color change from bright yellow to dark yellow after five cycles. Unfortunately, Raman result shows little difference between the sample after 5-cycle exposure to toluene and the reference. No signals in the organic region (500–2000 cm−1) of the vibrational spectrum were detected. If there was anything by-product adsorbed, it was below the detection limits (~ 0.1–1 mg/cm2) of the measurement. Considering the tested concentration (1 ppm) was higher than the (ppb) levels normally encountered in non-industrial buildings, the deactivation time in real world settings would be much longer than shown in our tests.
Figure 8.
Stability of TiNbON for toluene removal after 5 6-hr test cycles (toluene 3.8 mg/m3, 25%RH, 0.2 L/min, LED 95 W/m2)
The regeneration performance shown in Fig. 9 demonstrates that thermal conditioning maintained PCO rates at 119 ± 2 ng/min-m2 without significant change over the five repeated cycles. Thus, thermal regeneration effectively removed the refractory intermediates and fully restored the PCO activity.
4. Conclusion
This study characterized the performance of a co-alloyed TiNbON compound, a visible light active photocatalytic (PCO) material that can oxidize toluene and other VOCs. Compared to other TiO2-based materials, the band gap of TiNbON was reduced to 2.3 eV with the responsive edge wavelength of 540 nm, and the removal efficiency of toluene under visible light was high. A parametric evaluation of TiNbON performance used toluene concentrations from 1 to 5 ppm, relative humidities from 25 to 65%, air velocities from 0.78 to 7.84 cm/s, and irradiances from 42 to 95 W/m2. PCO efficiency increased at lower air velocities and higher irradiance levels, and interactions with humidity and inlet concentrations could be explained using a Langmuir-Hinshelwood-based kinetic model using one active site with competition of toluene and water molecules at the catalyst surface. The surface PCO reaction, rather than mass transfer, was the rate-limiting step in the reactor. Formaldehyde was detected as a by-product of both the PCO and regeneration processes. In comparison to other TiO2-based materials, TiNbON had greater ability to resist the influence of humidity and generated lower levels of formaldehyde. Finally, the long-term durability tests show that TiNbON gradually lost PCO activity, but thermal regeneration could restore its performance, and that the material had reasonable abrasion resistance.
The experimental results suggest that TiNbON films applied to building materials may represent a promising option to reduce VOC pollutants in indoor applications. PCO materials can work indoors, and the ongoing transition of lighting technologies in buildings (from incandescent, to fluorescent and LEDs) allow successful application of PCO technology. However, further research is needed to evaluate the potential for harmful by-products, to identify optimal conditions and means to regenerate PCO materials, and to use field tests to show real-world performance.
Supplementary Material
Highlights.
Morphology, structure and band-gap energy of TiNbON demonstrate its ability to be driven by visible light.
Toluene removal by TiNbON strongly depends on humidity, concentration and irradiance.
A Langmuir–Hinshelwood kinetic model considering one active site with competition best fitted results.
TiNbON advantages for VOC removal include low sensitive to RH, less formaldehyde formation, and durability.
Acknowledgments
The authors gratefully acknowledge the financial support from the Institut de Recherché Robert-Sauvé en Santé et en Sécurité du Travail (IRSST), Quebec, Canada. Additional support was provided by grants P30ES017885 from the National Institute of Environmental Health Sciences, National Institutes of Health, and T42 OH008455-10 from the National Institute of Occupational Health and Safety.
Footnotes
Publisher's Disclaimer: This is a PDF file of an unedited manuscript that has been accepted for publication. As a service to our customers we are providing this early version of the manuscript. The manuscript will undergo copyediting, typesetting, and review of the resulting proof before it is published in its final citable form. Please note that during the production process errors may be discovered which could affect the content, and all legal disclaimers that apply to the journal pertain.
References
- 1.IEA. World Energy Outlook Special Report 2016: Energy and Air Pollution. International Energy Agency; 2016. [Google Scholar]
- 2.Ots R, Young DE, Vieno M, Xu L, Dunmore RE, Allan JD, Coe H, Williams LR, Herndon SC, Ng NL, Hamilton JF, Bergstrom R, Di Marco C, Nemitz E, Mackenzie IA, Kuenen JJP, Green DC, Reis S, Heal MR. Simulating secondary organic aerosol from missing diesel-related intermediate-volatility organic compound emissions during the Clean Air for London (ClearfLo) campaign. Atmos Chem Phys. 2016;16:6453–6473. [Google Scholar]
- 3.Sari D, Bayram A. Quantification of emissions from domestic heating in residential areas of Izmir, Turkey and assessment of the impact on local/regional air-quality. Sci Total Environ. 2014;488:431–438. doi: 10.1016/j.scitotenv.2013.11.033. [DOI] [PubMed] [Google Scholar]
- 4.Alam MS, West CE, Scarlett AG, Rowland SJ, Harrison RM. Application of 2D-GCMS reveals many industrial chemicals in airborne particulate matter. Atmospheric Environment. 2013;65:101–111. [Google Scholar]
- 5.Brito J, Wurm F, Yanez-Serrano AM, de Assuncao JV, Godoy JM, Artaxo P. Vehicular Emission Ratios of VOCs in a Megacity Impacted by Extensive Ethanol Use: Results of Ambient Measurements in Sao Paulo, Brazil. Environmental science & technology. 2015;49:11381–11387. doi: 10.1021/acs.est.5b03281. [DOI] [PubMed] [Google Scholar]
- 6.Shin HM, McKone TE, Bennett DH. Volatilization of low vapor pressure - volatile organic compounds (LVP-VOCs) during three cleaning products-associated activities: Potential contributions to ozone formation. Chemosphere. 2016;153:130–137. doi: 10.1016/j.chemosphere.2016.02.131. [DOI] [PubMed] [Google Scholar]
- 7.Li J, Wu RR, Li YQ, Hao YF, Xie SD, Zeng LM. Effects of rigorous emission controls on reducing ambient volatile organic compounds in Beijing, China. Sci Total Environ. 2016;557:531–541. doi: 10.1016/j.scitotenv.2016.03.140. [DOI] [PubMed] [Google Scholar]
- 8.ASHRAE. ASHRAE Standard 52.2. Methods of Testing General-Ventilation Air-Cleaning Devices for Removal Efficiency by Particle Size. 2012 [Google Scholar]
- 9.USEPA. Residential Air Cleaners (Second Edition): A Summary of Available Information. 2009. [Google Scholar]
- 10.Ballari MM, Brouwers HJH. Full scale demonstration of air-purifying pavement. Journal Of Hazardous Materials. 2013;254:406–414. doi: 10.1016/j.jhazmat.2013.02.012. [DOI] [PubMed] [Google Scholar]
- 11.Cedillo-Gonzalez EI, Mugoni C, Montorsi M, Siligardi C. Evaluation of the correlations between temperature, humidity, incident UV light and the photocatalytic activity of TiO2 films using a rationale approach. Applied Surface Science. 2016;378:73–79. [Google Scholar]
- 12.Chen J, Poon CS. Photocatalytic construction and building materials: From fundamentals to applications. Building And Environment. 2009;44:1899–1906. [Google Scholar]
- 13.Lee JY, Jo WK. Heterojunction-based two-dimensional N-doped TiO2/WO3 composite architectures for photocatalytic treatment of hazardous organic vapor. Journal Of Hazardous Materials. 2016;314:22–31. doi: 10.1016/j.jhazmat.2016.04.012. [DOI] [PubMed] [Google Scholar]
- 14.Mo JH, Zhang YP, Xu QJ. Effect of water vapor on the by-products and decomposition rate of ppb-level toluene by photocatalytic oxidation. Applied Catalysis B-Environmental. 2013;132:212–218. [Google Scholar]
- 15.Ochiai T, Fujishima A. Photoelectrochemical properties of TiO2 photocatalyst and its applications for environmental purification. Journal Of Photochemistry And Photobiology C-Photochemistry Reviews. 2012;13:247–262. [Google Scholar]
- 16.Sleiman M, Conchon P, Ferronato C, Chovelon JM. Photocatalytic oxidation of toluene at indoor air levels (ppbv): Towards a better assessment of conversion, reaction intermediates and mineralization. Applied Catalysis B-Environmental. 2009;86:159–165. [Google Scholar]
- 17.Zhong LX, Haghighat F, Lee CS. Ultraviolet photocatalytic oxidation for indoor environment applications: Experimental validation of the model. Building And Environment. 2013;62:155–166. [Google Scholar]
- 18.Zhong LX, Haghighat F, Lee CS, Lakdawala N. Performance of ultraviolet photocatalytic oxidation for indoor air applications: Systematic experimental evaluation. Journal Of Hazardous Materials. 2013;261:130–138. doi: 10.1016/j.jhazmat.2013.07.014. [DOI] [PubMed] [Google Scholar]
- 19.Huang Y, Ho SSH, Lu YF, Niu RY, Xu LF, Cao JJ, Lee S. Removal of Indoor Volatile Organic Compounds via Photocatalytic Oxidation: A Short Review and Prospect. Molecules. 2016;21 doi: 10.3390/molecules21010056. [DOI] [PMC free article] [PubMed] [Google Scholar]
- 20.Li D, Haneda H, Hishita S, Ohashi N. Visible-light-driven N-F-codoped TiO2 photocatalysts. 2. Optical characterization, photocatalysis, and potential application to air purification. Chemistry Of Materials. 2005;17:2596–2602. [Google Scholar]
- 21.Zhang Q, Huang Y, Xu LF, Cao JJ, Ho WK, Lee SC. Visible-Light-Active Plasmonic Ag-SrTiO3 Nanocomposites for the Degradation of NO in Air with High Selectivity. ACS applied materials & interfaces. 2016;8:4165–4174. doi: 10.1021/acsami.5b11887. [DOI] [PubMed] [Google Scholar]
- 22.Dong F, Ni ZL, Li PD, Wu ZB. A general method for type I and type II g-C3N4/g-C3N4 metal-free isotype heterostructures with enhanced visible light photocatalysis. New Journal Of Chemistry. 2015;39:4737–4744. [Google Scholar]
- 23.Kubacka A, Colon G, Fernandez-Garcia M. Cationic (V, Mo, Nb, W) doping of TiO2-anatase: A real alternative for visible light-driven photocatalysts. Catalysis Today. 2009;143:286–292. [Google Scholar]
- 24.Brancho JJ, Bartlett BM. Challenges in Co-Alloyed Titanium Oxynitrides, a Promising Class of Photochemically Active Materials. Chemistry Of Materials. 2015;27:7207–7217. [Google Scholar]
- 25.Breault TM, Brancho JJ, Guo P, Bartlett BM. Visible Light Water Oxidation Using a Co-Catalyst Loaded Anatase-Structured Ti1-(5x/4)NbxO2-y-delta Ny Compound. Inorganic Chemistry. 2013;52:9363–9368. doi: 10.1021/ic400932m. [DOI] [PubMed] [Google Scholar]
- 26.Breault TM, Bartlett BM. Composition Dependence of TiO2:(Nb,N)-x Compounds on the Rate of Photocatalytic Methylene Blue Dye Degradation. Journal Of Physical Chemistry C. 2013;117:8611–8618. [Google Scholar]
- 27.Guo M-Z, Ling T-C, Poon C-S. TiO2-based self-compacting glass mortar: Comparison of photocatalytic nitrogen oxide removal and bacteria inactivation. Building and Environment. 2012;53:1–6. [Google Scholar]
- 28.Mills A, Burns L, O’Rourke C, Elouali S. Kinetics of the photocatalysed oxidation of NO in the ISO 22197 reactor. J Photoch Photobio A. 2016;321:137–142. [Google Scholar]
- 29.de Melo JVS, Triches G. Evaluation of the influence of environmental conditions on the efficiency of photocatalytic coatings in the degradation of nitrogen oxides (NOx) Building And Environment. 2012;49:117–123. [Google Scholar]
- 30.Cárdenas C, Tobón JI, García C, Vila J. Functionalized building materials: Photocatalytic abatement of NOx by cement pastes blended with TiO2 nanoparticles. Construction and Building Materials. 2012;36:820–825. [Google Scholar]
- 31.Pirola C, Boffito DC, Vitali S, Bianchi CL. Photocatalytic coatings for building industry: study of 1 year of activity in the NO (x) degradation. Journal Of Coatings Technology And Research. 2012;9:453–458. [Google Scholar]
- 32.Suarez S, Portela R, Hernandez-Alonso MD, Sanchez B. Development of a versatile experimental setup for the evaluation of the photocatalytic properties of construction materials under realistic outdoor conditions. Environmental science and pollution research international. 2014;21:11208–11217. doi: 10.1007/s11356-014-2725-y. [DOI] [PubMed] [Google Scholar]
- 33.Monteiro RAR, Lopes FVS, Silva AMT, Angelo J, Silva GV, Mendes AM, Boaventura RAR, Vilar VJP. Are TiO2-based exterior paints useful catalysts for gas-phase photooxidation processes? A case study on n-decane abatement for air detoxification. Applied Catalysis B-Environmental. 2014;147:988–999. [Google Scholar]
- 34.Le Bechec M, Kinadjian N, Ollis D, Backov R, Lacombe S. Comparison of kinetics of acetone, heptane and toluene photocatalytic mineralization over TiO2 microfibers and Quartzel (R) mats. Applied Catalysis B-Environmental. 2015;179:78–87. [Google Scholar]
- 35.Huang HL, Huang HB, Zhan YJ, Liu GY, Wang XM, Lu HX, Xiao L, Feng QY, Leung DYC. Efficient degradation of gaseous benzene by VUV photolysis combined with ozone-assisted catalytic oxidation: Performance and mechanism. Applied Catalysis B-Environmental. 2016;186:62–68. [Google Scholar]
- 36.Antonello A, Soliveri G, Meroni D, Cappelletti G, Ardizzone S. Photocatalytic remediation of indoor pollution by transparent TiO2 films. Catalysis Today. 2014;230:35–40. [Google Scholar]
- 37.Pham TD, Lee BK, Lee CH. The advanced removal of benzene from aerosols by photocatalytic oxidation and adsorption of Cu-TiO2/PU under visible light irradiation. Applied Catalysis B-Environmental. 2016;182:172–183. [Google Scholar]
- 38.Dhada I, Nagar PK, Sharma M. Photo-catalytic oxidation of individual and mixture of benzene, toluene and p-xylene. International Journal Of Environmental Science And Technology. 2016;13:39–46. [Google Scholar]
- 39.Vargas DXM, De la Rosa JR, Lucio-Ortiz CJ, Hernandez-Ramirez A, Flores-Escamilla GA, Garcia CD. Photocatalytic degradation of trichloroethylene in a continuous annular reactor using Cu-doped TiO2 catalysts by sol-gel synthesis. Applied Catalysis B-Environmental. 2015;179:249–261. [Google Scholar]
- 40.Colmenares JC, Magdziarz A, Lomot D, Chernyayeva O, Lisovytskiy D. A new photocatalytic tool in VOCs abatement: Effective synergetic combination of sonication and light for the synthesis of monometallic palladium-containing TiO2. Applied Catalysis B-Environmental. 2014;147:624–632. [Google Scholar]
- 41.Salthammer T, Fuhrmann F. Photocatalytic surface reactions on indoor wall paint. Environmental science & technology. 2007;41:6573–6578. doi: 10.1021/es070057m. [DOI] [PubMed] [Google Scholar]
- 42.Gallus M, Ciuraru R, Mothes F, Akylas V, Barmpas F, Beeldens A, Bernard F, Boonen E, Boreave A, Cazaunau M, Charbonnel N, Chen H, Daele V, Dupart Y, Gaimoz C, Grosselin B, Herrmann H, Ifang S, Kurtenbach R, Maille M, Marjanovic I, Michoud V, Mellouki A, Miet K, Moussiopoulos N, Poulain L, Zapf P, George C, Doussin JF, Kleffmann J. Photocatalytic abatement results from a model street canyon. Environmental Science And Pollution Research. 2015;22:18185–18196. doi: 10.1007/s11356-015-4926-4. [DOI] [PubMed] [Google Scholar]
- 43.Huang H, Huang H, Zhan Y, Liu G, Wang X, Lu H, Xiao L, Feng Q, Leung DYC. Efficient degradation of gaseous benzene by VUV photolysis combined with ozone-assisted catalytic oxidation: Performance and mechanism. Applied Catalysis B: Environmental. 2016;186:62–68. [Google Scholar]
- 44.Monteiro RAR, Lopes FVS, Silva AMT, Ângelo J, Silva GV, Mendes AM, Boaventura RAR, Vilar VJP. Are TiO2-based exterior paints useful catalysts for gas-phase photooxidation processes? A case study on n-decane abatement for air detoxification. Applied Catalysis B: Environmental. 2014;147:988–999. [Google Scholar]
- 45.Farhanian D, Haghighat F. Photocatalytic oxidation air cleaner: Identification and quantification of by-products. Building and Environment. 2014;72:34–43. [Google Scholar]
- 46.Gunschera J, Markewitz D, Bansen B, Salthammer T, Ding H. Portable photocatalytic air cleaners: efficiencies and by-product generation. Environmental Science and Pollution Research. 2016;23:7482–7493. doi: 10.1007/s11356-015-5992-3. [DOI] [PubMed] [Google Scholar]
- 47.Costarramone N, Kartheuser B, Pecheyran C, Pigot T, Lacombe S. Efficiency and harmfulness of air-purifying photocatalytic commercial devices: From standardized chamber tests to nanoparticles release. Catalysis Today. 2015;252:35–40. [Google Scholar]
- 48.Thevenet F, Guillard C, Rousseau A. Acetylene photocatalytic oxidation using continuous flow reactor: Gas phase and adsorbed phase investigation, assessment of the photocatalyst deactivation. Chemical Engineering Journal. 2014;244:50–58. [Google Scholar]
- 49.Chen KY, Zhu LZ, Yang K. Tricrystalline TiO2 with enhanced photocatalytic activity and durability for removing volatile organic compounds from indoor air. Journal of Environmental Sciences. 2015;32:189–195. doi: 10.1016/j.jes.2014.10.023. [DOI] [PubMed] [Google Scholar]
- 50.Pei P, Xiong HG, Cai J, Liu C, Zia ud D, Yu Y. Enhanced the weatherability of bamboo fiber-based outdoor building decoration materials by rutile nano-TiO2. Construction and Building Materials. 2016;114:307–316. [Google Scholar]
- 51.Vulic T, Rudic O, Vucetic S, Lazar D, Ranogajec J. Photocatalytic activity and stability of TiO2/ZnAl layered double hydroxide based coatings on mortar substrates. Cement & Concrete Composites. 2015;58:50–58. [Google Scholar]
- 52.Fufa SM, Jelle BP, Hovde PJ. Weathering performance of spruce coated with water based acrylic paint modified with TiO2 and clay nanoparticles. Progress in Organic Coatings. 2013;76:1543–1548. [Google Scholar]
- 53.Guo MZ, Ling TC, Poon CS. Nano-TiO2-based architectural mortar for NO removal and bacteria inactivation: Influence of coating and weathering conditions. Cement & Concrete Composites. 2013;36:101–108. [Google Scholar]
- 54.ASHRAE. Standard 62.1-2016 -- Ventilation for Acceptable Indoor Air Quality. 2016. [Google Scholar]
- 55.Peng CY, Batterman S. Performance evaluation of a sorbent tube sampling method using short path thermal desorption for volatile organic compounds. Journal Of Environmental Monitoring. 2000;2:313–324. doi: 10.1039/b003385p. [DOI] [PubMed] [Google Scholar]
- 56.Zhong LX, Lee CS, Haghighat F, Bahloul A. Deactivation and ultraviolet C-induced regeneration of photocatalytic oxidation air filters. Science And Technology for the Built Environment. 2016;22:576–585. [Google Scholar]
- 57.Munoz-Batista MJ, Kubacka A, Hungria AB, Fernandez-Garcia M. Heterogeneous photocatalysis: Light-matter interaction and chemical effects in quantum efficiency calculations. Journal Of Catalysis. 2015;330:154–166. [Google Scholar]
- 58.Pelaez M, Nolan NT, Pillai SC, Seery MK, Falaras P, Kontos AG, Dunlop PSM, Hamilton JWJ, Byrne JA, O’Shea K, Entezari MH, Dionysiou DD. A review on the visible light active titanium dioxide photocatalysts for environmental applications. Applied Catalysis B-Environmental. 2012;125:331–349. [Google Scholar]
- 59.Etacheri V, Di Valentin C, Schneider J, Bahnemann D, Pillai SC. Visible-light activation of TiO2 photocatalysts: Advances in theory and experiments. Journal of Photochemistry and Photobiology C-Photochemistry Reviews. 2015;25:1–29. [Google Scholar]
- 60.Mo JH, Zhang YP, Xu QJ, Zhu YF, Lamson JJ, Zhao RY. Determination and risk assessment of by-products resulting from photocatalytic oxidation of toluene. Applied Catalysis B-Environmental. 2009;89:570–576. [Google Scholar]
- 61.Mulder M. Basic Principles of Membrane Technology. Springer; 1991. [Google Scholar]
- 62.Chrysikopoulos CV, Hsuan PY, Fyrillas MM, Lee KY. Mass transfer coefficient and concentration boundary layer thickness for a dissolving NAPL pool in porous media. Journal of Hazardous Materials. 2003;97:245–255. doi: 10.1016/s0304-3894(02)00264-9. [DOI] [PubMed] [Google Scholar]
- 63.Su R, Bechstein R, Sø L, Vang RT, Sillassen M, Esbjörnsson B, Palmqvist A, Besenbacher F. How the Anatase-to-Rutile Ratio Influences the Photoreactivity of TiO2. The Journal of Physical Chemistry C. 2011;115:24287–24292. [Google Scholar]
Associated Data
This section collects any data citations, data availability statements, or supplementary materials included in this article.


