Figure 1.
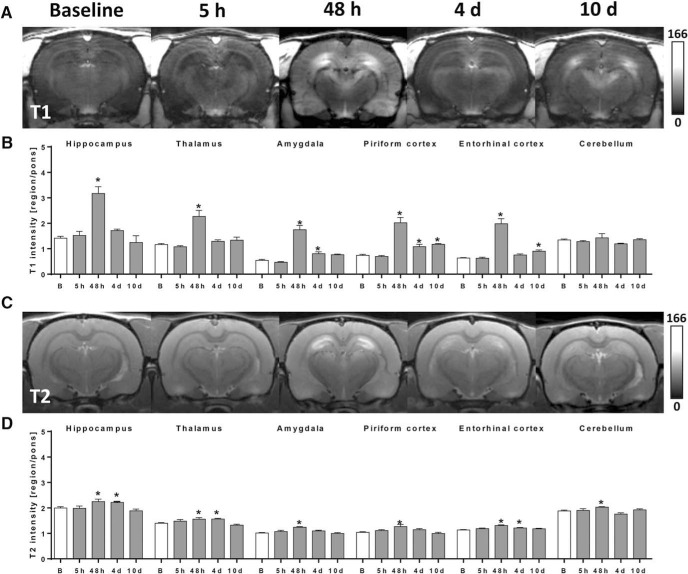
Spatiotemporal course of blood–brain barrier (BBB) impairment and cerebral edema following status epilepticus (SE) as assessed in vivo by 7T MRI. A, Exemplary contrast-enhanced T1-weighted coronal brain images in identical gray scale displaying region-dependent severity of BBB leakage during epileptogenesis at 5 h, 48 h, 4 d, and 10 d post-SE. B, Quantified T1-modified driven equilibrium Fourier transform (MDEFT) values measured after infusion of gadolinium-diethylenetriamine pentaacetic acid (Gd-DTPA) as surrogate marker for BBB leakage before (n = 13) and 5 h (n = 5), 48 h (n = 5), 4 d (n = 6), and 10 d (n = 5) post-SE. C, Exemplary T2-weighted coronal brain images displaying region-dependent severity of cerebral edema during epileptogenesis. D, Quantified T2 multislice-multiecho (MSME) values measured before (n = 13) and 5 h (n = 4), 48 h (n = 5), 4 d (n = 6), and 10 d (n = 5) post-SE. Data in B and D are normalized to pons and illustrated as mean ± SEM. * p < 0.05 versus baseline (B), one-way ANOVA, Dunnett’s post hoc test.

