
Figure 8.
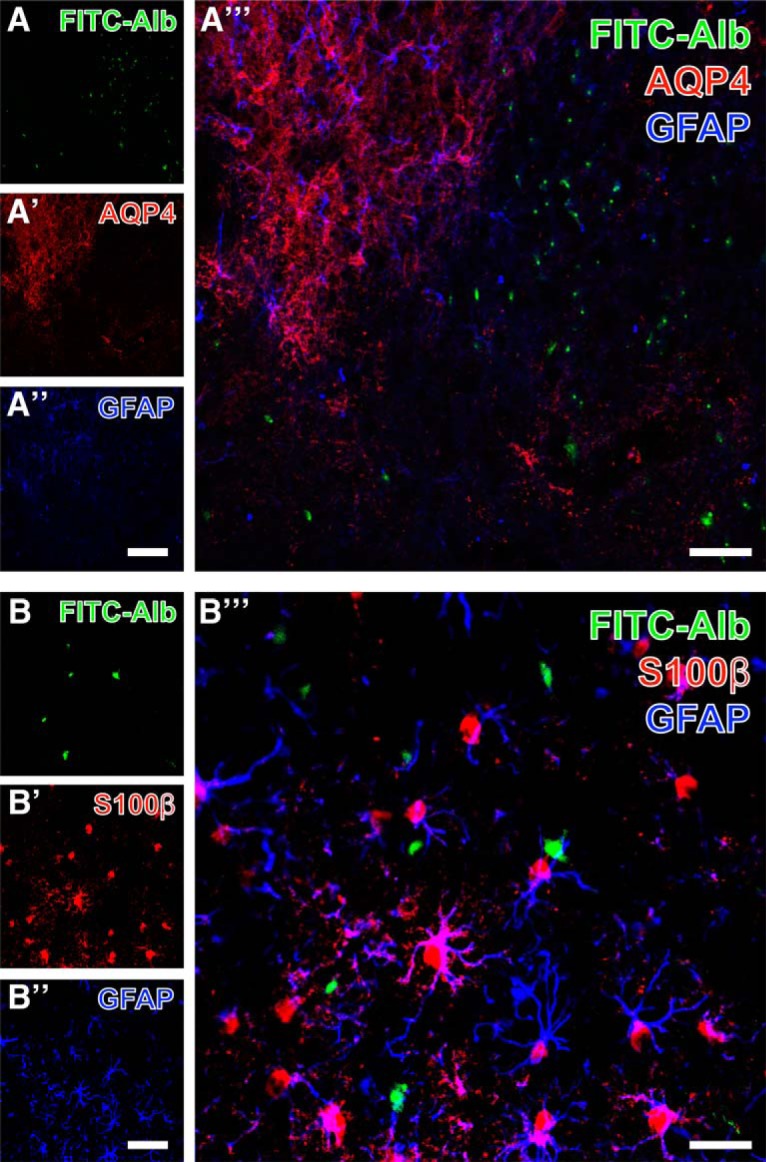
Detection of GFAP and cellular FITC-coupled albumin (FITC-Alb) in SE-affected thalamus 48 h after SE onset combined with immunolabeling of aquaporin-4 (AQP4; A–A″′) or S100β (B–B″′). FITC-Alb in A is seen in region devoid of Cy3 staining for AQP4 (A′) and diminished GFAP immunosignals (A″). The overlay of staining patterns (A″′) reveals a nearly complementary occurrence of FITC-Alb and AQP4 expression, but also shows remnants of mostly punctuate GFAP-immunoreactive structures. At higher magnification, in another thalamic area from the same animal, Cy3 counterstaining of S100β (B′) predominantly reveals astroglial somata with numerous processes, whereas the immunodetection of GFAP with Cy5 (B″, color-coded in blue) visualizes astrocytic intermediate filaments. The merge of staining patterns (B″′) clearly demonstrates numerous astrocytes coexpressing both astroglia-specific markers but lacking allocated FITC-Alb. Scale bars: A″ (also valid for A, A′) = 100 µm, A″′ = 50 µm, B″ (also valid for B, A′) = 50 µm, B″′ = 25 µm.