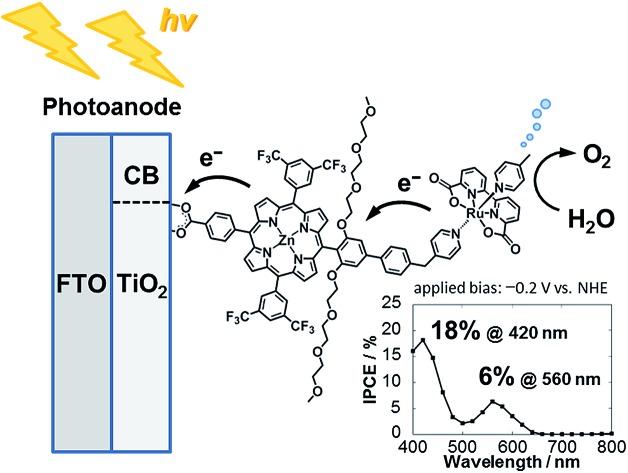
 The combination of porphyrin as a sensitizer and a ruthenium complex as a water oxidation catalyst (WOC) is promising to exploit highly efficient molecular artificial photosynthetic systems.
Abstract
The combination of porphyrin as a sensitizer and a ruthenium complex as a water oxidation catalyst (WOC) is promising to exploit highly efficient molecular artificial photosynthetic systems. A covalently-linked ruthenium-based WOC–zinc porphyrin (ZnP) sensitizer dyad was assembled on a TiO2 electrode for visible-light driven water oxidation. The water oxidation activity was found to be improved in comparison to the reference systems with the simple combination of the individual WOC and ZnP as well as with ZnP solely, demonstrating the advantage of the covalent linking approach over the non-covalent one. More importantly, via vectorial multi-step electron transfer triggered by visible light, the dye-sensitized photoelectrochemical cell (DSPEC) achieved a broader PEC response in the visible region than DSPECs with conventional ruthenium-based sensitizers. Initial incident photon-to-current efficiencies of 18% at 424 nm and 6.4% at 564 nm were attained under monochromatic illumination and an external bias of –0.2 V vs. NHE. Fast electron transfer from the WOC to the photogenerated radical cation of the sensitizer through the covalent linkage may suppress undesirable charge recombination, realizing the moderate performance of water oxidation. X-ray photoelectron spectroscopic analysis of the photoanodes before and after the DSPEC operation suggested that most of the ruthenium species exist at higher oxidation states, implying that the insufficient oxidation potential of the ZnP moiety for further oxidizing the intermediate ruthenium species at the photoanode is at least the bottleneck of the system.
Introduction
Finding renewable energy sources is a crucial task in making our society sustainable. In this regard, the exploitation of sunlight as an infinite energy source is fascinating. In particular, realizing artificial photosynthesis, i.e., integration of light-harvesting, multi-step electron and proton transfer, and water oxidation for the efficient production of fuels like hydrogen is challenging in chemistry.1–6 For this purpose, dye-sensitized photoelectrochemical cells (DSPECs) have been investigated,7–12 as heterogeneous water splitting on inorganic semiconductors is promising for the upcoming large scale device operation. In DSPECs, a molecular sensitizer adsorbed on a semiconducting electrode captures visible light and injects an electron from the sensitizer’s excited state (S*) to the conduction band (CB) of the electrode. Then, the sensitizer’s radical cation (S˙+) extracts an electron from the water oxidation catalyst (WOC) to regenerate the sensitizer and one-electron oxidized WOC. After repeating the cycle, high oxidation states of the WOC are generated, eventually converting two water molecules into four protons and one oxygen molecule. The sensitizer bis(2,2′-bipyridine)(4,4′-diphosphonato-2,2′-bipyridine)ruthenium(ii) (RuP)13 has been frequently used for the construction of molecular artificial photosynthetic systems,7,8,10–12,14 due to its sufficient first oxidation potential for water oxidation and the long lifetime of its excited state for electron injection (Fig. 1).13 However, the light-harvesting ability of RuP is rather poor in the visible region beyond 500 nm. Considering that yellow to red photons mainly shower down on Earth from the Sun,15 the utilization of photons in the visible region is essential for the efficient chemical conversion of sunlight. In this context, porphyrins16 are attractive as sensitizers because of their excellent light-harvesting properties in the visible region and the facile tuning of their excited states and redox properties via their peripheral functionalization. Nevertheless, molecular artificial photosynthetic systems with porphyrins as sensitizers are so far limited9,17 owing to their poor performance. One plausible reason is the occurrence of fast charge recombination (CR) between the electron injected into the CB of TiO2 (denoted as TiO2(e–)) and S˙+.18,19 CR from TiO2(e–) to the oxidized WOC is also reported to take place within a few microseconds.20 Undesirable CR from TiO2(e–) to water is also suggested.7c Therefore, to overcome these drawbacks, it is significant to modulate the electron transfer (ET) properties using covalent linkage.
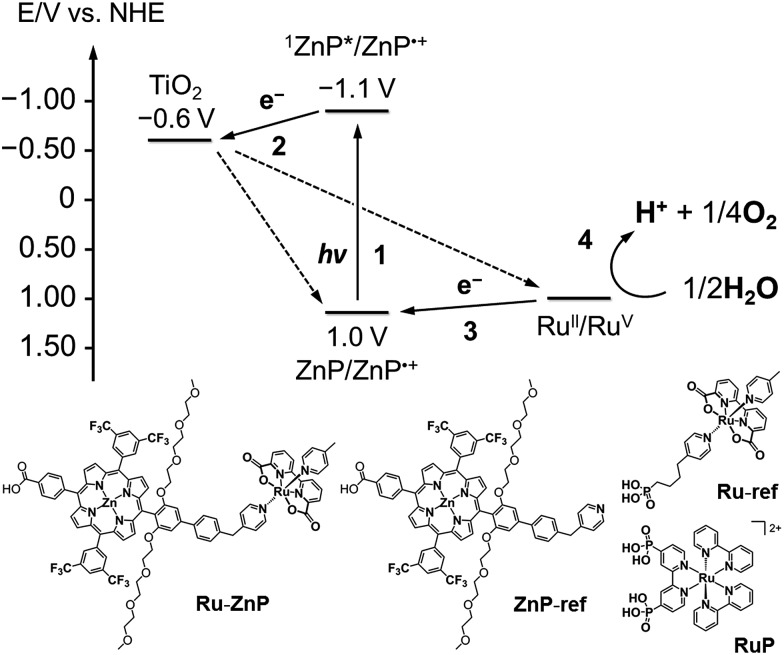
Fig. 1. (top) Energy diagram and schematic diagram of a ruthenium catalyst–porphyrin dyad (Ru–ZnP) on a TiO2–FTO substrate (denoted as TiO2/FTO) at a neutral pH. Other possible processes are depicted in Fig. S1† (vide infra). (bottom) Chemical structures of Ru–ZnP, ZnP-ref, Ru-ref and RuP.
Meanwhile, it is also necessary to use highly efficient WOCs as building blocks of DSPECs. Homogeneous WOCs with manganese,21 copper,22 nickel,23 iron,24 iridium,25 cobalt,26 ruthenium27 and organic molecules28 as the catalytic center have been explored. Among them, molecular ruthenium homogeneous catalysts with 2,2′-bipyridine-6,6′-dicarboxylate (bda2–) as an equatorial ligand (Ru(bda)) are prospective because they show extremely high catalytic water oxidation activity with efficient proton-coupled electron transfer (PCET) and subsequent O–O bond formation.27d In general, high-valence metal oxide species react with water to form an O–O bond, but the water nucleophilic attack (WNA) suffers from the high overpotential associated with the high activation energy. Instead, for Ru(bda), the dinuclear complexation of two RuV O species generated via multiple electron extraction is believed to facilitate O–O bond formation, as seen in nature.29 Overall, a combination of porphyrin as the sensitizer and a ruthenium complex as the WOC is desirable to exploit a highly efficient molecular artificial photosynthetic system.
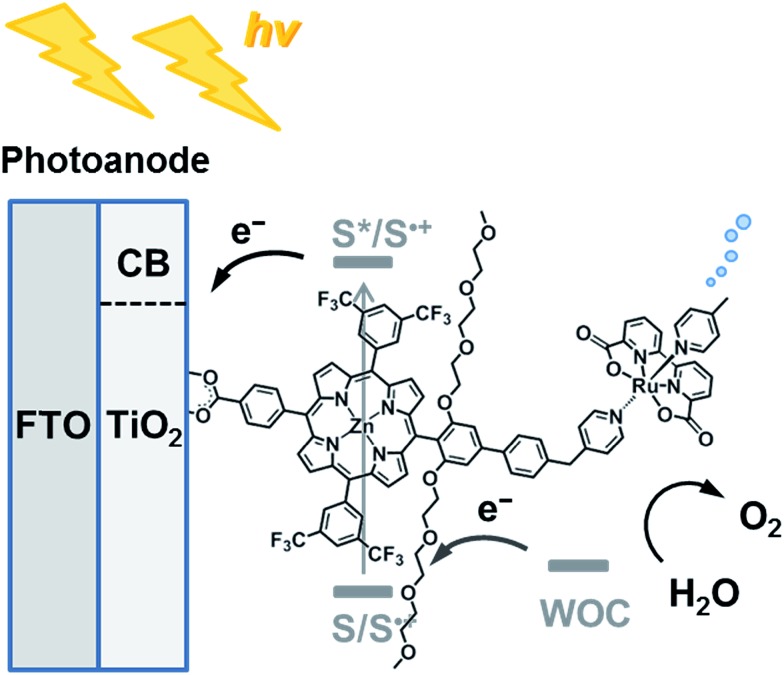
Herein, we report visible light-driven water oxidation using a covalently linked molecule-based porphyrin sensitizer–ruthenium complex WOC dyad, Ru–ZnP, assembled on a TiO2 electrode (Chart 1 and Fig. 1). We expected that the ET directionality would be achieved by assembling the ruthenium catalyst and porphyrin sensitizer on TiO2 through covalent linkage. Namely, (1) upon irradiation of visible light, the porphyrin singlet excited state (1ZnP*) is formed, and (2) electron injection occurs from 1ZnP* to the CB of TiO2 (–0.6 V vs. NHE at pH 7).30 (3) Then, the ET takes place from the ruthenium catalyst to the zinc porphyrin radical cation (ZnP˙+) to generate a one-electron oxidized WOC. (4) After forming high-valent RuV in the WOC via an iterative cycle, water is oxidized to dioxygen.
Chart 1. Schematic diagram of visible light-driven water oxidation using wide-bandgap TiO2 functionalized with a ruthenium water oxidation catalyst–porphyrin linked dyad as the photoanode.
Although several covalently linked sensitizer–WOC dyads have been assembled on semiconducting electrodes, the visible light-driven water splitting efficiency is still not sufficient.10–12,31 We envisioned that a semi-flexible pyridylmethyl-substituted dialkoxybiphenyl bridge between the ZnP and WOC moieties would facilitate the charge-shift from the WOC moiety to ZnP˙+, while suppressing CR from the electron in the CB of TiO2 to the oxidized WOC. Four trifluoromethyl groups were also introduced into the meta-positions of the meso-phenyl groups to realize the high oxidation ability of ZnP˙+ for water oxidation. In this study we have examined the optical, electrochemical, and photoelectrochemical (PEC) properties of Ru–ZnP and its references ZnP-ref and Ru-ref as well as TiO2 electrodes modified with these compounds to verify the utility of our approach.
Experimental section
General
1H and 13C{1H} NMR spectra were recorded using a JEOL AL300 (300 MHz for 1H, 75.5 MHz for 13C) and JEOL ECX-400P (400 MHz for 1H, 99.6 MHz for 13C) spectrometer with CDCl3, CD2Cl2, CD3OD, and THF-d8, and the chemical shifts were noted in δ ppm with reference to the internal tetramethylsilane peak (Si(CH3)4, 0.00 ppm) and internal residual solvent peak (7.27 ppm for CHCl3, 5.30 ppm for CH2Cl2, 3.33 ppm for CH3OH, and 1.72 and 3.58 ppm for THF). Silica gel column chromatography was performed using Silica Gel 60 spherical, neutrality (Nacalai tesque inc.). Alumina column chromatography was carried out using activated alumina (300 mesh, Wako). Thin layer chromatography (TLC) was conducted on aluminium plates coated with silica gel 60 F254 (Merck) or aluminium oxide 60 F254 (Merck). Attenuated total reflectance-Fourier transform infrared (ATR-FTIR) spectra were taken using the golden gate diamond anvil ATR accessory (NICOLET 6700, Thermo scientific), using typically 64 scans at a resolution of 2 cm–1. High-resolution mass spectra (HRMS) were measured using a JEOL JMS-HX110A spectrometer. All reactions were performed under argon.
Optical measurements
Steady-state absorption spectra were measured using a Lambda 900 (Perkin-Elmer) UV/vis/NIR spectrometer with a data interval of 0.5 nm. These spectra were taken with ca. 10–5 to 10–6 M solutions in quartz cells with a path length of 1 cm. Steady-state fluorescence spectra were measured using a FluoroMax-3 (JOBIN YVON, HORIBA) spectrofluorophotometer with a data interval of 1 nm. Time correlated single photon counting was recorded in a 1 cm quartz cell using a HORIBA Jobin Yvon FluoroCube Fluorescence Lifetime System equipped with NanoLEDs and LDs. A Hamamatsu (R3809 U) photomultiplier and a thermoelectrically cooled TBX-04-D detector were used to detect the emitted photons. These spectra were taken with ca. 10–6 M solutions in quartz cells with a path length of 1 cm. Solvents were degassed by bubbling with argon before use.
Electrochemical measurements
Cyclic voltammetry and differential pulse voltammetry measurements were performed on an ALS660A electrochemical analyzer in deaerated sodium phosphate buffered aqueous solution (pH 7.5, 0.1 M), or THF containing 0.1 M tetrabutylammonium hexafluorophosphate (TBAPF6) as the supporting electrolyte. A conventional three-electrode cell was used with a glassy carbon working electrode and a platinum wire as the counter electrode. The measured potentials were recorded with respect to the Ag/AgCl (3 M NaCl aqueous solution) reference electrode for aqueous solutions or the Ag/AgNO3 reference electrode for DMF solutions. Redox potentials in aqueous solution were determined by using the following equation: ENHE = EAg/AgCl + 0.207 V.10f Redox potentials in THF were measured by using the Fc/Fc+ redox potential as the internal reference.
Preparation of the photoanode
TiO2/FTO films were prepared via a screen printing or doctor blade method as previously reported.16c We used a TiO2 paste composed of nanocrystalline TiO2 particles (20 nm, CCIC:PST23NR, JGC-CCIC) for the preparation of the TiO2/FTO films via screen printing. To prepare the working electrodes, the FTO glasses (solar 4 mm thickness, 10 Ω cm–2, Nippon Sheet Glass) were first cleaned in a detergent solution using an ultrasonic bath for 10 min and then rinsed with distilled water and ethanol. After UV-O3 irradiation for 18 min, the FTO glass plates were immersed into a 40 mM aqueous TiCl4 solution at 70 °C for 30 min and washed with distilled water and ethanol. A layer of the nanocrystalline TiO2 paste was coated onto the FTO glass plate through a screen-printing method, kept in a clean box for a few minutes, and then dried over 6 min at 125 °C. This screen-printing procedure with the nanocrystalline TiO2 paste was repeated to reach a thickness of 4, 6, and 12 μm, to optimize the device performance. Finally, the electrodes coated with the TiO2 pastes were gradually heated under airflow at 325 °C for 5 min, 375 °C for 5 min, 450 °C for 15 min, and 500 °C for 15 min. The thickness of the films was determined using a surface profiler (SURFCOM 130A, ACCRETECH). The TiO2/FTO films were treated again with 40 mM TiCl4 solution at 70 °C for 30 min and then rinsed with distilled water and ethanol, sintered at 500 °C for 30 min, and cooled to r.t. before being dipped into the dye solution. The printed area of TiO2 is 1 cm2 (1 × 1 cm). The TiO2/FTO films were immersed into a methanol solution (9 mL) of Ru–ZnP (1.0 × 10⁻⁴ M) at 25 °C for 0.5 to 6 h, and then washed with methanol for the preparation of the Ru–ZnP-stained TiO2/FTO electrode (denoted as Ru–ZnP/TiO2/FTO). The porphyrin surface coverage adsorbed on the TiO2 films (Γ, mol cm–2) was determined by measuring the absorbance of the porphyrin solution that was dissolved from the porphyrin-stained TiO2 film into 0.1 M NaOH solution of a 1 : 1 mixture of THF and water.
Photoelectrochemical measurements
PEC measurements were performed using an ALS660A electrochemical analyzer and a three-electrode electrochemical cell with the Ru–ZnP/TiO2/FTO working electrode, a platinum wire as the counter electrode, and the Ag/AgCl (3 M NaCl aqueous solution) reference electrode. The photocurrent was measured at –0.4 V vs. Ag/AgCl without stirring and without iR compensation.26b A 100 W halogen lamp (MEJIRO PRECISION, PHL-100) was used as a white light source (λ > 380 nm; input power, 35 mW cm–2) for monitoring the photocurrent. A 300 W xenon lamp (Asahi Spectra Co., Ltd., MAX-303) was used as a white light source (λ > 400 nm; input power, 200 mW cm–2) for detecting the oxygen and hydrogen evolution. A 500 W xenon lamp (USHIO, XB-50101AAA) was used for incident photon-to-current efficiency (IPCE) measurement. Monochromatic light through a monochromator (Ritsu, MC-10N) was illuminated on the modified area of the working electrode (0.28 cm2). The light intensity was monitored using an optical power meter (Anritsu, ML9002A) and corrected to calculate the IPCE values.
X-ray photoelectron spectroscopy (XPS)
XPS data were obtained using ULVAC-PHI 5500 MT equipped with a Mg Kα X-ray source (1253.6 eV) and a hemispherical energy analyzer as previously reported.16c The spectra were referenced to the In 3d5/2 peak of indium foil as the internal reference with a binding energy of 443.8 eV, and the signals were fitted using Gaussian functions using the program OriginPro 8.6.
Gas detection
Analytical gas chromatography (GC) was carried out using Shimadzu GC-2014 equipped with a thermal conductivity detector (TCD-2014). A molecular sieve column was used as the stationary phase, and argon gas was employed as the mobile phase. The argon flow rate was 25 mL min–1, and the column temperature was 40 °C. An aliquot of gas in the headspace of the PEC cells after the measurement was delivered to the GC system using a Hamilton SampleLock syringe to quantitatively analyze oxygen and hydrogen evolution. A FireSting Oxygen Monitor (BAS Inc.) was used for the time-course measurement of oxygen evolution. Argon with 1% oxygen was used for calibration.
Synthesis
Ru–ZnP and ZnP-ref were synthesized according to Scheme S1 in the ESI.† Ru(bda)(dmso)2 (ref. 27d) and Ru-ref12b as the reference compound were also prepared according to the literature.
Results and discussion
Synthesis
Covalently-linked ruthenium catalyst–porphyrin dyad Ru–ZnP was synthesized according to Scheme S1 (see ESI†). Spacer moiety 4 was prepared via iridium catalysed direct borylation of 1,32 followed by palladium catalysed cross-coupling of 2 with 4-(4-chlorobenzyl)pyridine33 and subsequent reduction of 3 with LiAlH4 and oxidation with Dess–Martin periodinane (DMP). The acid catalysed condensation of 4 with 4-(methoxylcarbonyl) benzaldehyde and dipyrromethane provided porphyrin 5 in 7% yield. Porphyrin ZnP-ref was obtained via bromination of 5 with N-bromosuccinimide (NBS), followed by Suzuki coupling of 6 with 3,5-bis(trifluoromethyl)phenyl boronic acid14g and subsequent base hydrolysis of 7 and zincation of 8. ZnP-ref was then reacted with in situ generated Ru(bda)(dmso)(pic) (pic = 4-picoline) from Ru(bda)(dmso)2 in a THF/methanol solution at 40 °C to furnish Ru–ZnP in 59% yield. All new compounds were characterized using 1H NMR, 1H–1H COSY, IR, and HRMS (see ESI and Fig. S2 and S3†).
Optical properties
The UV-visible absorption spectra of Ru–ZnP, ZnP-ref and Ru-ref were measured in methanol (Fig. S4†). The Soret and Q bands derived from the porphyrin moiety are evident at 425 and 556 nm. The peak positions and shapes of Ru–ZnP are similar to those of ZnP-ref, indicating that there is little electronic interaction between the porphyrin and ruthenium moieties in the ground state. There is significant absorption from the WOC moiety of Ru–ZnP at 300–400 nm.27d For Ru–ZnP, the porphyrin moiety can be selectively excited at the Soret and Q bands, whereas both the porphyrin and WOC moieties can be excited at 450–530 nm (inset of Fig. S4a†). The fluorescence spectra of Ru–ZnP and ZnP-ref in methanol reveal emission maxima at 605 and 660 nm (Fig. S5a†). From the intersection of the absorption and fluorescence spectra of Ru–ZnP in methanol, the zeroth–zeroth transition energy (E0–0) for the porphyrin moiety is calculated to be 2.06 eV (Table S1†). The E0–0 value of the WOC moiety is reported to be 1.75 eV in alcoholic solution.14b The fluorescence of Ru–ZnP is reduced by 73% compared to that of ZnP-ref. In accordance with this quenching, Ru–ZnP has a fluorescence lifetime of 0.75 ns (Fig. S6†), which is also shortened by 69% in comparison with ZnP-ref (2.43 ns). These results indicate the occurrence of energy transfer (EnT) or ET quenching by the WOC moiety in Ru–ZnP. On the other hand, the fluorescence intensity of the porphyrin moiety in Ru–ZnP is reduced by 23% in THF (Fig. S5b†). As the ET is more affected by the solvent polarity than EnT,34 ET quenching of 1ZnP* by the WOC moiety, rather than the EnT from 1ZnP* to the WOC moiety, is likely to occur in Ru–ZnP (Fig. S1†). However, as electron injection from 1ZnP* to the CB of TiO2 is known to take place in a time scale of 0.1–100 ps,16d–f such intramolecular quenching would not influence the PEC properties significantly.
Electrochemical properties
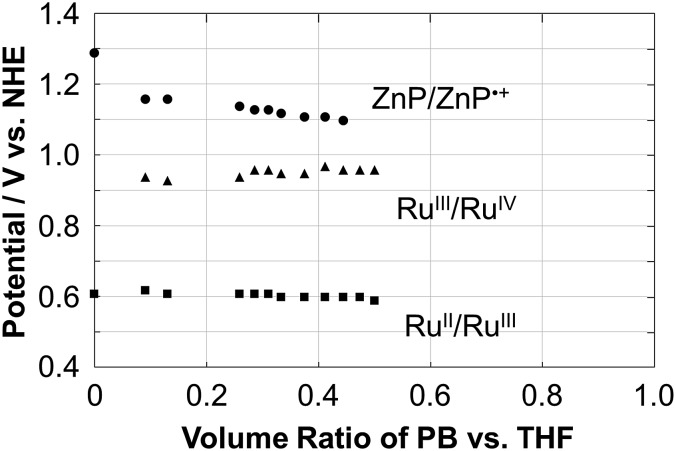
The electrochemical properties of Ru–ZnP were examined using cyclic voltammetry (CV) and differential pulse voltammetry (DPV) measurements in THF with a different volume ratio of sodium phosphate buffered aqueous solution (PB, 20 mM, pH 7.5) containing 0.1 M TBAPF6 as the supporting electrolyte. Ru–ZnP exhibits RuII/III and ZnP/ZnP˙+ peaks at 0.61 V and 1.29 V vs. NHE in THF, respectively (Fig. S7a and Table S1†). On the other hand, in 50% THF aqueous solution (PB/THF, v/v = 1/1) Ru–ZnP shows RuII/III and RuIII/IV peaks at 0.60 V and 0.96 V vs. NHE, respectively, while the ZnP/ZnP˙+ peak disappears (Fig. S7d†). To further shed light on the electrochemical behavior, we investigated the effect of the solvent polarity on the redox potentials (Fig. 2). With an increase in the solvent polarity (i.e., increasing a volume ratio of PB in the PB/THF mixture), the redox potential for ZnP/ZnP˙+ is shifted in the negative direction from 1.29 V to 1.10 V vs. NHE. With an increase in the solvent polarity, the ZnP moiety is oxidized more easily due to the coulombic interaction. In contrast, both the redox potentials for RuII/III (ca. 0.60 V vs. NHE) and RuIII/IV (ca. 0.95 V vs. NHE) are almost constant owing to the blocking effect of the ligands on Ru metal against the surrounding solvents.27d This relationship implies that the use of a more hydrophobic environment around the sensitizer is beneficial for ensuring the higher oxidation potential of the molecular sensitizer in DSPECs, which is a prerequisite for efficient water oxidation. In fact, the cyclic voltammogram of Ru–ZnP in 50% THF aqueous solution shows a significant catalytic current arising from water oxidation at an applied potential of >1.2 V vs. NHE. The catalytic onset is higher than that of typical Ru(bda) catalysts under homogeneous conditions, due to the predominant occurrence of WNA on high-valent RuV species over their radical coupling.35
Fig. 2. Plots of the redox potential (V vs. NHE) of ZnP/ZnP˙+ (circle), RuIII/V (triangle) and RuII/III (square) as a function of the volume ratio of the PB/THF mixture for Ru–ZnP. The ratio was changed from 0 to 0.5. The electrochemical measurements for ratios >0.5 were unable to be conducted due to the aggregation in the mixed solvent.
Preparation of the photoanodes
The choice of an immersion solvent for dye adsorption on a semiconducting electrode is crucial for dye-sensitized solar cells (DSSCs). In particular, in DSSCs with porphyrin sensitizers, the use of protic solvents including methanol and ethanol as the immersion solvent are reported to be effective at achieving high device performance.16b Since this seems to be the same as DSPECs,7b,7c methanol was employed as the immersion solvent for immobilization of Ru–ZnP on a TiO2/FTO electrode. A full surface coverage (Γ) of Ru–ZnP on TiO2/FTO with a TiO2 thickness of 12 μm is attainable within 2 h, which is used for further measurements (Fig. S8†).
Fig. S9† displays the UV-visible absorption spectra of the TiO2/FTO electrode modified with Ru–ZnP. The Q bands of the porphyrin moiety in Ru–ZnP/TiO2/FTO are red-shifted and broadened compared to those of Ru–ZnP in PB/methanol (v/v = 1/1), suggesting considerable intermolecular interactions among the Ru–ZnP molecules on TiO2/FTO. By using Meyer's method,36 the full Γ values of Ru–ZnP and ZnP-ref on TiO2/FTO with a TiO2 thickness of 12 μm were calculated to be 7.1 × 10⁻⁸ mol cm–2 and 9.5 × 10⁻⁸ mol cm–2, respectively. These values largely agreed with the corresponding ones of 9.5 × 10⁻⁸ mol cm–2 for Ru–ZnP/TiO2/FTO and 1.0 × 10⁻⁷ mol cm–2 for ZnP-ref/TiO2/FTO, which were obtained by desorbing Ru–ZnP and ZnP-ref from the electrodes under basic conditions.16b,c Considering the surface area of mesoporous TiO2 (68 m2 g–1) and the Γ values obtained via dye desorption, the corrected Γ values were determined to be 7.9 × 10⁻¹¹ mol cm–2 for Ru–ZnP and 8.3 × 10⁻¹¹ mol cm–2 for ZnP-ref. These values correspond to an occupied area per molecule of 2.0–2.1 nm2 on TiO2/FTO. Assuming that Ru–ZnP and ZnP-ref are densely packed on TiO2/FTO with a perpendicular orientation, they occupy ca. 1.8 nm2, which is largely consistent with the experimental values. The first oxidation potential (Eox1) of the ZnP moiety in Ru–ZnP/TiO2/FTO and ZnP-ref/TiO2/FTO is 1.00 V vs. NHE, which is determined via DPV measurement in PB (0.1 M, pH 7.3) (Fig. S10†). Thus, the oxidation potential of the ZnP moiety on TiO2/FTO is shifted in the negative direction by ca. 0.3 V as compared to that in THF. This may be due to the highly hydrophilic environment as well as the intermolecular interaction of the ZnP moieties on TiO2/FTO (vide supra). The RuII/III peak originating from the WOC moiety appears at 0.63 V vs. NHE.
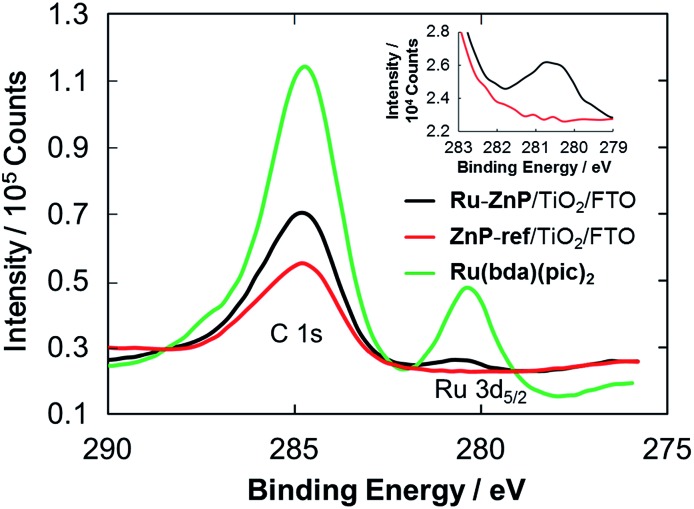
XPS spectra of the photoanodes were measured to characterize the immobilization of Ru–ZnP on TiO2/FTO. The XPS spectrum of the Ru(bda)(pic)2 solid shows a peak for Ru 3d5/2 with a binding energy (BE) of 280.5 eV (Fig. 3 and S11†). The XPS spectrum of ZnP-ref/TiO2/FTO does not reveal any peak around 280 eV, verifying the assignment. On the other hand, Ru–ZnP/TiO2/FTO shows the peak stemming from Ru 3d5/2, although it is overlapped with a C 1s peak (Fig. 3). The presence of zinc (BE = 1021.2 eV) and fluorine (BE = 688.3 eV) atoms is evident for Ru–ZnP/TiO2/FTO (Fig. S12b and c†). The FTIR spectrum of the Ru–ZnP solid reveals the characteristic bands arising from ν(C O) of the carboxylic acid groups at around 1700 cm–1 (Fig. S13†). This diagnostic disappears for the FTIR spectrum of Ru–ZnP/TiO2/FTO. The FTIR spectrum exhibits a significant increase in the symmetric carboxylate band, ν(COOsym–), at 1400 cm–1 and asymmetric carboxylate band, ν(COOasym–), at around 1650 cm–1. This corroborates that a proton is detached from the carboxylic acid group during adsorption, leading to the bidentate binding of the carboxylic group on TiO2/FTO.16b,c
Fig. 3. C 1s and Ru 3d5/2 XPS spectra of Ru–ZnP/TiO2/FTO (black), ZnP-ref/TiO2/FTO (red) and Ru(bda)(pic)2 (green). Inset is the magnified spectra of Ru–ZnP/TiO2/FTO (black) and ZnP-ref/TiO2/FTO (red) for the Ru 3d5/2 region.
Photoelectrochemical properties
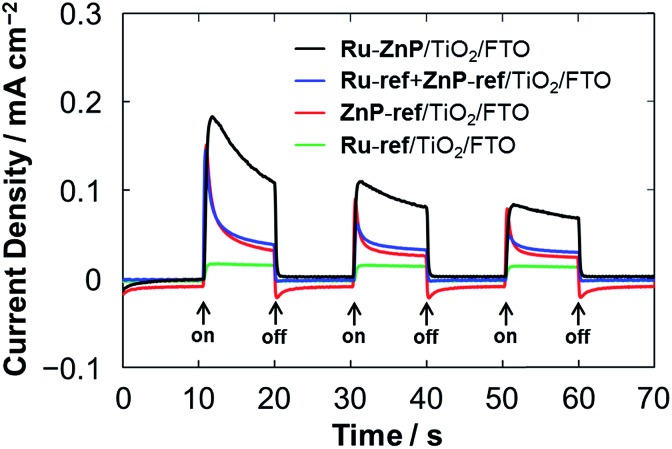
From the optical and electrochemical measurements, the energy levels of Ru–ZnP/TiO2/FTO are determined (Fig. 1). The driving force for the electron injection from 1ZnP* to the CB of TiO2 (–ΔGinj) is 0.5 eV, which is sufficient for efficient ET. This is in sharp contrast to previous work with coadsorption of a porphyrin sensitizer and WOC on TiO2 where the low electron injection efficiency (φinj) from the free base porphyrin excited singlet state to the CB of TiO2 limits the overall device performance of the DSPEC.9a The PEC properties were evaluated by using a standard three-electrode DSPEC. An I–V curve of the Ru–ZnP/TiO2/FTO electrode under irradiation shows that the photocurrent density reaches its maximum of 0.13 mA cm–2 at an external bias of –0.2 V vs. NHE (Fig. S14†). The PEC responses of the anode electrodes were compared at the bias of –0.2 V vs. NHE (Fig. 4). The photocurrent of the Ru–ZnP/TiO2/FTO electrode is enhanced compared to those of the reference anodes prepared via coadsorption of ZnP-ref and Ru-ref12b (denoted as Ru-ref + ZnP-ref/TiO2/FTO, Ru-ref : ZnP-ref = 1 : 1) and adsorption of ZnP-ref as well as of Ru-ref on TiO2/FTO. As previously reported,9a,9c the ZnP moiety of Ru–ZnP exhibits irreversible anodic peaks in the CV measurements under aqueous environments (Fig. S7b–d†), implying the instability of ZnP˙+ under aqueous conditions. In the case of the Ru–ZnP/TiO2/FTO electrode, the photogenerated ZnP˙+ can be rapidly quenched via ET from the nearby WOC with the help of the covalent linkage, exhibiting enhanced photocurrent generation relative to the reference electrodes. In other words, the lower performance of the Ru-ref + ZnP-ref/TiO2/FTO electrode is probably due to slow intermolecular ET from the WOC to ZnP˙+. This result demonstrates the advantage of the suitable covalent linkage between the sensitizer and WOC on TiO2/FTO for visible light-driven water oxidation.
Fig. 4. PEC responses of the Ru–ZnP/TiO2/FTO (black), Ru-ref + ZnP-ref/TiO2/FTO (blue), ZnP-ref/TiO2/FTO (red) and Ru-ref/TiO2/FTO (green) electrodes under white light illumination (Win = 35 mW cm–2, λ > 380 nm). The freshly prepared photoanodes with a TiO2 thickness of 12 μm were employed for the measurements. Conditions: external bias: –0.2 V vs. NHE, electrolyte: PB (0.1 M, initial pH 7.3).
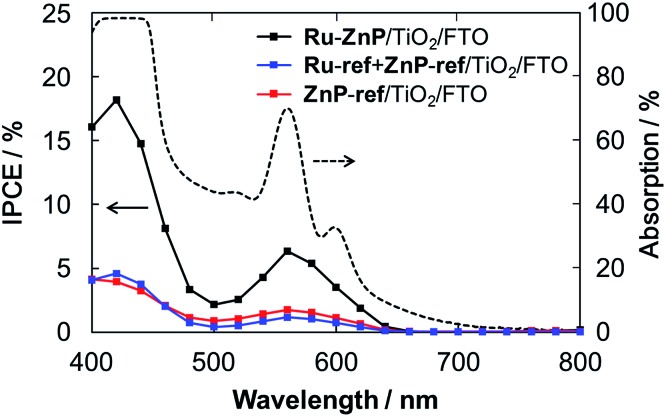
To gain further insight into the PEC properties of the anode electrodes, we evaluated the wavelength dependent IPCE spectra. The IPCE was calculated by normalizing the photocurrent density for the incident light energy and intensity and by using eqn (1):
| IPCE = 100 × 1240 × I/(Win × λ) | 1 |
where I is the photocurrent density (A cm–2), Win is the incident light intensity (W cm–2), and λ is the excitation wavelength (nm). IPCE is divided into three components in the following eqn (2):
| IPCE = LHE × φinj × ηcol | 2 |
where the LHE (light-harvesting efficiency) is the number of absorbed photons per incident photons and ηcol is the charge collection efficiency after electron injection.37
The TiO2 thickness was altered from 12 μm to 4 μm to optimize the IPCE. The Ru-ref + ZnP-ref/TiO2/FTO electrode with a thickness of 6 μm gave the highest device performance with an IPCE of 18% at 424 nm (Fig. S15a† and Table 1). Fig. 5 depicts the photocurrent action spectra of the Ru–ZnP/TiO2/FTO, Ru-ref + ZnP-ref/TiO2/FTO and ZnP-ref/TiO2/FTO electrodes under the optimized conditions. The photocurrent action spectra largely resemble the corresponding absorption spectra (Fig. S9b†). The IPCE and absorbed photon-to-current efficiency (APCE) values at the Q bands are considerably lower than those at the Soret band. First, the LHEs at >450 nm are smaller than those at the Soret band. Because the LHEs at >450 nm do not reach unity, incident photons in the region tend to be absorbed by the sensitizer on the TiO2 film further away from the bottom of the FTO electrode depending on the molar absorption coefficient at each wavelength. Accordingly, the injected electron in the CB of TiO2 would travel a longer distance through the network of the TiO2 nanoparticles to reach the FTO, thereby leading to an increase in significant CR and a decrease in ηcol. Considering the plausible similar φinj values at different wavelengths, the low LHE and ηcol at the Q bands rationalize the difference. There is a significant depletion of the IPCE values at around 500 nm relative to the absorption spectrum. The excitation ratio of WOC : ZnP (ca. 1 : 1) at 460–520 nm is much larger than at the other wavelengths. The direct excitation of the WOC moiety may be responsible for the lower IPCE values because of the rapid decay of the excited state to the ground state within a few tens of picoseconds.14b From these considerations, the use of sensitizers with a larger molar absorption coefficient in the visible region as well as thinner TiO2 films is needed to further improve the IPCE value.
Table 1. IPCE and APCE of the photoanodes a , b .
| Photoanode | IPCE/% |
APCE/% |
||
| 424 nm | 564 nm | 424 nm | 564 nm | |
| Ru–ZnP/TiO2/FTO | 18 (17 ± 1) | 6.4 (5.9 ± 0.5) | 18 (17 ± 1) | 9.2 (8.5 ± 0.7) |
| Ru-ref + ZnP-ref/TiO2/FTO | 4.6 (3.0 ± 1.6) | 1.2 (0.8 ± 0.4) | 5.0 (3.3 ± 0.7) | 1.7 (1.1 ± 0.6) |
| ZnP-ref/TiO2/FTO | 3.8 (2.9 ± 0.9) | 1.8 (1.4 ± 0.4) | 3.9 (3.0 ± 0.9) | 2.5 (1.9 ± 0.6) |
a W in = 0.108 mW cm–2 at 424 nm, Win = 0.262 mW cm–2 at 564 nm; active area: 0.28 cm2; external bias: –0.2 V vs. NHE. TiO2 thickness: 6 μm.
bValues correspond to the highest ones. Values in parentheses denote an average one from at least three independent experiments.
Fig. 5. Photocurrent action spectra of the Ru–ZnP/TiO2/FTO (black), Ru-ref + ZnP-ref/TiO2/FTO (blue) and ZnP-ref/TiO2/FTO electrodes (red) with a TiO2 thickness of 6 μm. Dashed line depicts the light-harvesting efficiency of the Ru–ZnP/TiO2/FTO electrode. Conditions: external bias: –0.2 vs. NHE, electrolyte: PB (0.1 M, initial pH 7.3); and scan rate: 2 nm s–1 from 400 nm to 800 nm.
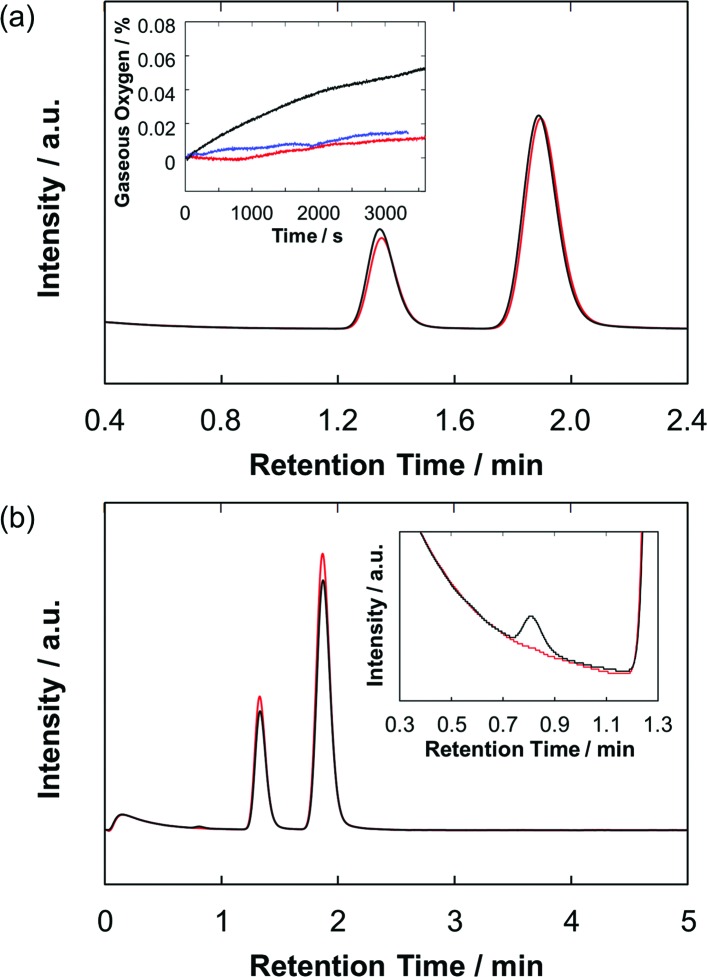
To verify water oxidation using the photoanodes, both the O2 and H2 evolutions during the PEC operation were monitored quantitatively by using gas chromatography and an oxygen sensor (Fig. 6). For the ZnP-ref/TiO2/FTO electrode, almost no oxygen and hydrogen were detected during the PEC experiment. On the other hand, the Ru–ZnP/TiO2/FTO electrode shows 8.5 nmol of O2 evolution under the same condition with a faradaic efficiency of 33% after 1 h of PEC operation. At the same time the Ru–ZnP/TiO2/FTO electrode reveals 41 nmol of H2 evolution at the cathode side with a faradaic efficiency of 77%. A turnover number (TON) of 6 for H2 evolution and a TON of 1.3 for O2 evolution are obtained.
Fig. 6. Gas chromatograms showing the evolved gases in (a) the anode and (b) the cathode compartments of the Ru–ZnP/TiO2/FTO (black) electrode and background (red) after 1 hour of PEC operation. Peaks with retention times of 0.8 min, 1.3–1.4 min, and 1.9 min are attributed to hydrogen, oxygen, and nitrogen, respectively. Inset in (a) shows the time course of oxygen evolution monitored using an oxygen sensor for the Ru–ZnP/TiO2/FTO (black) and ZnP-ref/TiO2/FTO (red) electrodes and background (blue). Conditions: TiO2 thickness = 6 μm; external bias: 0 V vs. NHE; and electrolyte: PB (0.1 M, initial pH 7.0).
Characterization of the photoanodes after PEC operation
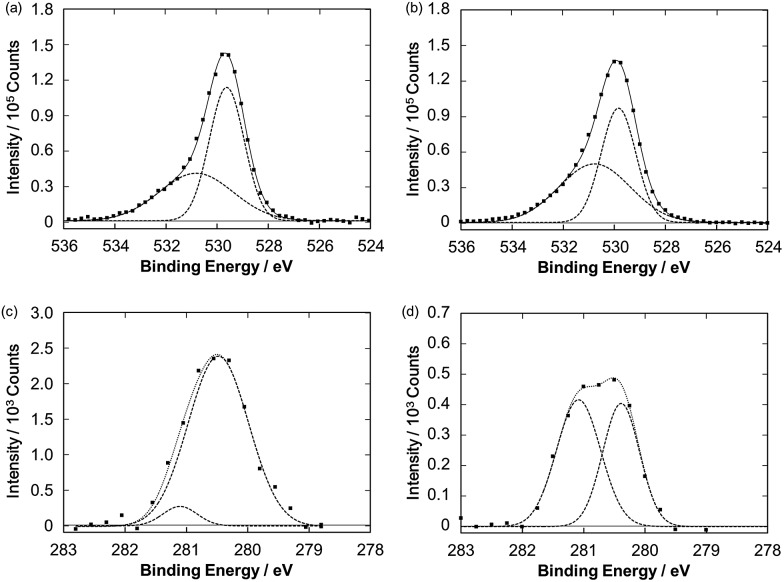
Fig. 4 also illustrates a gradual drop in the photocurrent intensity of the Ru–ZnP/TiO2/FTO electrode. In fact, in the photocurrent action spectra, with repeating the wavelength scans from 400 nm to 800 with a scan rate of 2 nm s–1, the IPCE values decrease gradually, reaching half of the initial value (Fig. S15b†). These indicate the degradation and/or chemical change of the photoanodes. Surprisingly, no significant change is observed for the UV-vis spectra of the Ru–ZnP/TiO2/FTO electrodes before and after 60 min of the PEC operation (Fig. S9c†). The IR absorption characteristics of the bidentate carboxylate at around 1400 and 1650 cm–1 remain even after the PEC operation (Fig. S13†), supporting the robust binding of Ru–ZnP on TiO2/FTO. These results do not contradict the XPS results (Fig. 7a and b). The O 1s XPS spectra of the Ru–ZnP/TiO2/FTO electrodes before and after the PEC operation are largely similar. They show two peaks at 530.8 eV and 529.7 eV, which can be assigned to the oxygen atoms of Ru–ZnP and TiO2. Although the dye desorption from TiO2 is reported to be one of the major reasons for photocurrent depletion,11b,38 the ZnP moiety in this study is found to strongly bind to TiO2 even after long-term illumination. This is in stark contrast to RuP where even two phosphonates as anchoring groups are not sufficient for tight anchoring to TiO2 under visible light illumination at neutral to high pH.39,40 Therefore, the degradation or chemical change of the ZnP moiety can be ruled out. To further search the reason for photocurrent depletion, we performed Ru 3d5/2 XPS measurements for the Ru–ZnP/TiO2/FTO electrodes before and after the PEC operation. They are fitted by two peaks with BEs of 280.5 eV and 281.1 eV (Fig. 7c and d). The former can be assigned to the Ru(bda) catalyst moiety (Fig. 3), whereas the latter is assigned to the ruthenium center with higher oxidation states (i.e., RuIII, RuIV).41,42 It is notable that the ratio of the higher oxidation species is dramatically increased after the PEC operation, implying the accumulation of the higher oxidation species on TiO2/FTO.
Fig. 7. O 1s XPS spectra of the Ru–ZnP/TiO2/FTO electrodes (a) before and (b) after the PEC operation. Ru 3d5/2 XPS spectra of the Ru–ZnP/TiO2/FTO electrodes (c) before and (d) after the PEC operation.
As the IPCE is high during the early stage of illumination (Fig. S15b†), the photoinduced first ET sequence starting from 1ZnP* would take place efficiently. That is, ZnP excitation (eqn (3)) is followed by electron injection to the CB of TiO2 (eqn (4)), and intramolecular charge-shift from the WOC moiety to ZnP˙+ to afford RuIII–ZnP/TiO2(e–) (eqn (5)).
| RuII–ZnP/TiO2 + hv → RuII–1ZnP*/TiO2 | 3 |
| RuII–1ZnP*/TiO2 → RuII–ZnP˙+/TiO2(e–) | 4 |
| RuII–ZnP˙+/TiO2(e–) → RuIII–ZnP/TiO2(e–) | 5 |
The latter must compete with CR (eqn (6)), but the vectorially oriented covalently-linked dyad on TiO2 by the order of WOC, ZnP, and TiO2 suppresses the process.
| RuII–ZnP˙+/TiO2(e–) → RuII–ZnP/TiO2 | 6 |
The generated RuIII–ZnP/TiO2(e–) species can be regarded as a distant hole–electron pair, and therefore, the CR process (eqn (7)) is slow enough to eventually reduce protons at the counter electrode (eqn (8)).10f
| RuIII–ZnP/TiO2(e–) → RuII–ZnP/TiO2 | 7 |
| RuIII–ZnP/TiO2(e–) + H+ → RuIII–ZnP/TiO2 + 1/2H2 | 8 |
On the other hand, as the oxidation potential (1.0 V vs. NHE) of the ZnP moiety in an aqueous environment (Fig. S7†) is insufficient to oxidize the ruthenium center with the higher oxidation state via multistep PCET, the photocurrent generation by the Ru–ZnP/TiO2/FTO electrode at the later stage of illumination is not enhanced remarkably compared to that of the ZnP-ref/TiO2/FTO electrode. Indeed, XPS analysis shows the accumulation of the higher oxidation states of the ruthenium complex during the PEC operation. This would slow down the second and third PCET from the RuIII and RuIV species to ZnP˙+, resulting in the low TOF for oxygen evolution. This accumulation rationalizes the observed photocurrent depletion. The catalytic onset is higher than typical Ru(bda) catalysts in solutions, indicating that the radical coupling by the assembly is unlikely to occur on the surface; a WNA mechanism may be dominant in this system.12a A significant photocurrent generation without oxygen evolution for the ZnP-ref/TiO2/FTO electrode may be due to the direct bandgap excitation of TiO2 under the present conditions as well as the electrochemical degradation of the chromophore unit.43
Conclusions
A covalently-linked ruthenium-based water oxidation catalyst–porphyrin sensitizer dyad was assembled on a TiO2 electrode for visible-light driven water oxidation. Efficient vectorial ET was achieved by using the dyad on TiO2 with a broad IPCE response at longer wavelengths (up to 620 nm) compared to conventional ruthenium-based sensitizers. Initial incident photon-to-current efficiencies of 18% at 424 nm and 6.4% at 564 nm were attained under monochromatic illumination and an external bias of –0.2 V vs. NHE. The DSPEC performance was better than the reference systems with coadsorption of individual Ru(bda) and ZnP as well as with ZnP solely, corroborating the advantage of the covalent linking approach over the noncovalent one. The wavelength dependence of IPCE in the visible region indicates that a lower molar absorption coefficient of the ZnP moiety and the excitation of the Ru(bda) moiety lowers the IPCE as a result of the lower charge collection efficiency and the rapid decay of the Ru(bda) excited state to the ground state. XPS analysis of the photoanodes before and after the DSPEC operation suggests the accumulation of the RuIII and RuIV states in the WOC moiety after the operation, due to the insufficient oxidizing power of the ZnP radical cation, thereby deteriorating the catalytic activity. Accordingly, efficient water oxidation with the covalently-linked dyad may be achieved by tailoring the sensitizer with a higher molar extinction coefficient in the visible region and a higher oxidation potential under aqueous environments (>1.2 V vs. NHE at pH 7) as well as a more flexible structure for facilitating radical coupling mechanisms. In this context, porphyrins are still highly promising for the construction of efficient DSPECs, since their photophysical and electrochemical functions can be modulated via well-tailored molecular design.
Supplementary Material
Acknowledgments
This work was supported by a Grant-in-Aid (25220801 to H.I. and 14J03432 to M.Y.), the WPI Initiative of MEXT (Japan), the Swedish Energy Agency, and the Swedish Research Council. We thank Dr Sho Fujii and Dr Lele Duan for their helpful discussion, and Dr. Yuta Takano and Dr. Hirotaka Nakatsuji for their technical supports. M.Y. is grateful for a JSPS Fellowship for Young Scientists.
Footnotes
†Electronic supplementary information (ESI) available: Steady-state absorption and emission, fluorescence lifetime, cyclic voltammetry, differential pulse voltammetry, and NMR data of the ZnP reference and Ru–ZnP assembly; absorption, differential pulse voltammetry, XPS, and voltage–current data of the photoanodes. See DOI: 10.1039/c5sc03669k
References
- Concepcion J. J., House R. L., Papanikolas J. M., Meyer T. J. Proc. Natl. Acad. Sci. U. S. A. 2012;109:15560–15564. doi: 10.1073/pnas.1212254109. [DOI] [PMC free article] [PubMed] [Google Scholar]
- Morris A. J., Meyer G. J., Fujita E. Acc. Chem. Res. 2009;42:1983–1994. doi: 10.1021/ar9001679. [DOI] [PubMed] [Google Scholar]
- Hammarström L., Hammes-Schiffer S. Acc. Chem. Res. 2009;42:1859–1860. doi: 10.1021/ar900267k. [DOI] [PubMed] [Google Scholar]
- Berardi S., Drouet S., Francàs L., Gimbert-Suriñach C., Guttentag M., Richmond C., Stoll T., Llobet A. Chem. Soc. Rev. 2014;43:7501–7519. doi: 10.1039/c3cs60405e. [DOI] [PubMed] [Google Scholar]
- Swierk J. R., Mallouk T. E. Chem. Soc. Rev. 2013;42:2357–2387. doi: 10.1039/c2cs35246j. [DOI] [PubMed] [Google Scholar]
- (a) Li F., Fan K., Xu B., Gabrielsson E., Daniel Q., Li L., Sun L. J. Am. Chem. Soc. 2015;137:9153–9159. doi: 10.1021/jacs.5b04856. [DOI] [PubMed] [Google Scholar]; (b) Fan K., Li F., Wang L., Daniel Q., Gabrielsson E., Sun L. Phys. Chem. Chem. Phys. 2014;16:25234–25240. doi: 10.1039/c4cp04489d. [DOI] [PubMed] [Google Scholar]
- Co-adsorption with RuP: ; (a) Swierk J. R., McCool N. S., Mallouk T. E. J. Phys. Chem. C. 2015;119:13858–13867. [Google Scholar]; (b) Swierk J. R., McCool N. S., Saunders T. P., Barber G. D., Strayer M. E., Vargas-Barbosa N. M., Mallouk T. E. J. Phys. Chem. C. 2014;118:17046–17053. [Google Scholar]; (c) Swierk J. R., McCool N. S., Saunders T. P., Barber G. D., Mallouk T. E. J. Am. Chem. Soc. 2014;136:10974–10982. doi: 10.1021/ja5040705. [DOI] [PubMed] [Google Scholar]; (d) Zhao Y., Swierk J. R., Megiatto Jr J. D., Sherman B., Youngblood W. J., Qin D., Lentz D. M., Moore A. L., Moore T. A., Gust D., Mallouk T. E. Proc. Natl. Acad. Sci. U. S. A. 2012;109:15612–15616. doi: 10.1073/pnas.1118339109. [DOI] [PMC free article] [PubMed] [Google Scholar]
- (a) Gao Y., Zhang L., Ding X., Sun L. Phys. Chem. Chem. Phys. 2014;16:12008–12013. doi: 10.1039/c3cp55204g. [DOI] [PubMed] [Google Scholar]; (b) Zhang L., Gao Y., Ding X., Yu Z., Sun L. ChemSusChem. 2014;7:2801–2804. doi: 10.1002/cssc.201402561. [DOI] [PubMed] [Google Scholar]; (c) Gao Y., Ding X., Liu J., Wang L., Lu Z., Li L., Sun L. J. Am. Chem. Soc. 2013;135:4219–4222. doi: 10.1021/ja400402d. [DOI] [PubMed] [Google Scholar]
- Co-adsorption with porphyrin sensitizer: ; (a) Swierk J. R., Méndez-Hernández D. D., McCool N. S., Liddell P., Terazono Y., Pahk I., Tomlin J. J., Oster N. V., Moore T. A., Moore A. L., Gust D., Mallouk T. E. Proc. Natl. Acad. Sci. U. S. A. 2015;112:1681–1686. doi: 10.1073/pnas.1414901112. [DOI] [PMC free article] [PubMed] [Google Scholar]; (b) Moore G. F., Konezny S. J., Song H.-e., Milot R. L., Blakemore J. D., Lee M. L., Batista V. S., Schmutternmaer C. A., Crabtree R. H., Brudvig G. W. J. Phys. Chem. C. 2012;116:4892–4902. [Google Scholar]; (c) Moore G. F., Blakemore J. D., Milot R. L., Hull J. F., Song H., Cai L., Schmuttenmaer C. A., Crabtree R. H., Brudvig G. W. Energy Environ. Sci. 2011;4:2389–2392. [Google Scholar]
- Adsorption of WOC–RuP assembly: ; (a) Alibabaei L., Sherman B. D., Norris M. R., Brennaman M. K., Meyer T. J. Proc. Natl. Acad. Sci. U. S. A. 2015;112:5899–5902. doi: 10.1073/pnas.1506111112. [DOI] [PMC free article] [PubMed] [Google Scholar]; (b) Bettis S. E., Ryan D. M., Gish M. K., Alibabaei L., Meyer T. J., Waters M. L., Papanikolas J. M. J. Phys. Chem. C. 2014;118:6029–6037. [Google Scholar]; (c) Bettis S. E., Hanson K., Wang L., Gish M. K., Concepcion J. J., Fang Z., Meyer T. J., Papanikolas J. M. J. Phys. Chem. A. 2014;118:10301–10308. doi: 10.1021/jp411139j. [DOI] [PubMed] [Google Scholar]; (d) Ding X., Gao Y., Zhang L., Yu Z., Liu J., Sun L. ACS Catal. 2014;4:2347–2350. [Google Scholar]; (e) Xiang X., Fielden J., Rodríguez-Córdoba W., Huang Z., Zhang N., Luo Z., Musaev D., Lian T., Hill C. J. Phys. Chem. C. 2013;117:918–926. [Google Scholar]; (f) Alibabaei L., Brennaman M. K., Norris M. R., Kalanyan B., Song W. J., Losego M. D., Concepcion J. J., Binstead R. A., Parsons G. N., Meyer T. J. Proc. Natl. Acad. Sci. U. S. A. 2013;110:20008–20013. doi: 10.1073/pnas.1319628110. [DOI] [PMC free article] [PubMed] [Google Scholar]; (g) Hanson K., Torelli D. A., Vannucci A. K., Brennaman M. K., Luo H., Alibabaei L., Song W., Ashford D. L., Norris M. R., Glasson C. R. K., Concepcion J. J., Meyer T. J. Angew. Chem., Int. Ed. 2012;51:12782–12785. doi: 10.1002/anie.201206882. [DOI] [PubMed] [Google Scholar]; (h) Youngblood W. J., Lee S.-H. A., Kobayashi Y., Hernandez-Pagan E. A., Hoertz P. G., Moore T. A., Moore A. L., Gust D., Mallouk T. E. J. Am. Chem. Soc. 2009;131:926–927. doi: 10.1021/ja809108y. [DOI] [PubMed] [Google Scholar]
- WOC on Nafion: ; (a) Li L., Duan L., Xu Y., Gorlov M., Hagfeldt A., Sun L. Chem. Commun. 2010;46:7307–7309. doi: 10.1039/c0cc01828g. [DOI] [PubMed] [Google Scholar]; (b) Brimblecombe R., Koo A., Dismukes G. C., Swiegers G. F., Spiccia L. J. Am. Chem. Soc. 2010;132:2892–2394. doi: 10.1021/ja910055a. [DOI] [PubMed] [Google Scholar]
- WOC–RuP assembly by polymerization: ; (a) Ashford D. L., Sherman B. D., Binstead R. A., Templeton J. L., Meyer T. J. Angew. Chem., Int. Ed. 2015;54:4778–4781. doi: 10.1002/anie.201410944. [DOI] [PubMed] [Google Scholar]; (b) Li F., Fan K., Wang L., Daniel Q., Duan L., Sun L. ACS Catal. 2015;5:3786–3790. [Google Scholar]; (c) Ashford D. L., Lapides A. M., Vannucci A. K., Hanson K., Torelli D. A., Harrison D. P., Templeton J. L., Meyer T. J. J. Am. Chem. Soc. 2014;136:6578–6581. doi: 10.1021/ja502464s. [DOI] [PubMed] [Google Scholar]
- (a) Gillaizeau-Gauthier I., Odobel F., Alebbi M., Argazzi R., Costa E., Bignozzi C. A., Qu P., Meyer G. J. Inorg. Chem. 2001;40:6073–6079. doi: 10.1021/ic010192e. [DOI] [PubMed] [Google Scholar]; (b) Kalyanasundaram K. Coord. Chem. Rev. 1982;46:159–244. [Google Scholar]
- WOC–sensitizer assembly for homogeneous water oxidation: ; (a) Li H., Li F., Zhang B., Zhou X., Yu F., Sun L. J. Am. Chem. Soc. 2015;137:4332–4335. doi: 10.1021/jacs.5b01924. [DOI] [PubMed] [Google Scholar]; (b) Wang L., Mirmohades M., Brown A., Duan L., Li F., Daniel Q., Lomoth R., Sun L., Hammarström L. Inorg. Chem. 2015;54:2742–2751. doi: 10.1021/ic502915r. [DOI] [PubMed] [Google Scholar]; (c) Gao Y., Duan L., Yu Z., Ding X., Sun L. Faraday Discuss. 2014;176:225–232. doi: 10.1039/c4fd00127c. [DOI] [PubMed] [Google Scholar]; (d) Kohler L., Kaveevivitchai N., Zong R., Thummel R. P. Inorg. Chem. 2014;53:912–921. doi: 10.1021/ic4022905. [DOI] [PubMed] [Google Scholar]; (e) Norris M., Concepcion J. J., Fang Z., Templeton J. L., Meyer T. J. Angew. Chem., Int. Ed. 2013;52:13580–13583. doi: 10.1002/anie.201305951. [DOI] [PubMed] [Google Scholar]; (f) Li F., Jiang Y., Zhang B., Huang F., Gao Y., Sun L. Angew. Chem., Int. Ed. 2012;51:2417–2420. doi: 10.1002/anie.201108051. [DOI] [PubMed] [Google Scholar]; (g) Vagnini M. T., Smeigh A. L., Blakemore J. D., Eaton S. W., Schley N. D., D'Souza F., Crabtree R. H., Brudvig G. W., Co D. T., Wasielewski M. R. Proc. Natl. Acad. Sci. U. S. A. 2012;109:15651–15656. doi: 10.1073/pnas.1202075109. [DOI] [PMC free article] [PubMed] [Google Scholar]; (h) Ashford D. L., Stewart D. J., Meyer T. J. Inorg. Chem. 2012;51:6428–6430. doi: 10.1021/ic300061u. [DOI] [PubMed] [Google Scholar]; (i) Kaveevivitchai N., Thummel R. P. J. Am. Chem. Soc. 2012;134:10721–10724. doi: 10.1021/ja300797g. [DOI] [PubMed] [Google Scholar]; (j) Karlsson E. A., Lee B.-L., Åkermark T., Johnston E. V., Kärkäs M. D., Sun J., Hansson Ö., Bäckvall J.-E., Åkermark B. Angew. Chem., Int. Ed. 2011;50:11715–11718. doi: 10.1002/anie.201104355. [DOI] [PubMed] [Google Scholar]; (k) Borgström M., Shaikh N., Johansson O., Anderlund M. F., Styring S., Åkermark B., Magnuson A., Hammarström L. J. Am. Chem. Soc. 2005;127:17504–17515. doi: 10.1021/ja055243b. [DOI] [PubMed] [Google Scholar]; (l) Huang P., Magnuson A., Lomoth R., Abrahamsson M., Tamm M., Sun L., van Rotterdam B., Park J., Hammarström L., Åkermark B., Styring S. J. Inorg. Biochem. 2002;91:159–172. doi: 10.1016/s0162-0134(02)00394-x. [DOI] [PubMed] [Google Scholar]; (m) Sun L., Raymond M., Magnuson A. K., LeGourriérec D., Tamm M., Abrahamsson M., Kenéz P. H., Martensson J., Stenhagen G., Hammarström L., Styring S., Åkermark B. J. Inorg. Biochem. 2000;78:15–22. doi: 10.1016/s0162-0134(99)00200-7. [DOI] [PubMed] [Google Scholar]
- Inoue H., Shimada T., Kou T., Nabetani Y., Masui D., Takagi S., Tachibana H. ChemSusChem. 2011;4:173–179. doi: 10.1002/cssc.201000385. [DOI] [PubMed] [Google Scholar]
- (a) Imahori H., Umeyama T., Ito S. Acc. Chem. Res. 2009;42:1809–1818. doi: 10.1021/ar900034t. [DOI] [PubMed] [Google Scholar]; (b) Imahori H., Hayashi S., Hayashi H., Oguro A., Eu S., Umeyama T., Matano Y. J. Phys. Chem. C. 2009;113:18406–18413. [Google Scholar]; (c) Imahori H., Matsubara Y., Iijima H., Umeyama T., Matano Y., Ito S., Niemi M., Tkachenko N. V., Lemmetyinen H. J. Phys. Chem. C. 2010;114:10656–10665. [Google Scholar]; (d) Imahori H., Kang S., Hayashi H., Haruta M., Kurata H., Isoda S., Canton S. E., Infahsaeng Y., Kathiravan A., Pascher T., Chabera P., Yarsev A. P., Sundström V. J. Phys. Chem. A. 2011;115:3679–3690. doi: 10.1021/jp103747t. [DOI] [PubMed] [Google Scholar]; (e) Ye S., Kathiravan A., Hayashi H., Tong Y., Infahsaeng Y., Chabera P., Pascher T., Yartsev A. P., Isoda S., Imahori H., Sundström V. J. Phys. Chem. C. 2013;117:6066–6080. [Google Scholar]; (f) Kurotobi K., Toude Y., Kawamoto K., Fujimori Y., Ito S., Chabera P., Sundström V. Chem.–Eur. J. 2013;19:17075–17081. doi: 10.1002/chem.201303460. [DOI] [PubMed] [Google Scholar]; (g) Higashino T., Fujimori Y., Sugiura K., Tsuji Y., Ito S., Imahori H. Angew. Chem., Int. Ed. 2015;54:9052–9056. doi: 10.1002/anie.201502951. [DOI] [PubMed] [Google Scholar]; (h) Higashino T., Imahori H. Dalton Trans. 2015;44:448–463. doi: 10.1039/c4dt02756f. [DOI] [PubMed] [Google Scholar]
- (a) Lazarides T., Delor M., Sazanovich I. V., McCormick T. M., Georgakaki I., Charalambidis G., Weinstein J. A., Coutsolelos A. G. Chem. Commun. 2014;50:521–523. doi: 10.1039/c3cc45025b. [DOI] [PubMed] [Google Scholar]; (b) Sherman B. D., Pillai S., Kodis G., Bergkamp J., Mallouk T. E., Gust D., Moore T. A., Moore A. L. Can. J. Chem. 2011;89:152–157. [Google Scholar]; (c) Kiyosawa K., Shiraishi N., Shimada T., Masui D., Tachibana H., Takagi S., Ishitani O., Tryk D. A., Inoue H. J. Phys. Chem. C. 2009;113:11667–11673. [Google Scholar]; (d) Amao Y., Watanabe T. Chem. Lett. 2004;33:1544–1545. [Google Scholar]
- (a) Knauf R. R., Brennaman M. K., Alibabaei L., Norris M. R., Dempsey J. L. J. Phys. Chem. C. 2013;117:25259–25268. [Google Scholar]; (b) Green A. N. M., Palomares E., Haque S. A., Kroon J. M., Durrant J. R. J. Phys. Chem. B. 2005;109:12525–12533. doi: 10.1021/jp050145y. [DOI] [PubMed] [Google Scholar]
- Nayak A., Knauf R. R., Hanson K., Alibabaei L., Concepcion J. J., Ashford D. L., Dempsey J. L., Meyer T. J. Chem. Sci. 2014;5:3115–3119. [Google Scholar]
- Song W., Ito A., Binstead R. A., Hanson K., Luo H., Brennaman M. K., Concepcion J. J., Meyer T. J. J. Am. Chem. Soc. 2013;135:11587–11594. doi: 10.1021/ja4032538. [DOI] [PubMed] [Google Scholar]
- (a) Ma L., Wang Q., Man W.-L., Kwong H.-K., Ko C.-C., Lau T.-C. Angew. Chem., Int. Ed. 2015;54:5246–5249. doi: 10.1002/anie.201500507. [DOI] [PubMed] [Google Scholar]; (b) Arafa W. A. A., Kärkäs M. D., Lee B.-L., Åkermark T., Liao R.-Z., Berends H.-M., Messinger J., Siegbahn P. E. M., Åkermark B. Phys. Chem. Chem. Phys. 2014;16:11950–11964. doi: 10.1039/c3cp54800g. [DOI] [PubMed] [Google Scholar]; (c) Chen J., Wagner P., Tong L., Wallace G. G., Officer D. L., Swiegers G. F. Angew. Chem., Int. Ed. 2012;51:1907–1910. doi: 10.1002/anie.201107355. [DOI] [PubMed] [Google Scholar]
- (a) Zhang T., Wang C., Liu S., Wang J.-L., Lin W. J. Am. Chem. Soc. 2014;136:273–281. doi: 10.1021/ja409267p. [DOI] [PubMed] [Google Scholar]; (b) Coggins M. K., Zhang M.-T., Chen Z., Song N., Meyer T. J. Angew. Chem., Int. Ed. 2014;53:12226–12230. doi: 10.1002/anie.201407131. [DOI] [PubMed] [Google Scholar]; (c) Barnett S. M., Goldberg K. I., Mayer J. M. Nat. Chem. 2012;4:498–502. doi: 10.1038/nchem.1350. [DOI] [PubMed] [Google Scholar]
- Zhang M., Zhang M.-T., Hou C., Ke Z.-F., Lu T.-B. Angew. Chem., Int. Ed. 2014;53:13042–14038. doi: 10.1002/anie.201406983. [DOI] [PubMed] [Google Scholar]
- (a) Coggins M. K., Zhang M.-T., Vannucci A. K., Dares C. J., Meyer T. J. J. Am. Chem. Soc. 2014;136:5531–5534. doi: 10.1021/ja412822u. [DOI] [PubMed] [Google Scholar]; (b) Fillol J. L., Codolà Z., Garcia-Bosch I., Gómez L., Pla J. J., Costas M. Nat. Chem. 2011;3:807–813. doi: 10.1038/nchem.1140. [DOI] [PubMed] [Google Scholar]
- (a) Volpe A., Sartorel A., Tubaro C., Meneghini L., Valentin M. D., Graiff C., Bonchio M. Eur. J. Inorg. Chem. 2014:665–675. [Google Scholar]; (b) Hintermair U., Sheehan S. W., Parent A. R., Ess D. H., Richens D. T., Vaccaro P. H., Brudvig G. W., Crabtree R. H. J. Am. Chem. Soc. 2013;135:10837–10851. doi: 10.1021/ja4048762. [DOI] [PubMed] [Google Scholar]
- (a) Lv H., Song J., Geletii Y. V., Vickers J. W., Sumliner J. M., Musaev D. G., Kogerler P., Zhuk P. F., Bacsa J., Zhu G., Hill C. L. J. Am. Chem. Soc. 2014;136:9268–9271. doi: 10.1021/ja5045488. [DOI] [PubMed] [Google Scholar]; (b) Kanan M. W., Nocera D. G. Science. 2008;321:1072–1075. doi: 10.1126/science.1162018. [DOI] [PubMed] [Google Scholar]
- (a) Laine T. M., Kärkäs M. D., Liao R.-Z., Åkermark T., Lee B.-L., Karlsson E. A., Siegbahn P. E. M., Åkermark B. Chem. Commun. 2015;51:1862–1865. doi: 10.1039/c4cc08606f. [DOI] [PubMed] [Google Scholar]; (b) Tanaka K., Isobe H., Yamanaka S., Yamaguchi K. Proc. Natl. Acad. Sci. U. S. A. 2012;109:15600–15605. doi: 10.1073/pnas.1120705109. [DOI] [PMC free article] [PubMed] [Google Scholar]; (c) Chen Z., Concepcion J. J., Jurss J. W., Meyer T. J. J. Am. Chem. Soc. 2009;131:15580–15581. doi: 10.1021/ja906391w. [DOI] [PubMed] [Google Scholar]; (d) Duan L., Fischer A., Xu Y., Sun L. J. Am. Chem. Soc. 2009;131:10397–10399. doi: 10.1021/ja9034686. [DOI] [PubMed] [Google Scholar]
- Mirzakulova E., Khatmullin R., Walpita J., Corrigan T., Vargas-Barbosa N. M., Vya S., Oottikkal S., Manzer S. F., Hadad C. M., Glusac K. D. Nat. Chem. 2012;4:794–801. doi: 10.1038/nchem.1439. [DOI] [PubMed] [Google Scholar]
- Cox N., Retegan M., Neese F., Pantazis D. A., Boussac A., Lubitz W. Science. 2014;345:804–808. doi: 10.1126/science.1254910. [DOI] [PubMed] [Google Scholar]
- Kavan L., Tétreault N., Moehl T., Grätzel M. J. Phys. Chem. C. 2014;118:16408–16418. [Google Scholar]
- Indeed, several literatures for DSPEC cells with RuP and itsderivatives as a light-harvesting antenna reported the efficiency, see ref. 8, 10a, 11b, and 12b
- (a) Preshlock S. M., Ghaffari B., Maligres P. E., Krska S. W., Maleczka R. E., Smith M. R. J. Am. Chem. Soc. 2013;135:7572–7582. doi: 10.1021/ja400295v. [DOI] [PubMed] [Google Scholar]; (b) Ishiyama T., Miyaura N. Pure Appl. Chem. 2006;78:1369–1375. [Google Scholar]
- (a) Barder T. E., Walker S. D., Martinelli J. R., Buchwald S. L. J. Am. Chem. Soc. 2005;127:4685–4696. doi: 10.1021/ja042491j. [DOI] [PubMed] [Google Scholar]; (b) Wolfe J. P., Singer R. A., Yang B. H., Buchwald S. L. J. Am. Chem. Soc. 1999;121:9550–9561. [Google Scholar]
- Imahori H., El-Khouly M. E., Fujitsuka M., Ito O., Sakata Y., Fukuzumi S. J. Phys. Chem. A. 2001;105:325–332. [Google Scholar]
- Sheridan M. V., Sherman B. D., Fang Z., Wee K.-R., Coggins M. K., Meyer T. J. ACS Catal. 2015;5:4404–4409. [Google Scholar]
- Chen Z., Concepcion J. J., Jurss J. W., Meyer T. J. J. Am. Chem. Soc. 2009;131:15580–15581. doi: 10.1021/ja906391w. [DOI] [PubMed] [Google Scholar]
- O'Regan B., Grätzel M. Nature. 1991;353:737–740. [Google Scholar]
- Hyde J. T., Hanson K., Vannucci A. K., Lapides A. M., Alibabaei L., Norris M. R., Meyer T. J., Harrison D. P. ACS Appl. Mater. Interfaces. 2015;7:9554–9562. doi: 10.1021/acsami.5b01000. [DOI] [PubMed] [Google Scholar]
- Vannucci A. K., Alibabaei L., Losego M. D., Concepcion J. J., Kalanyan B., Parsons G. N., Meyer T. J. Proc. Natl. Acad. Sci. U. S. A. 2013;110:20918–20922. doi: 10.1073/pnas.1319832110. [DOI] [PMC free article] [PubMed] [Google Scholar]
- Young K. J., Martini L. A., Milot R. L., Snoeberger R. C., Batista V. S., Schmuttenmaer C. A., Crabtree R. H., Brudvig G. W. Coord. Chem. Rev. 2012;256:2503–2520. doi: 10.1016/j.ccr.2012.03.031. [DOI] [PMC free article] [PubMed] [Google Scholar]
- Patthey L., Rensmo H., Persson P., Westermark K., Vayssieres L., Stashans A., Petersson A., Bruhwiler P. A., Siegbahn H., Lunell S., Martensson N. J. Chem. Phys. 1999;110:5913–5918. [Google Scholar]
- Petrykin V., Bastl Z., Franc J., Macounova K., Makarova M., Mukerjee S., Ramaswamy N., Spirovova I., Krtil P. J. Phys. Chem. C. 2009;113:21657–21666. [Google Scholar]
- Sherman B. D., Ashford D. L., Lapides A. M., Sheridan M. V., Wee K.-R., Meyer T. J. J. Phys. Chem. Lett. 2015;6:3213–3217. [Google Scholar]
Associated Data
This section collects any data citations, data availability statements, or supplementary materials included in this article.


