

SUMMARY
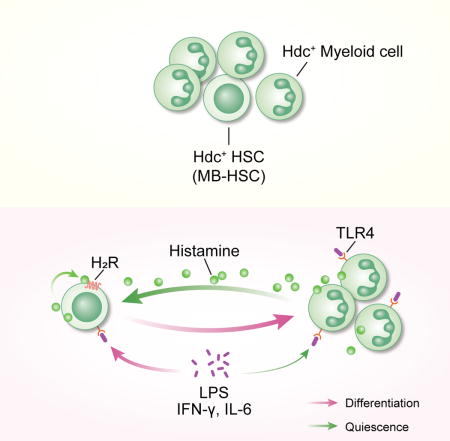
Myeloid-biased hematopoietic stem cells (MB-HSCs) play critical roles in recovery from injury, but little is known about how they are regulated within the bone marrow niche. Here, we describe an auto/paracrine physiologic circuit that controls quiescence of MB-HSCs and hematopoietic progenitors marked by histidine decarboxylase (Hdc). Committed Hdc+ myeloid cells lie in close anatomical proximity to MB-HSCs and produce histamine, which activates the H2 receptor on MB-HSCs to promote their quiescence and self-renewal. Depleting histamine-producing cells enforces cell cycle entry, induces loss of serial transplant capacity, and sensitizes animals to chemotherapeutic injury. Increasing demand for myeloid cells via LPS treatment specifically recruits MB-HSCs and progenitors into the cell cycle; cycling MB-HSCs fail to revert into quiescence in the absence of histamine feedback, leading to their depletion, while an H2 agonist protects MB-HSCs from depletion after sepsis. Thus, histamine couples lineage-specific physiological demands to intrinsically-primed MB-HSCs to enforce homeostasis.
Graphical abstract
INTRODUCTION
Adult bone marrow (BM) hematopoietic stem cells (HSCs) are typically maintained in a quiescent state and demonstrate regenerative capacity after injury (Trumpp et al., 2010). For decades, hematopoiesis in either homeostatic or regenerative conditions was thought to transpire in a cascade-like manner with progressive lineage commitment, a process that was postulated to originate in a population of self-renewing and multipotent HSCs, which were believed to give rise proportionally to multiple lineage-committed progenitors and further differentiate into myeloid or lymphoid descendants.
However, recent studies indicate that HSCs are heterogeneous and vary in their capacity for self-renewal and lineage output (Dutta et al., 2015; Morita et al., 2010; Sanjuan-Pla et al., 2013). Among the primitive adult BM HSC compartments, myeloid-biased HSCs (MB-HSCs) exhibit greater self-renewal and long-term (LT) repopulation capability (Morita et al., 2010). Although the rapid response by myeloid cells to tissue inflammation and injury requires a relatively dynamic BM myeloid pool, MB-HSCs are paradoxically more quiescent than the rest of HSCs (Challen et al., 2010; Land et al., 2015). Furthermore, biased lineage differentiation is exaggerated in the setting of inflammation (Dutta et al., 2015). The notion of lineage biased-activation of HSCs suggests that lineage-specific demands in an organism may initiate the recruitment of lineage-committed progenitors (e.g. myeloid progenitors after bacterial infection), but lineage-biased HSCs may also be differentially recruited, thereby coordinating an organism’s demands for regeneration at the stem cell level (King and Goodell, 2011). Whether this process occurs and how such a system might be restored to homeostasis remain important questions in HSC biology.
The self-renewal and lineage commitment properties of HSC can be engendered and regulated by either intrinsic cellullar properties or extrinsic niche factors. Niche cells are thought to impose stem cell features on daughter cells, restrict stem cell proliferation, and integrate signals reflecting organismal state. In addition to well-studied stromal niche cells (Morrison and Scadden, 2014), hematopoietic lineage descendants have been reported to promote HSC retention (Bruns et al., 2014; Zhao et al., 2014). Although this hypothesis fits well in a model of dynamic niche regulation, little is known as to how niche daughters regulate lineage-biased HSCs. Nevertheless, recent studies have suggested that MB- and lymphoid-biased (LB) HSCs and progenitors respond differentially to niche factors (Challen et al., 2010; Cordeiro Gomes et al., 2016), indicating that lineage-biased HSCs and progenitors might reside in distinct niches and be differentially regulated by specific demands.
The stem cell niche is thought to be critical for sustaining the dormancy of HSCs, which must limit their divisions in order to maintain a steady-state pool of self-renewing HSCs. In the setting of acute infection or injury, myeloid cells quickly traffic out of BM, followed by a rapid increase in the proliferation of MB-HSCs and progenitors. However, if this acute myeloid demand is not resolved, the prolonged entry of HSCs into the cell cycle can lead to HSC depletion (Trumpp et al., 2010). Thus, current studies on MB-HSCs have raised several crucial questions. First, what regulates intrinsically biased HSCs in their native niche to keep them in dormancy during homeostasis? Second, how does the HSC and progenitor regulatory network coordinate in regards to lineage-specific demands of an organism? Third, how does this regulatory network restore homeostasis?
The histamine-synthesizing enzyme, histidine decarboxylase (Hdc), is highly expressed in both human and mouse myeloid lineages, and has been used as a marker to track myeloid cell fate (Terskikh et al., 2003). Furthermore, Hdc in myeloid cells is primarily responsible for histamine production in acute and chronic inflammation, where it plays a role in suppressing myeloid proliferation and inflammation (Brune et al., 2006; Yang et al., 2011). However, it has not been established precisely how histamine signals are integrated by the HSCs and progenitors, and whether Hdc gene expression is part of the early transcriptional priming of the myeloid lineage. Here, we provide evidence for a previously unknown regulatory circuit, driven by the myeloid lineage-specific auto/paracrine factor histamine, which is mainly produced by myeloid descendants and feeds back on MB-HSCs and progenitors to maintain their quiescence and protect them from myelotoxic injury and depletion.
RESULTS
Hdc-expression identifies MB-HSC and myeloid lineage
We examined Hdc expression in BM primitive and differentiated cells in Hdc-GFP mice (Figure 1A and 1B). Consistent with their heterogeneous nature, a continuum of Hdc-GFP expression was observed in HSCs and progenitors (Figure 1A and S1B) (Morita et al., 2010). Small subsets of HSCs (10.3 ± 2.27%) and progenitors (14.33 ± 2.17%), as well as the vast majority of granulocyte-macrophage progenitors (GMPs) and myeloid cells, expressed high levels of Hdc-GFP (henceforth referred to as Hdc-GFPhi and Hdc-GFPlo) (Figure 1B, S1B, and S1C) (Yang et al., 2011).
Figure 1. Hdc Expression Identifies MB-HSC.
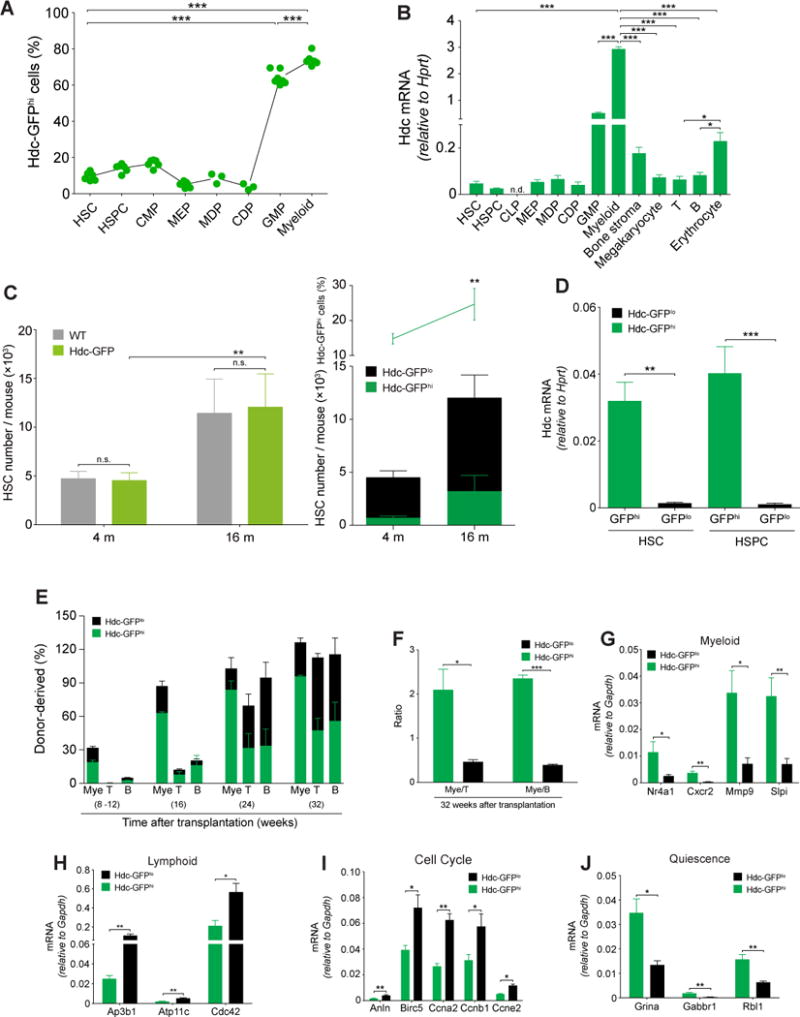
(A) Percentage of Hdc-GFPhi cells in lineages of bone marrow (BM) cells (n = 3 - 7 per group). Six independent experiments. (B) mRNA expression of Hdc gene in BM cells and stromal cells (n = 3 - 5). (C) Quantification of Hdc-GFPhi HSCs in Hdc-GFP and WT mice (n = 3 per group). (D) Hdc mRNA expression in Hdc-GFPhi and Hdc-GFPlo BM HSCs and HSPCs (n = 3 per group). (E) Contribution of Hdc-GFPhi HSCs (n = 12) to lethally irradiated recipients. (F) Blood myeloid/lymphoid ratio of recipients in (E). (G-J) Relative mRNA expression of myeloid (G) and lymphoid lineage (H), cell cycle (I), and quiescence signatures genes (J) in HSCs (n = 3 - 4 per group). Data were analyzed with one-way analysis of variation (ANOVA) with Bonferroni post-hoc test (A and B) or two-tailed Student’s t-test (C-J). See also Figure S1-S3.
Hdc-GFP expression was detected in macrophage dendritic cell progenitors (MDP) and common dendritic cell precursors (CDPs) (Figure S1D). Common lymphoid progenitors (CLPs) and other lymphoid lineages of cells, however, lacked Hdc-GFP expression (Figure S1E). Few BM stromal cells expressed Hdc-GFP (Figure S1F). The Hdc mRNA level was higher in erythrocytes compared to T and B cells, consistent with the greater relative expression in their progenitors. However, these levels were much lower than that seen in myeloid cells (Figure 1B). Among all Hdc-GFP-expressing cells, CD11b+Gr1+/hi granulocytic myeloid cells expressed the highest level of Hdc mRNA (Figure 1B and S2A). In order to exclude any insertional effects of the Hdc-GFP BAC transgene, we compared wild type (WT) and Hdc-GFP mice, and noted similar levels of Hdc mRNA expression, histamine, and cytokines in hematopoietic lineages. (Figure S1G-I) (Table S1).
Aging is known to influence the top of the hematopoietic hierarchy and contributes to the myeloid-biased behaviors of HSCs (Beerman et al., 2010), most likely through effects on the relative number of MB-HSCs (Challen et al., 2010). Thus, we investigated the absolute numbers of myeloid-lineage cells from young (4-month-old) and aged (16-month-old) WT and Hdc-GFP mice. Consistent with mRNA results (Figure S1G-I), the Hdc-GFP transgene did not affect the numbers of BM HSC, HSPC, GMP, blood myeloid cells, and lymphocytes (Figure 1D, S1J, and S1K). However, the percentage and absolute number of HSCs from aged mice increased significantly compared to young mice (Figure 1C). Thus, to minimize age-related bias in our studies, we primarily used young mice (< 4 months) and littermates.
Both perivascular cells and vascular endothelial cells can express Cxcl12 in BM (Ding and Morrison, 2013). Histologic analysis showed that Hdc-GFP-expressing cells were situated immediately adjacent to Cxcl12+ perivascular stromal cells and Laminin+ vascular matrix, but rarely overlapped with these stromal elements (Figure S1L and S1M).
Sorted Hdc-GFPhi HSCs showed greater myeloid colony-forming unit (CFU) potential than Hdc-GFPlo counterparts (Figure S2B). Within CMPs and GMPs, Hdc-GFPhi cells also generated more myeloid colonies, especially granulocytic colonies (Figure S2C), indicating a granulocytic bias in Hdc-GFPhi progenitors. Moreover, single Hdc-GFPhi HSC tended to form larger and denser single myeloid colonies compared to Hdc-GFPlo HSC (Figure S2D), which was not surprising, given that the culture medium was optimized for growth of primitive myeloid progenitor cells. In contrast to their increased myeloid output, under pre-B colony formation conditions, Hdc-GFPhi HSPCs formed fewer B colonies, leading to a higher myeloid/B ratio with Hdc-GFPhi HSPCs compared to that with Hdc-GFPlo counterparts (Figure S2E). These data suggest a distinct in vitro myeloid bias for Hdc-GFPhi HSCs and progenitors.
We performed additional cell culture experiments to investigate the stability of Hdc-GFPhi. After cultured for 5 days, a minority (5.67 ± 1.76%) of Hdc-GFPlo cells were detected in Hdc-GFPhi HSCs group, but not vice versa (Figure S2F). To compare the multilineage reconstitution ability of Hdc-GFPhi and Hdc-GFPlo HSC, we serially transplanted sorted Hdc-GFPhi and Hdc-GFPlo HSCs into lethally irradiated recipients, along with 2 × 10⁵ CD45.1+ competitor BM cells (Figure S2G). Notably, the transplantation of 20 Hdc-GFPhi HSCs yielded robust myeloid chimerism, with greater than 2-fold more myeloid cells in the peripheral blood of recipients at 32 weeks (Figure 1E). In addition, the donor-derived myeloid/lympholoid ratio was significantly higher than that in recipients of Hdc-GFPlo HSCs (Figure 1F). Even at one year after transplantation, the myeloid bias of Hdc-GFPhi donor cells was maintained (Figure S2H). Notably, Hdc-GFPhi HSCs had greater blood donor and myeloid chimerism (Figure S2I and S2J). This effect persisted in secondary transplants, with skewing of donor myeloid/lymphoid ratio at 16 weeks, similar to that seen in the primary transplant (Figure S2K and S2L). Although there was less myeloid bias in secondary transplants with Hdc-GFPhi HSCs, it was still much greater than that with Hdc-GFPlo HSCs.
A similar myeloid bias was observed in mice transplanted with 50 Hdc-GFPhi HSCs (Figure S2M). Serial transplantation studies, using 20 or 50 HSCs, revealed some degree of reconstitution of myeloid and lymphoid lineages with both types of HSC (Fig. S2N). However, Hdc-GFPhi HSCs showed a higher myeloid lineage reconstitution and a lower lymphoid reconstitution in limiting dilution assays or by the percentage of responders. In single cell transplantations with Hdc-GFPhi or Hdc-GFPlo HSC (n > 40 per group), limited HSC reconstitution was observed, but Hdc-GFPhi HSC indeed showed a greater myeloid lineage repopulation potential and a higher myeloid/lymphoid reconstitution ratio (Figure S2O).
We performed a transcriptome analysis to characterize the Hdc-GFPhi HSCs. In total, 748 genes were significantly upregulated, while 1149 genes were downregulated (p < 0.05, fdr < 0.28). Myeloid-specific genes and quiescence regulators were expressed at higher levels (Figure 1G) (Table S1) (Ardi et al., 2007; Klimenkova et al., 2014; Land et al., 2015; Schinke et al., 2015), whereas lymphoid-specific, cell cycle, DNA replication, and mitochondrial function genes were downregulated in Hdc-GFPhi HSCs (Figure 1H-J and S2P) (Table S1) (Cheung and Rando, 2013; Guo et al., 2009; Jung et al., 2006; Siggs et al., 2011; Viatour et al., 2008). These results are consistent with the observed myeloid bias and quiescence of Hdc-GFPhi HSCs. Moreover, Hdc-GFPhi HSCs preferentially expressed lower Dpp4 but higher Ogt (Figure S2Q) (Table S1) (Broxmeyer et al., 2012; Hart et al., 2011), suggesting that MB-HSCs may be resistant to stress. Similar signatures were also observed in Hdc-GFPhi HSPCs (Figure S3A-B). Taken together, the gene expression patterns support the heterogeneity of HSCs and progenitors, which can be divided into two categories (myeloid-biased, MB, Hdc-GFPhi; lymphoid-biased, LB, Hdc-GFPlo) by Hdc-GFP expression.
Myeloid demand stimuli activate Hdc-GFPhi MB-HSCs
Acute bacterial infection induces the production and mobilization of myeloid cells. Toll-like receptors (TLRs) expressed on myeloid cells are known to sense bacterial products, which lead to rapid myelopoiesis (Nagai et al., 2006; Takeuchi et al., 1999). Lipopolysaccharide (LPS) treatment recapitulates gram-negative bacterial infection and specifically activates TLR4 on myeloid cells (Takizawa et al., 2017). HSCs can be activated by LPS either directly through cell intrinsic TLR signaling or indirectly through upregulation of myeloid-derived inflammatory cytokines (Nagai et al., 2006; Rodriguez et al., 2009).
We found that Hdc-GFPhi HSCs and myeloid cells expressed higher levels of TLR4 compared to Hdc-GFPlo counterparts (Figure 2A) (Table S1). In particular, TLR2/4/6 genes were highly enriched in granulocytic myeloid cells (Figure 2B and S3C) (Table S1) (Chen et al., 2017). As LPS elicits histamine release from Hdc-expressing cells (Alcaniz et al., 2013), we analyzed histamine release from Hdc-GFPhi HSCs and myeloid cells in response to in vitro LPS stimulation. The results showed that only Hdc-GFPhi myeloid cells were capable of releasing a large amount of histamine shortly after LPS treatment (Figure S3D), indicating that Hdc-expressing myeloid cells preferentially sense and respond to bacteria-mediated TLR signals.
Figure 2. Myeloid Stimuli Activates Hdc-GFPhi MB-HSC.
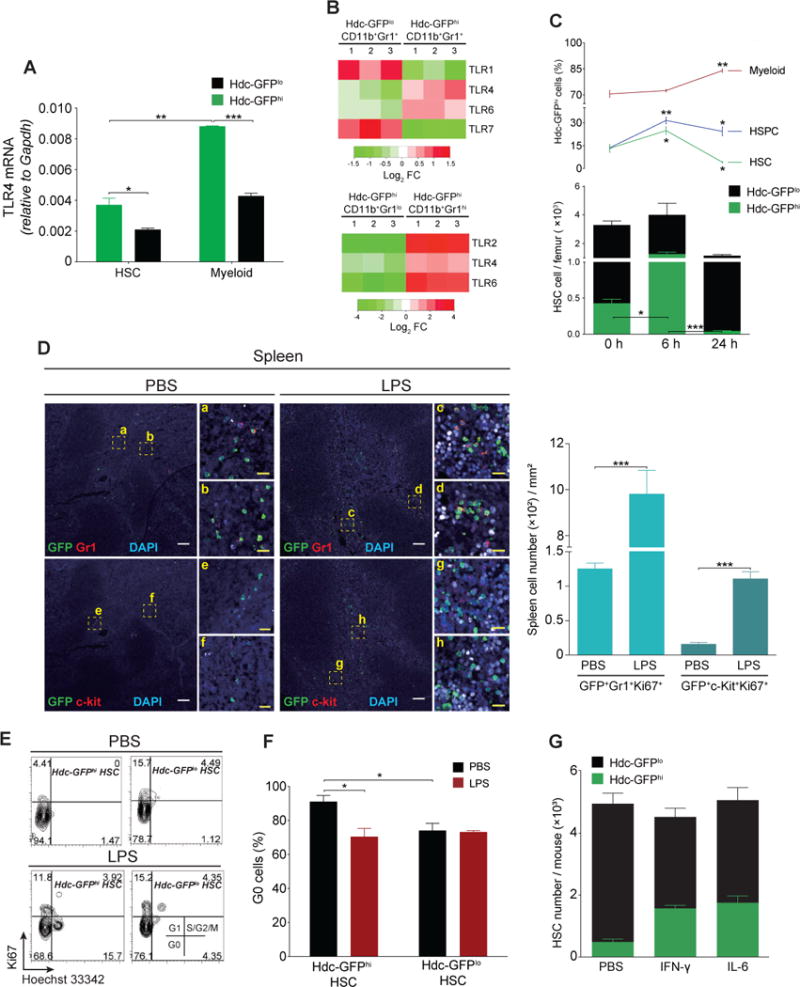
(A) TLR4 mRNA in HSCs (n = 3 - 4) and myeloid cells (n = 5). (B) TLRs expression from gene microarray analysis in myeloid cells (n = 3 per group). (C) Quantification of HSCs, HSPCs, and myeloid cells at 24 hours after LPS treatment (n = 5). (D) Myeloid cells (Gr1+) and progenitors (c-kit+) in spleen from LPS (n = 4) or PBS (n = 3)-treated Hdc-GFP mice. Four independent experiments. (E and F) Cell cycle analysis of BM HSCs at 6 hours after PBS (n = 3) or LPS (n = 3) treatment. (G) Absolute numbers of HSC in BM of Hdc-GFP mice treated with PBS, IFN-γ, or IL6 (n = 5 per group). Data were analyzed with two-tailed Student’s t-test (A, F, and G) or one-way analysis of variation (ANOVA) with Bonferroni post-hoc test (C). See also Figure S3.
Next, we injected LPS intravenously into Hdc-GFP mice and quantified HSCs and progenitors. Hdc-GFPhi HSCs, but not myeloid cells, transiently increased at 6 hours (Figure 2C), consistent with LPS-induced myeloid demand (Nagai et al., 2006; Rodriguez et al., 2009). LPS treatment induced an increase in BM Hdc-GFPhi myeloid cells along with a sharp decrease of Hdc-GFPhi HSCs (Figure 2C), and in the proliferation and frequencies of splenic myeloid cells and progenitors at 24 hours (Figure 2D-F and S3E). Taken together, these data suggest that myeloid demand promotes the early differentiation of Hdc-GFPhi HSCs and progenitors into myeloid cells to replenish the LPS-induced emergency myeloid consumption.
In line with this observation, cell cycle analysis showed that Hdc-GFPhi HSCs, but not Hdc-GFPlo HSCs, lost quiescence as early as 6 hours after LPS treatment (Figure 2E and 2F). Analysis of PBS-treated controls confirms earlier observations that Hdc-GFPhi HSCs show essentially no proliferation under basal conditions (Figure 1I, 1J and S2P). A previous study suggested that the TLR4/Sca-1 axis contributes to granulopoiesis in the setting of bacterial infection or LPS treatment (Shi et al., 2013). While Sca-1 expression in Lin−c-kit+Sca-1− cells was upregulated slightly in response to LPS in vitro, the expansion of HSPCs in vivo was due primarily to an increase in Lin−c-kit+Sca-1+ cells. Although Hdc-GFPlo HSCs were less affected at 6 hours, they showed a significant decrease at 24 hours, suggesting that LPS-induced depletion of Hdc-GFPhi HSCs may also stimulate the differentiation of Hdc-GFPlo HSCs (Figure 2C, 3E, and S3E).
Figure 3. Hdc-GFPhi MB-HSCs Are Not Responsive to IL-7.
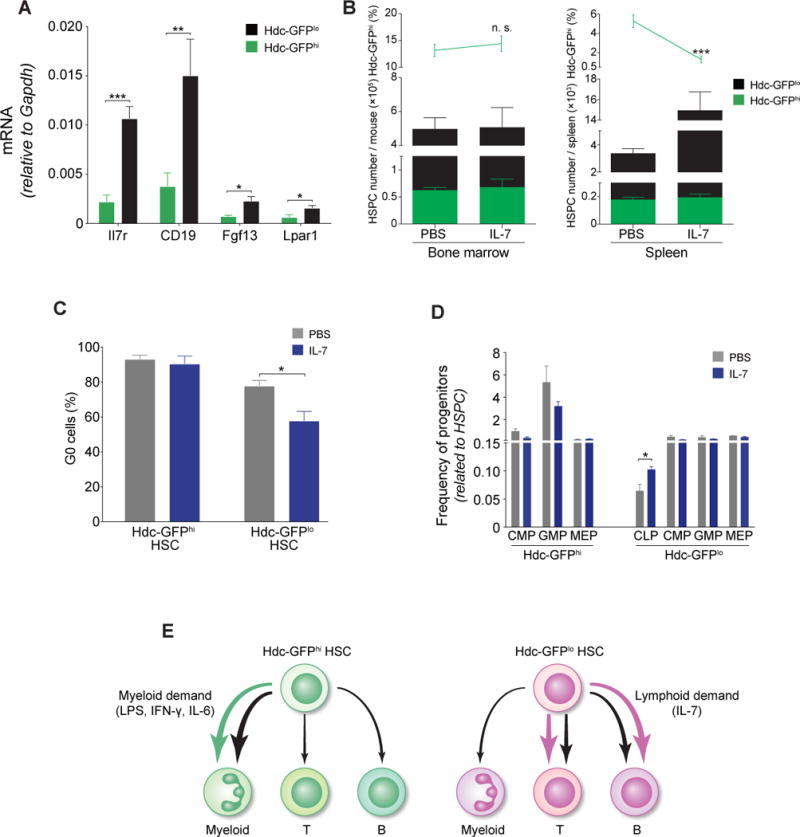
(A) Relative mRNA expression of IL-7/IL7-R pathway genes in HSPCs (n = 4 per group). (B) Quantification of Hdc-GFPhi HSPCs in IL-7 or PBS-treated mice (n = 3 per group). (C) Percentage of G0 HSCs (n = 3 per group). (D) Frequencies of progenitors in IL-7 or PBS-treated Hdc-GFP mice (n = 5 per group). (E) Schematic depiction of the relative lineage bias of Hdc-GFPhi HSCs or Hdc-GFPlo HSCs. Data were analyzed with two-tailed Student’s t-test (A-D). See also Figure S3.
IFN-γ can activate LT-HSCs, leading to myeloid differentiation (de Bruin et al., 2012), and can promote BM stromal cells to secret IL-6, which in turn increases myeloproliferation through the inhibition of Runx-1 and Cebpα in HSCs (Schurch et al., 2014). We intravenously injected Hdc-GFP mice with recombinant mouse IFN-γ or IL-6 to test the responsiveness of Hdc-GFPhi HSCs, and measured absolute numbers of HSCs and progenitors at 48 hours. Sca-1 was excluded because of the nonspecific expression induced by IFN-γ (Matatall et al., 2016). Both IFN-γ and IL-6 exclusively increased MB-HSCs and progenitors (Figure 2G, S3F, and S3G). Taken together, these observations suggest that Hdc-GFPhi MB-HSCs are preferentially activated by myeloid stimulants (see Figure 3E).
Hdc-GFPhi MB-HSCs are refractory to lymphoid stimulus
We next asked whether Hdc-GFPhi HSCs are refractory to lymphoid stimulus. The IL-7/IL-7Ra axis has been shown to activate and expand lymphocytes and their progenitors (Dias et al., 2005). IL-7/IL7-Ra pathway genes were predominantly expressed in Hdc-GFPlo rather than Hdc-GFPhi HSPCs (Figure 3A and RNAseq, GSE80092) (Table S1). The injection of IL-7 into Hdc-GFP mice activated Hdc-GFPlo HSPC, leading to an expansion of Hdc-GFPlo HSPCs in the spleen (Figure 3B). Moreover, IL-7 decreased the proportion of quiescent (G0) Hdc-GFPlo HSCs and increased the output of CLP (Figure 3C and 3D). In summary, these findings indicate that Hdc-GFPhi HSCs or HSPCs are not responsive to the lymphoid stimulant (Figure 3E).
Hdc deficiency provokes myeloid proliferation from MB-HSCs
Given that Hdc-expressing myeloid cells may be a major source of histamine in the BM (Yang et al., 2011), we hypothesized that myeloid-derived histamine could be an important niche factor for maintaining the quiescence and self-renewal of MB-HSCs. The Hdc−/− mouse was crossed with the Hdc-GFP mouse. The Hdc-BAC-GFP transgenic mouse contains several transgene copies of a BAC transgene integrated randomly at a single (non-Hdc) chromosomal site, and thus could be bred into an Hdc-deficient background yielding Hdc−/−; Hdc-GFP mice as previously reported (Yang et al., 2011). Hdc-GFPhi Hdc−/− HSCs and BM cells showed increased myeloid colony expansion compared to Hdc-GFPhi Hdc+/+ controls (Figure 4A and 4B), indicating that Hdc/histamine were relatively specific for Hdc-GFPhi MB-HSCs and progenitors. We further found that while Hdc-GFPhi HSCs were largely quiescent at baseline, Hdc deficiency led to increased proliferation in Hdc-GFPhi Hdc−/− HSCs and progenitors (Figure 4C and S4A). Within the BM GFPhiLSK population, the frequencies of MB-HSCs and MPPs were decreased, while that of myeloid-biased MPP3 was increased (Figure 4D and 4E). In competitive repopulation experiments, Hdc−/− BM cells showed a deficiency in the reconstitution of all lineages, particularly in long-term myeloid reconstitution. Although lymphoid reconstitution was also reduced, it was less dramatically affected compared to myeloid cells in the long-term, suggesting that Hdc ablation preferentially affected MB-HSCs (Figure 4F). Furthermore, when we transplanted unfractionated Hdc−/− BM cells into lethally irradiated WT mice, a similar tendency was observed (Figure S4B).
Figure 4. Hdc Deficiency Leads to MB-HSC Activation.
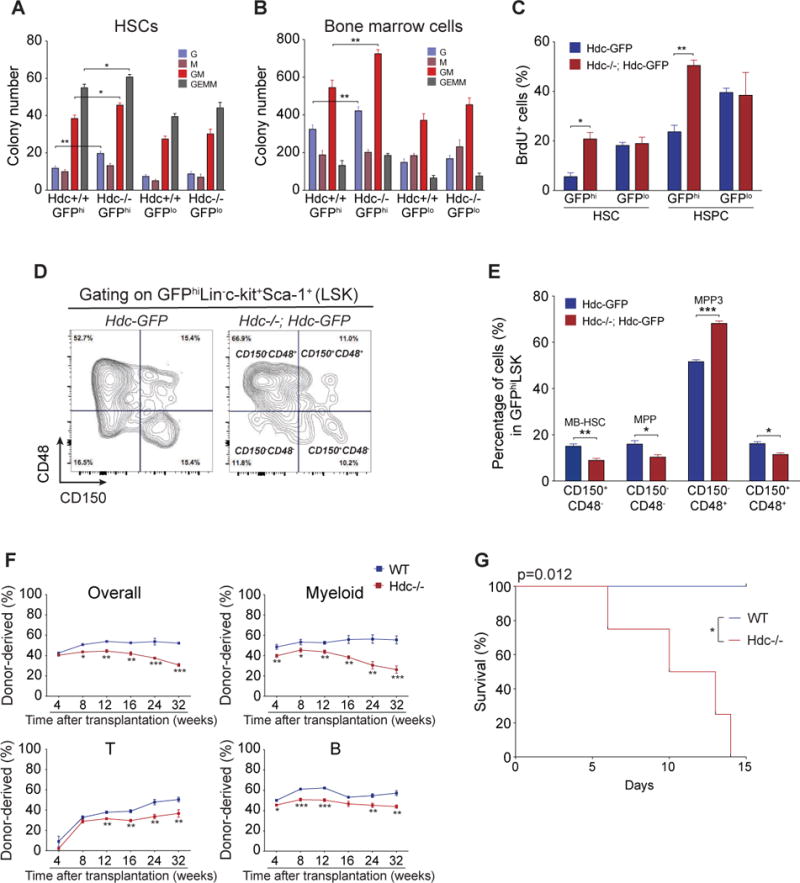
(A and B) Absolute number of myeloid CFU from 150 BM HSCs (A) and 1 × 10⁵ BM cells (B) (n = 3 per group). Three independent experiments. (C) BrdU incorporation of HSCs and HSPCs (n = 5 per group). (D and E) Hdc deficiency (Hdc−/−) increased HSC and myeloid lineage progenitors. (F) Competitive transplantation assays of 2 × 10⁵ unfractionated BM cells from Hdc−/− (n = 12) or WT mice (n = 10). (G) Kaplan-Meier curve depicting survival rates of Hdc−/− (n = 6) and WT mice (n = 5) after 5-FU treatment. Data were analyzed with two-tailed Student’s t-test (A-C, E, and F) or Logrank test (G). See also Figure S4.
To test the functional consequence of increased cell cycle entry by Hdc−/−MB-HSPCs, we treated Hdc−/− mice with 5-fluorouracil (5-FU) to selectively eliminate rapidly cycling MB-HSCs and progenitors. The replenishment of HSCs, HSPCs, and myeloid cells was much more impaired in Hdc−/− mice compared to WT (Figure S4C and S4D). Furthermore, Hdc−/− mice died significantly earlier than WT littermates (Figure 4G). Transcriptome comparison between WT and Hdc−/− HSPCs again confirmed that Hdc deficiency led to the upregulation of proliferative, myeloid, apoptosis-related, and erythroid differentiation transcripts (Figure S4E-S4K) (Table S1). Overall, our results suggest that the enhanced sensitivity of Hdc−/− HSCs and progenitors to 5-FU contributes to the early lethality of Hdc−/− mice.
Hdc-expressing myeloid cells maintain MB-HSC quiescence through histamine/H2R axis
Dormant HSCs proliferate in response to inflammation, yet are capable of returning to quiescence once the stimulus resolves (Trumpp et al., 2010). However, specific niche factors that restore homeostasis in a lineage-restricted fashion have not been well defined. We observed that GFP+ MB-HSCs but not GFP− LB-HSCs were located in close anatomical proximity to more than one GFP+ myeloid cell in direct contact, forming a tight cluster (Figure 5A and 5B). The staining with anti-Gr1 antibody showed that 79.80 ± 2.50% of the MB-HSC surrounding cells were GFP+Gr1+ myeloid cells (Figure S5A and S5B). Although GFP+Gr1+ myeloid cells comprise more than 30% of total BM cells (Yang et al., 2011), computational comparison between randomly placed HSCs and GFP+ HSCs revealed that the distribution pattern of GFP+ MB-HSCs within the MB-HSC/myeloid cluster was not random (Figure 5C).
Figure 5. Histamine-producing Myeloid Cells Maintain MB-HSCs.
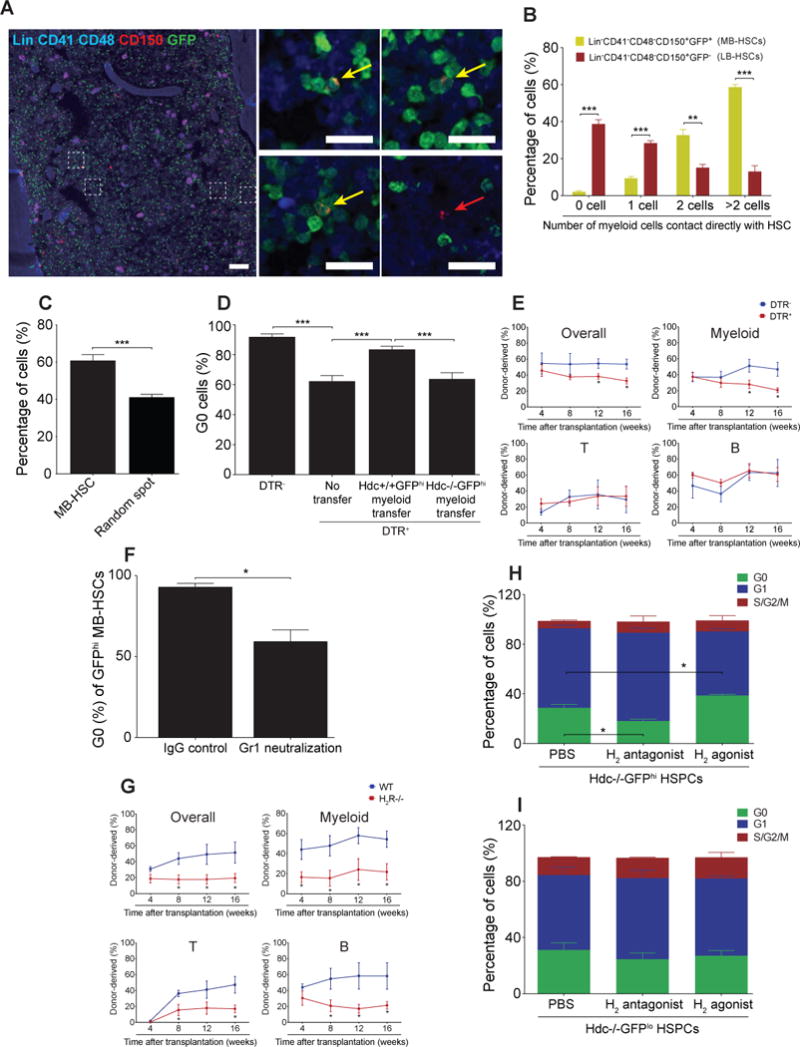
(A and B) Spatial relationship between MB-HSC (a to c, yellow arrow, n = 198) or LB-HSC (d, red arrow, n = 321) and Hdc-GFP+ myeloid cells. (C) Percentages of MB-HSCs (n = 541) and random spots (n = 2480) that contacted directly with ≥ 2 Hdc-GFP+ myeloid cells. (D) G0 BM HSCs in Hdc-CreERT2; tdTomato; iDTR (n = 6) and Hdc-CreERT2; tdTomato mice (n = 6) as depicted in Figure S5E. Cell cycle rescue was performed by GFPhiCD11b+Gr1+ cells transfer (n = 8). Hdc−/−; Hdc-GFPhi myeloid cells were used as control (n = 6). (E) Percentage of donor-derived myeloid, T, and B cells in lethally irradiated recipients transplanted with unfractionated BM cells from Hdc-CreERT2; tdTomato; iDTR or control mice (n = 5 per group). (F) G0 Hdc-GFPhi MB-HSCs in Gr1 monoclonal antibody or rat IgG-treated mice (n = 3 per group). (G) Donor chimerism in recipients transplanted with 2 × 10⁵ WT or H2R−/− total BM cells along with the same number of CD45.1 BM cells (n = 10 per group). (H and I) Hdc-GFPhi HSPCs (n = 6) and Hdc-GFPlo HSPCs (n = 5) co-cultured with Hdc−/− stromal cells and H2 antagonist or agonist. Data were analyzed with Mann-Whitney test (B and C), one-way analysis of variation (ANOVA) with Bonferroni post-hoc test (D, H, and I), or two-tailed Student’s t-test (E-G). See also Figure S5.
Using Laminin to decorate BM vascular matrix, we found that 79.45 ± 6.85% of such clusters were located within 5 μm distance of Laminin+ cells (Figure S5C and S5D). Although the pervasive presence of GFP+ myeloid cells makes it difficult to assess precisely the juxtaposition of these cells with MB-HSCs, these staining experiments and simulations demonstrate a preferential apposition between MB-HSCs and histamine producing myeloid cells.
The clusters suggested that myeloid cells may regulate MB-HSCs through a paracrine feedback. We thus utilized the inducible diphtheria toxin receptor (iDTR) to deplete Hdc-expressing myeloid cells in Hdc-CreERT2; tdTomato; iDTR mice (Figure S5E). Two weeks of tamoxifen-containing diet labeled around 25% of myeloid cells (Figure S5F). Notably, the tamoxifen chow spared HSCs (Figure S5G) and in accordance, there was no significant change in the numbers of HSCs or HSPCs in DTR+ mice compared to DTR− groups (Figure S5H). This absence of effects on HSC and HSPC was likely due to the low expression levels of CreERT2 and iDTR transgene, resulting in a lack of sensitivity to DT (Figure S5I-J).
The depletion of Hdchi myeloid cells decreased BM histamine levels and caused MB-HSCs to lose quiescence, which could be partially rescued by adoptive transfer of Hdc+/+ but not Hdc−/−;Hdc-GFPhi myeloid cells (Figure S5K and 5D). Notably, we observed significantly lower donor cell reconstitution over a period of 16 weeks in recipient mice that received donor BM cells from DTR+ mice compared with the DTR− control group (Figure 5E). Gr1+ depletion induced by the Gr1 monoclonal antibody RB6-8C5 can mimic the activation of emergency myelopoiesis. More than 30% of BM Hdc-GFPhi cells were depleted after RB6-8C5 treatment, and MB-HSCs were induced to enter the cell cycle (Figure S5L and 5F), further surpporting the role of Hdc-GFPhi myeloid cells in maintaining MB-HSC quiescence. In summary, our data suggest that Hdc-GFPhi myeloid cells are spatially located close to MB-HSCs and functionally serve as a critical MB-HSC homeostasis niche component.
We next investigated the mechanism of histamine action on MB-HSCs and progenitors. Among the four known histamine receptors, only H2R was detectable on both HSCs and progenitors (Figure S5M). Hdc-GFPhi MB-HSCs and progenitors expressed higher levels of H2R compared to Hdc-GFPlo counterparts (Figure S5N). H2R−/− BM cells exhibited a similar myeloid-lineage repopulation defect as Hdc−/− BM cells (Figure 5G). Unlike Hdc−/− animals, H2R−/− recipients also exhibited significant lymphoid reconstitution defects, which could be due to the compensatory expression of other histamine receptor(s) on H2R−/− HSCs (Saligrama et al., 2012).
The increased expression of H2R on MB-HSCs and progenitors also raised the possibility that these cells might be intrinsically more responsive to histamine. To test this hypothesis, we co-cultured Hdc−/−;Hdc-GFPhi HSPCs with Hdc−/− BM stromal cells, establishing a culture system lacking endogenous histamine. First, we noted that the addition of histamine increased the G0/quiescence frequency in WT and Hdc−/− HSPCs, but not H2R−/− HSPCs (Figure S5O), demonstrating an H2R-dependent histamine response. Next, the addition of an H2 agonist (dimaprit dihydrochloride) selectively increased the quiescence of Hdc−/− Hdc-GFPhi HSPCs, but not Hdc-GFPlo HSPCs, and decreased the myeloid/HSPC ratio in Hdc-GFPhi HSPCs, whereas the H2 antagonist (ICI 162,846) selectively decreased Hdc-GFPhi HSPC quiescence (Figure 5H, 5I, and S5P).
Finally, the effect of exogenous histamine was reproduced by the addition of histamine-producing myeloid cells to Hdc-GFPhi HSPCs culture system. Similarly, the frequency of G0/quiescence Hdc-GFPhi HSPCs was increased while the cell cycle status of Hdc-GFPlo or H2R−/− HSPCs was unchanged (Figure S5Q and S5R). Taken together, these data suggest that MB-HSCs and progenitors show (a) selective responses to histamine (b) in an H2R dependent manner and (c) that histamine-producing myeloid cells can enforce quiescence. The cluster of MB-HSCs and histamine-producing myeloid cells generates a histamine/H2R axis with a cis-regulatory auto/paracrine effect.
Histamine/H2R axis protects MB-HSCs from myelosuppressive injury
Myelosuppressive injury leads to the disappearance of most myeloid cells, which triggers HSCs proliferation and differentiation in order to rapidly replenish the BM myeloid pool rapidly. However, the price is often some degree of loss of self-renewal ability by HSCs. After IR injury to the hematopoietic system, we observed that the absolute number of HSCs and circulating myeloid cells decreased, along with a relative increase in the percentage of Hdc-GFPhi HSCs and their BM myeloid descendants (Figure 6A, 6B, S6A, and S6B). The majority of Hdc-GFPhi HSCs were quiescent at baseline (Figure 2F and 3C), and exited dormancy shortly after IR (Figure S6C) to increase their myeloid colony forming output (Figure S6D), suggesting that they fuel myeloid regeneration after myelotoxic injury.
Figure 6. Myeloid-derived Histamine Protects MB-HSCs from Myelosuppressive Injury.
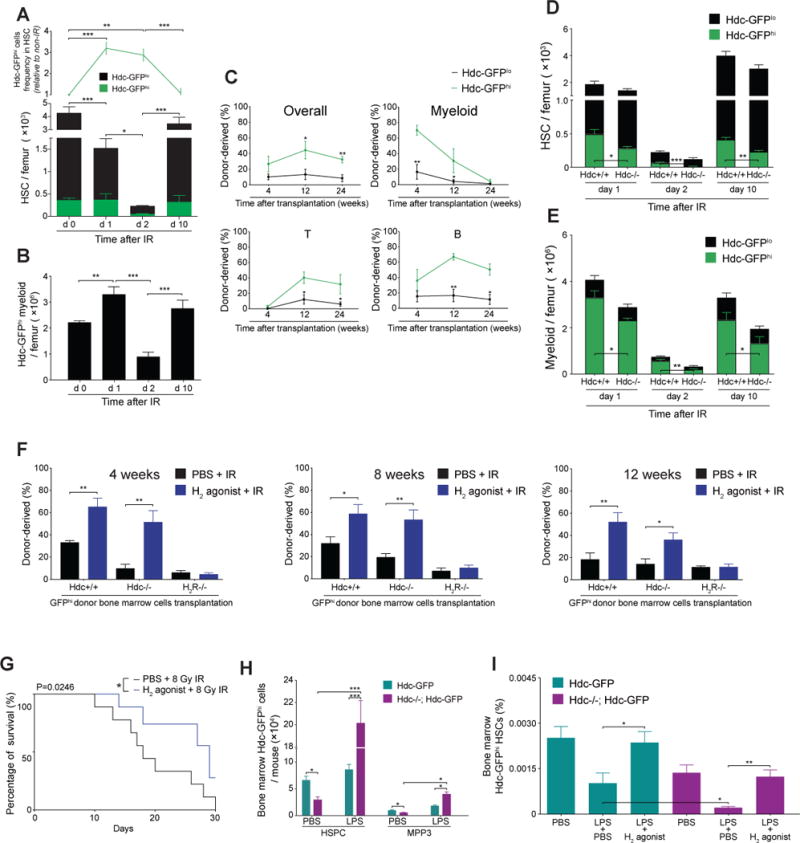
(A) Quantification of Hdc-GFPhi HSCs in irradiated Hdc-GFP mice (n = 4 - 6 per time point). (B) Number of BM Hdc-GFP+ myeloid cells in (A). (C) Competitive reconstitution comparison between 3 Gy-irradiated 1,500 Hdc-GFPhi and Hdc-GFPlo HSPCs (n = 5 per group). (D and E) Number of total HSCs (D) or myeloid cells (E) in 5 Gy-irradiated Hdc-GFP (n = 4) and Hdc−/−; Hdc-GFP mice (n = 6). (F) Blood chimerism of lethally irradiated recipients transplanted with 5 × 10⁵ unfractionated Hdc-GFP+ donor BM cells along with Sca-1-depleted CD45.1 BM cells (n = 5 each treatment). (G) Survival of 8Gy- irradiated mice pre-treated with either H2 agonist or PBS (n = 15 per group). (H) Absolute number of BM Hdc-GFPhi HSPCs and MPP (MPP3) in LPS or PBS-treated mice at 24 hours (n = 3 - 6 per group). (I) Protective effect of H2 agonist on LPS-induced sepsis mice (n = 5 per group). Data were analyzed with one-way analysis of variation (ANOVA) with Bonferroni post-hoc test (A, B, and I), two-tailed Student’s t-test (C-E, F, and H), or Logrank test (G). See also Figure S6.
For all panels, ± SEM is shown. *p < 0.05; **p < 0.01; ***p < 0.001. n.s., not significant. n.d., not detectable. n indicates biological replicates. For all experiments greater than or equal to two independent experiments were performed unless otherwise indicated.
In competitive transplantation assay, albeit with short-term follow-up (4 to 12 weeks), irradiated Hdc-GFPhi HSPCs displayed higher donor cell reconstitution (in particular in myeloid lineage) compared to Hdc-GFPlo controls. Thus, they might have lost the ability for long-term myeloid reconstitution (Figure 6C).
Given that histamine can enforce MB-HSC quiescence, we wondered if Hdc−/−MB-HSCs might be disproportionately sensitive to IR injury. Gene profiling revealed a low expression of radiation resistance genes in Hdc−/− HSPCs (Figure S6E) (Table S1) (De Bacco et al., 2011; Grimbaldeston et al., 2003). Hdc−/− animals subjected to IR injury showed that BM Hdc-GFPhi HSCs and myeloid cells were depleted dramatically, and that Hdc−/−;Hdc-GFPhi myeloid cells recovered more slowly than WT controls at 10 days post-IR (Figure 6D, 6E, and S6F-I). However, H2 agonist -treated Hdc−/− and WT mice both showed higher BM HSC numbers, while the protective effect of the H2 agonist was abolished in H2R−/− mice (Figure S6J). Furthermore, the reconstitution capacity of Hdc-GFPhi BM cells was significantly improved when donor mice received H2 agonist 10 days prior to radiation (Figure 6F). Finally, H2 agonist improved the overall survival of WT mice following lethal IR (Figure 6G). Taken together, these results suggest that exogenous H2 agonist can protect MB-HSCs and progenitors from injury.
We next sought to determine whether histamine protects MB-HSCs and progenitors from LPS-induced stimulation and depletion. Consistent with previous observations (Rodriguez et al., 2009), LPS treatment promoted the activation of MB-HSCs and progenitors in the BM and increased splenic accumulation of myeloid progenitors, which was much more pronounced in Hdc−/− animals (Figure 6H and S6K). There was a considerable expansion of MB-MPPs (Hdc-GFPhi MPP3) in Hdc−/−BM and spleen, whereas the frequencies of MB-HSCs and overall MPPs were decreased (Figure S6L and S6M), indicating and MB-HSC depletion phenotype. Treatment with the H2 agonist in either LPS-treated Hdc−/− or WT mice, significantly increased BM MB-HSCs frequencies (Figure 6I).
DISCUSSION
Here, we have identified a subset of MB-HSCs that express Hdc. Although largely quiescent, MB-HSCs and progenitors respond to myeloid stimulants with rapid expansion and production of Hdchi myeloid cells, but are relatively resistant to IL-7. Within the BM, MB-HSCs are surrounded by Hdchi myeloid cells, which regulate the physiology of MB-HSCs through a histamine/H2R axis. This feedback loop is important for maintaining MB-HSCs dormancy under homeostatic conditions and preventing depletion in the setting of injury.
Our findings add to the growing evidence regarding the heterogeneity of HSCs and progenitors. Recent studies have cast some doubt on the “stepwise” hematopoiesis model (Notta et al., 2016; Yamamoto et al., 2013). Busch and coworkers further indicate that most of the hematopoietic lineages in the adult animal under homeostatic conditions are produced by large numbers of progenitors (e.g. LSKs), with LT-HSCs participating to a limited extent (Busch et al., 2015).
Acute injury requires a rapid and lineage-specific response, which thus demands an effective hierarchical organization of hematopoiesis. Previous studies proposed that sub-groups of HSCs and progenitors are dedicated to the generation of more limited classes of myeloid and platelet cells in both steady state and acute inflammation (Dutta et al., 2015). The Hdc-expressing HSCs demonstrated greater myeloid repopulation capacity, with more granulocyte clonogenic ability in transplantation and CFU assays (Figure 1). Hdchi HSCs showed higher levels of myeloid-specific genes, but lower expression of lymphoid genes (Figure 1). Hdchi HSCs also exhibited much greater responsiveness to myeloid, but not lymphoid, stimulants, thus defining a MB-HSC population (Figure 2–3). These data further support the notion that even within MB-HSCs, granulocytic and monocytic myeloid lineages can be distinguished at an early HSC stage.
MB-HSCs and progenitors respond quickly to leukopenia, triggered by LPS or direct myeloablative injury to BM (King and Goodell, 2011). Notably, such myeloid activation promoted Hdchi MB-HSCs and progenitors to enter the cell cycle, mobilized them into the circulation, and induced extramedullary hematopoiesis (Figure 2). Given the high expression of TLR4 on Hdc-GFPhi HSCs and HSPCs, and their increased number following LPS treatment (Figure 2), our results support a recent study that LPS can directly active the proliferation of HSC via TLR4 (Takizawa et al., 2017). Although LPS stimulation also can enhance the role of histamine/H2R axis through expansion of Hdc-GFPhi myeloid cells to enforce the quiescence of MB-HSCs, the increased myeloid demand may over time overwhelm the inhibitory effects of the feedback loop, leading to the depletion of Hdc-GFPhi HSCs (Figure 2C). Further studies are required to confirm whether this belongs to the indirect effects of LPS on the behaviors of HSC (Takizawa et al., 2017).
MB-HSC is normally a quiescent LT-HSC, based on its slowly cycling nature and reconstitution ability (Challen et al., 2010; Land et al., 2015; Morita et al., 2010). Although it has previously been proposed that lineage-biased HSCs reside and communicate in distinct niches, few details have been reported (Yu and Scadden, 2016). Our anatomical studies revealed direct contacts between MB-HSC and Hdchi myeloid descendants. Furthermore, we have shown that the quiescence and self-renewal of MB-HSCs were conferred by histamine in the niche (Figure 5). The MB-HSCs expressed high level of H2R, and the loss of histamine production in the niche as a result of either knockout of the Hdc gene or ablation of the Hdchi myeloid descendants led to increased proliferation of HSCs and progenitors, along with loss over time of MB-HSCs (Figure 4). The regulation of MB-HSC quiescence by myeloid lineage-derived histamine provides an elegant regulatory mechanism, such that the recruitment of myeloid cells out of BM by an infectious or injurious threat removes the inhibitory brake on MB-HSCs, thus awakening these stem cells from dormancy.
Given that histamine produced by Hdchi cells acted primarily through H2R on MB-HSC and progenitors, a selective H2 agonist, dimaprit dihydrochloride, was effective in vivo or in vitro to rescue MB-HSCs quiescence and improve their regenerative capacity (Figure 5 and Figure 6). Treatment with the H2 agonist prior to radiation injury protected MB-HSCs from depletion and significantly increased the lifespan and survival of lethally irradiated mice. Similarly, treatment with the exogenous H2 agonist profoundly increased the numbers of HdchiH2R+ stem cells and progenitor in LPS-induced sepsis and abrogated HSC depletion (Figure 6).
While the iDTR/DT ablation model has limitations, we found in this study that depletion of Hdchi myeloid cells had minimal effects on the Hdclo HSCs (Figure 5 and S5). Given the close spatial relationship between Hdchi myeloid cells and MB-HSCs, and evidence that the histamine/H2R axis regulates the quiescence of MB-HSC, we reason that iDTR/DT ablation of Hdchi myeloid cells and subsequent loss of the majority of the histaminergic niche is the cause of MB-HSC entering cell cycle. These findings favor the hypothesis that lineage-biased HSCs and progenitors are regulated in a lineage-dependent manner (Cordeiro Gomes et al., 2016).
Hdchi HSCs showed features consistent with previously identified MB-HSCs, such as CD150hiCD34−KLS cells, HSC-1, lower-SPKLS cells, CD86− HSCs, CD41+ HSCs, and vWF+ (von Willebrand factor) HSCs (Challen et al., 2010; Gekas and Graf, 2013; Iida et al., 2014; Morita et al., 2010; Oguro et al., 2013; Sanjuan-Pla et al., 2013). First, our study supports earlier findings that suggested that MB-HSC accounts for an extremely low number of total BM nucleated cells (around 0.002%). Second, consistent with the data regarding HSC-1 (Oguro et al., 2013), we found that Hdchi HSCs are more quiescent and can interconvert into other HSC subsets, but not vice versa. Third, we also found that aging led to an increase in the number of Hdchi HSCs, similar to results with lower-SPKLS (Challen et al., 2010). Although some earlier studies reported that MB-HSCs accounted for a higher (5.67% - 60%) proportion of HSCs, the Hdchi subset comprised only 10.3 ± 2.27% of all HSCs. However, CD150hiHSCs contained myeloid- (HSC-1) and lymphoid-biased (HSC-2) subcategories (Oguro et al., 2013), whereas our study suggests that the Hdchi population represents a more myeloid specific subset within the CD150hiHSCs pool. Further, in contrast to previous studies that primarily addressed surface markers and repopulation ability, we demonstrate here a clear role for the histamine/H2R axis in maintaining homeostasis and quiescence of the MB-HSCs pool.
In summary, Hdc labels a previously undefined but distinct MB-HSC that resides in the center of a cluster of mature Hdc-expressing myeloid cells. Homeostasis relies on a negative feedback histaminergic circuit, whereby histamine produced by Hdc-expressing cells inhibits active cycling in MB-HSCs through the H2R in a lineage-privileged cis-regulatory auto/paracrine fashion. The ablation of histamine-producing cells by genetic or other approaches leads to a loss of this inhibitory signal and exit from dormancy by the MB-HSCs. Mice deficient in histamine production (Hdc−/−) or lacking the receptor (H2R−/−) showed exaggerated responses to myeloid demand hematopoiesis and reductions in the MB-HSC and progenitor pool. Histaminergic signaling through the H2R on MB-HSC limits excessive proliferation and promotes self-renewal. Targeting the histamine/H2R axis may thus be useful therapeutically in protecting MB-HSCs from myelosuppressive injury and stem cell depletion.
STAR★METHODS
KEY RESOURCES TABLE
| REAGENT or RESOURCE | SOURCE | IDENTIFIER |
|---|---|---|
| Antibodies | ||
| Biotin anti-mouse CD2 | BioLegend | Cat#: 100103 RRID: AB_312650 |
| PerCP/Cy5.5 anti-mouse CD2 | BioLegend | Cat#: 100115 RRID: AB_2563501 |
| Biotin anti-mouse CD3 | BioLegend | Cat#: 100243 RRID: AB_2563946 |
| PerCP/Cy5.5 anti-mouse CD3 | BioLegend | Cat#: 100217 RRID: AB_1595597 |
| APC anti-mouse CD3 | BioLegend | Cat#: 100235 RRID: AB_2561455 |
| PE/Cy7 anti-mouse CD3 | BioLegend | Cat#: 100219 RRID: AB_1732068 |
| Biotin anti-mouse CD5 | BioLegend | Cat#: 100603 RRID: AB_312732 |
| PerCP/Cy5.5 anti-mouse CD5 | BioLegend | Cat#: 100623 RRID: AB_2563432 |
| Biotin anti-mouse CD8a | BioLegend | Cat#: 100703 RRID: AB_312742 |
| PerCP/Cy5.5 anti-mouse CD8a | BioLegend | Cat#: 100733 RRID: AB_2075239 |
| Biotin anti-mouse TER-119 | BioLegend | Cat#: 116203 RRID: AB_313704 |
| PerCP/Cy5.5 anti-mouse TER-119 | BioLegend | Cat#: 116227 RRID: AB_893638 |
| APC anti-mouse TER119 | BioLegend | Cat#: 116211 RRID: AB_313712 |
| Biotin anti-mouse Ly-6G/Ly-6C (Gr-1) | BioLegend | Cat#: 108403 RRID: AB_313368 |
| PerCP/Cy5.5 anti-mouse Ly-6G/Ly-6C (Gr-1) | BioLegend | Cat#: 108427 RRID: AB_893561 |
| APC/Cy7 anti-mouse Ly-6G/Ly-6C (Gr-1) | BioLegend | Cat#: 108423 RRID: AB_2137486 |
| Brilliant Violet 421™ anti-mouse Ly-6G/Ly-6C (Gr-1) | BioLegend | Cat#: 108433 RRID: AB_10900232 |
| Purified anti-mouse Ly-6G/Ly-6C (Gr-1) | BioLegend | Cat# 108401 RRID: AB_313366 |
| Biotin anti-mouse/human CD45R/B220 | BioLegend | Cat#: 103203 RRID: AB_312988 |
| APC/Cy7 anti-mouse/human CD45R/B220 | BioLegend | Cat#: 103223 RRID: AB_313006 |
| PerCP/Cy5.5 anti-mouse/human CD45R/B220 | BioLegend | Cat#: 103235 RRID: AB_893356 |
| Biotin anti-mouse CD41 | BioLegend | Cat#: 133930 RRID: AB_2572133 |
| APC anti-mouse CD41 | BioLegend | Cat#: 133913 RRID: AB_11126751 |
| APC anti-mouse CD31 | BioLegend | Cat#: 102409 RRID: AB_312904 |
| Biotin anti-mouse CD48 | BioLegend | Cat#: 103409 RRID: AB_528826 |
| APC anti-mouse CD48 | BioLegend | Cat#: 103411 RRID: AB_571996 |
| Biotin anti-mouse CD127 (IL-7Rα) | BioLegend | Cat#: 135005 RRID: AB_1953262 |
| PE anti-mouse CD127 (IL-7Rα) | BioLegend | Cat#: 135009 RRID: AB_1937252 |
| PerCP/Cy5.5 anti-mouse CD127 (IL-7Rα) | BioLegend | Cat#: 135021 RRID: AB_1937274 |
| APC/Cy7 anti-mouse CD117 (c-kit) | BioLegend | Cat#: 105825 RRID: AB_1626280 |
| PE/Cy7 anti-mouse Ly-6A/E (Sca-1) | BioLegend | Cat#: 122513 RRID: AB_756198 |
| PE anti-mouse CD150 (SLAM) | BioLegend | Cat#: 115903 RRID: AB_313682 |
| Brilliant Violet 785™ anti-mouse CD150 (SLAM) | BioLegend | Cat#: 115937 RRID: AB_2565962 |
| Anti-Mouse CD34 eFluor ® 660 | eBioscience | Cat#: 50-0341-80 RRID: AB_10609352 |
| PE anti-mouse CD16/32 | BioLegend | Cat#: 101307 RRID: AB_312806 |
| PE anti-mouse CD135 | BioLegend | Cat#: 135305 RRID: AB_1877218 |
| APC anti-mouse CD135 | BioLegend | Cat#: 135309 RRID: AB_1953264 |
| PE anti-mouse CD201 (EPCR) | BioLegend | Cat#: 141503 RRID: AB_10899579 |
| APC anti-mouse CD201 (EPCR) | BioLegend | Cat#: 141505 RRID: AB_2561361 |
| PE/Cy7 anti-mouse CX3CR1 | BioLegend | Cat#: 149015 RRID: AB_2565699 |
| PE anti-mouse CD115 | BioLegend | Cat#: 135505 RRID: AB_1937254 |
| APC anti-mouse/human CD11b | BioLegend | Cat#: 101211 RRID: AB_312794 |
| PerCP/Cy5.5 anti-mouse CD45.1 | BioLegend | Cat#: 110727 RRID: AB_893348 |
| Brilliant Violet 785™ anti-mouse CD45.1 | BioLegend | Cat#: 110743 RRID: AB_2563379 |
| Pacific Blue™ anti-mouse CD45.2 | BioLegend | Cat#: 109819 RRID: AB_492873 |
| PE anti-mouse CD45.2 | BioLegend | Cat#: 109807 RRID: AB_313444 |
| PE anti-mouse CD45 | BioLegend | Cat#: 103105 RRID: AB_312970 |
| APC anti-mouse CD45 | BioLegend | Cat#: 103111 RRID: AB_312976 |
| PE anti-BrdU Antibody | BioLegend | Cat#: 339811 RRID: AB_1626188 |
| PE anti-mouse Ki-67 | BioLegend | Cat#: 652403 RRID: AB_2561524 |
| Anti-Ki67 antibody | Abcam | Cat#: ab16667 RRID: AB_302459 |
| Anti-GFP antibody | Abcam | Cat#: ab13970 RRID: AB_300798 |
| RFP Antibody Pre-adsorbed | Rockland Immunochemicals | Cat#: 600-401-379 RRID: AB_2209751 |
| Anti-Laminin 1+2 antibody | Abcam | Cat#: ab7463 RRID: AB_305933 |
| Goat anti-Chicken, Alexa Fluor 488 | Thermo Fisher Scientific | Cat# A-11039 |
| Alexa Fluor® 405 Streptavidin | Thermo Fisher Scientific | Cat# S32351 |
| Goat anti-Rabbit IgG, Alexa Fluor 594 | Thermo Fisher Scientific | Cat# R37117 |
| Chemicals, Peptides, and Recombinant Proteins | ||
| HBSS – Hank’s Balanced Salt Solution | Gibco | 14175079 |
| DPBS, no calcium, no magnesium | Gibco | 14190250 |
| Minimum Essential Medium (MEM) Alpha Medium | Corning | 10-022-CV |
| Fetal Bovine Serum | Gibco | 16140071 |
| RBC Lysis Buffer (10X) | BioLegend | 420301 |
| Collagenase, Type 4 | Worthington Biochemical Corporation | LS004186 |
| DNase I | Roche Diagnostics | 3724778103 |
| BD Horizon BrilliantTM Stain Buffer | BD Biosciences | 563794 |
| Recombinant Mouse SCF (carrier-free) | BioLegend | 579702 |
| Recombinant Mouse Thrombopoietin (TPO) | BioLegend | 593302 |
| Recombinant Mouse GM-CSF | BioLegend | 576302 |
| Recombinant Mouse IL-6 | BioLegend | 575702 |
| Recombinant Mouse IL-7 | BioLegend | 577802 |
| Recombinant Mouse IFN-γ | BioLegend | 575302 |
| ProLong® Gold Antifade Mountant | Thermo Fisher Scientific | P36934 |
| DAPI Solution | BD Pharmingen | 564907 |
| Hoechst 33342 Solution | BD Pharmingen | 561908 |
| LPS-EB Ultrapure | InvivoGen | tlrl-3pelps |
| Histamine dihydrochloride | Tocris Bioscience | 3545 |
| Dimaprit dihydrochloride | Tocris Bioscience | 506 |
| ICI 162,846 | Tocris Bioscience | 833 |
| 5-Fluorouracil | Sigma-Aldrich | 3738 |
| TAM Diet | Envigo Teklad Diets | TD.130859 |
| Diphtheria Toxin | List Biological Labs | 150 |
| Percoll | GE Healthcare | 17-0891-01 |
| Critical Commercial Assays | ||
| BrdU Flow Kits | BD Pharmingen | 552598 |
| Histamine ELISA kit | Enzo Life Sciences | ENZ-KIT140-0001 |
| IL6 ELISA kit | Thermo Fisher Scientific | KMC0061 |
| IL7 ELISA kit | Thermo Fisher Scientific | EMIL7 |
| IFN-γ ELISA kit | Thermo Fisher Scientific | 88-8314-22 |
| SMARTer Ultra Low Input RNA Kit for Sequencing | Clontech Laboratories | 634849 |
| Nextera XT DNA Library Preparation Kit | Illumina | FC-131-1024 |
| CD117 MicroBeads | Miltenyi Biotec | 130-091-224 |
| MidiMACS™ Separator and Starting Kits | Miltenyi Biotec | 130-042-301 |
| RNeasy Micro Kit | QIAGEN | 74004 |
| ARCTURUS PicoPure RNA Isolation Kit | Thermo Fisher Scientific | KIT0204 |
| SuperScript III First-Strand Synthesis System | Thermo Fisher Scientific | 18080051 |
| PrimeTime qPCR Assays | Integrated DNA Technologies | N/A |
| FastStart Universal SYBR Green Master (Rox) | Roche Molecular Systems | 4913850001 |
| GeneChip® Mouse Genome 430 2.0 Array | Thermo Fisher Scientific | 900497 |
| CryoJane Tape-Transfer system | Leica Biosystems | N/A |
| MethoCult™ GF M3434 | STEMCELL Technologies | 3444 |
| MethoCult™ GF M3534 | STEMCELL Technologies | 3534 |
| MethoCult™ M3630 | STEMCELL Technologies | 3630 |
| Deposited Data | ||
| GEO: Gene expression comparison between bone marrow Hdc-GFPhiCD11b+Gr1+ and Hdc-GFPloCD11b+Gr1+ | N/A | GSE79728 |
| GEO: Gene expression comparison between bone marrow N/A Hdc-GFPhiCD11b+Gr1hi and Hdc-GFPhiCD11b+Gr1lo | GSE80143 | |
| GEO: Gene expression comparison between bone marrow Hdc-GFPhi HSCs and Hdc-GFPlo HSCs | N/A | GSE90787 |
| GEO: Gene expression comparison between bone marrow Hdc-GFPhi HSPCs and Hdc-GFPlo HSPCs | N/A | GSE80092 |
| GEO: Gene expression comparison between bone marrow Hdc−/− HSPCs and WT HSPCs | N/A | GSE80284 |
| Experimental Models: Organisms/Strains | ||
| Mouse: C57BL/6J | The Jackson Laboratory | Stock No: 000664 |
| Mouse: B6.SJL-Ptprca Pepcb/BoyJ | The Jackson Laboratory | Stock No: 002014 |
| Mouse: Gt(ROSA)26Sortm9(CAG-tdTomato)Hze/J | The Jackson Laboratory | Stock No: 007909 |
| Mouse: C57BL/6-Gt(ROSA)26Sortm1(HBEGF)Awai/J | The Jackson Laboratory | Stock No: 007900 |
| Mouse: Hdc-CreERT2 | This paper | N/A |
| Software and Algorithms | ||
| ELDA: Extreme Limiting Dilution Analysis | Hu, Y, and Smyth, GK (2009) | http://bioinf.wehi.edu.au/software/elda/ |
| ImageJ version1.51h | N/A | http://imagej.net |
| Fiji version 2.0.0-rc54 | N/A | http://imagej.net |
| Random_spots_noROI.py | This paper | https://github.com/theresaswayne/random-cells |
| FlowJo | FlowJo | https://www.flowjo.com |
| GraphPad Software | GraphPad Software | http://graphpad.com |
CONTACT FOR REAGENTS AND RESOURCE SHARING
Further information and requests for resources and reagents should be directed to and will be fulfilled by the Lead Contact, Timothy C. Wang (tcw21@columbia.edu).
EXPERIMENTAL MODEL AND SUBJECT DETAILS
Mice
C57BL/6 background Hdc-GFP, Hdc−/− and H2R−/− mice have been described previously (Yang et al., 2011). Hdc-GFP was crossed to Hdc−/− or H2R−/− to generate Hdc−/−; Hdc-GFP or H2R−/−; Hdc-GFP mice, respectively. In these transgenic mouse lines, the Hdc or H2R gene was inactivated by neomycin replacement, and the Hdc-GFP transgenic reporter indicates Hdc-expressing cells. In some experiments, Hdc-GFP was crossed to Cxcl12-DsRed mice to generate Hdc-GFP; Cxcl12-DsRed mice (Ding and Morrison, 2013). The Hdc-CreERT2 transgenic line was generated by using bacterial artificial chromosome (BAC) recombineering from clone RP23-474H6. Founders were backcrossed to C57BL/6 mice for at least six generations. Hdc-CreERT2 was mated to Rosa26-CAG-loxp-stop-loxp-tdTomato (tdTomato) and Rosa26-loxp-stop-loxp-iDTR (iDTR) mice for generating Hdc-CreERT2; tdTomato and Hdc-CreERT2; tdTomato; iDTR mice. C57BL/6 WT mice and C57BL/6-SJL (CD45.1) bone marrow transplantation recipient mice were purchased from the Jackson Laboratory. Both male and female mice were used in all studies. In order to minimize aging-related myeloid-biased effects, young (4-month-old) transgenic miceand their littermates were used in the majority of experiments. 16-month-old Hdc-GFP and C57BL/6 WT mice were used to evaluate the effect of aging on the number of hematopoietic lineage cells.
Mice were observed carefully by laboratory staff and veterinarian personnel for health and activity. Mice were monitored to ensure that food and fluid intake meets their nutritional needs. Body weights were recorded at minimum weekly, and more often for animals requiring greater attention. Mice were maintained on wood chip bedding, and given ad libitum access to water and standard mouse chow, with 12-hour light/dark phase cycles. The colonies were specific pathogen free (SPF) and tested quarterly for known pathogens. Mice in the barrier facilities are housed in cages with microisolator tops on ventilated or static racks. All caging materials and bedding are autoclaved. Food is irradiated and water is either RO, autoclaved or acidified, depending on the barrier. All manipulations are performed in laminar flow hoods. Once animals are removed from a barrier, they are not returned. All personnel wear shoe covers, gloves, hair bonnets and gowns. All mouse studies were approved by the Columbia University Institutional Animal Care and Use Committee.
METHOD DETAILS
Flow cytometry analysis and cell sorting
Mouse bones were flushed or crushed using mortar and pestle with Ca2+ and Mg2+ free HBSS supplemented 2% heat-inactivated fetal bovine serum. For hematopoietic stem cells and progenitors sorting, bone marrow mononuclear cells were first purified by 40:80 Percoll gradient centrifugation followed by CD117 MicroBeads enrichment (Miltenyi Biotec). The enriched progenitor cells were sorted twice based on the HSC or HSPC surface markers. The experiments only proceeded if the final purity was >96% as demonstrated during re-sorting (Figure S1A). Single cell suspension from spleen was obtained by mashing the tissue by a syringe plunger end against a cell strainer. Blood was collected in EDTA-containing Tubes (BD Diagnostics) through the puncture of submandibular vein. Red blood cells were lysed (RBC lysis buffer, BioLegend) before passing through a 70 μm nylon mesh. Hematopoietic stem and progenitor cells, BM stromal endothelial cells, mesenchymal progenitor cells, and BM stromal endothelial cells were defined by immunophenotype. HSPC: Lin−c-kit+Sca-1+, LSK; HSC: LSKCD150+CD48−; CMP: Lin−IL-7Ra−c-kit+Sca-1−CD34+CD16/32lo; GMP: Lin−IL-7Ra−c-kit+Sca-1−CD34+CD16/32hi; MEP: Lin−IL-7Ra−c-kit+Sca−1-CD34−CD16/32lo; MDP: Lin−Flt-3+c-kithiCD115+CX3CR1+; CDP: Lin−Flt-3+c-kitloCD115+Cx3cr1+; CLP: Lin−c-kitloSca-1loFlt-3+IL-7Ra+; myeloid cell: CD11b+Gr1+; bone marrow stromal endothelial cells (CD45−Ter119−CD31+) and mesenchymal progenitor cells (CD45−Ter119−CD31−). In IFN-γ-related experiments, Sca-1 was excluded from the stem and lineage-specific progenitor cell staining scheme because of its non-specific expression. The combination of LKCD150+CD48−CD34−Flt-3−EPCR+ was used to define HSC (Matatall et al., 2016). Following antibodies were used: CD150 (TC15-12F12.2), CD48 (HM48-1), c-kit (2B8), Sca-1 (E13-161.7), CD34 (RAM34), CD16/32 (FcγR, 93), CD127 (IL7Ra, A7R34), CD135 (Flt-3, A2F10), CD115 (CSF-1R, AFS98), CD201 (EPCR, RCR-16), and CX3CR1 (SA011F11). Lineage cells were stained by using CD2 (RM2-5), CD3 (17A2), CD5 (53-7.3), CD8a (53-6.7), TER-119 (TER-119), B220 (RA3-6B2), and Gr1 (RB6-8C5). Other antibodies used in this study include CD41 (MEReg30), CD31 (MEC 13.3), CD11b (M1/70), CD45 (30-F11), CD45.1 (A20) and CD45.2 (104). For mouse bone stroma flow analysis, collagenase IV (Worthington Biochemical Corporation) and DNase I (Roche Diagnostics) were used to digest the marrow flushed long bones (Ding and Morrison, 2013). Supernatants from enzymatically digested mouse bones were filtered, washed and antibody-stained. DAPI (4′,6-Diamidino-2-Phenylindole, Dihydrochloride) was used to exclude dead cells. For cell cycle analysis, sorted GFPhi or GFPlo cells were first stained with cell surface markers, then fixed and permeablized (BD cytofix/cytoperm solutions), followed by staining with anti-Ki67 (16A8) and Hoechst 33342 (BD Pharmingen). For BrdU incorporation experiments, Hdc-GFPhi and Hdc-GFPlo cells were separated and analyzed by using BD Pharmingen™ BrdU Flow Kits, according to manufacturer’s instructions. All FACS analyses were performed on LSRII or LSRFortessa instrument. BD Influx cell sorter was used for cell sorting.
Bone marrow transplantation
Recipient CD45.1 mice were lethally irradiated (11 Gy, two split doses, at least 6 hours apart) using a Cesium 137 irradiator (Mark I-30, JL Shepherd and Associates). Sorted HSCs, HSPCs, or unfractionated bone marrow cells were injected intravenously along with CD45.1 competitor bone marrow cells. For single HSC transplantation, single Hdc-GFPhi or Hdc-GFPlo HSCs from bone marrow of Hdc-GFP mice were sorted directly into X-VIVOTM 15 medium (supplemented with 50 ng/ml of SCF and TPO). Single HSC was confirmed visually by using a microscope and then were transferred along with 2 × 10⁵ CD45.1 whole bone marrow cells into lethally irradiated recipients. Flow analysis 16 to 32 weeks post transplantation of recipient blood showing ≥ 0.1% CD45.2 donor contribution is defined as the successful reconstitution. To compare the reconstitution capacity of Hdc-GFPhi and Hdc-GFPlo HSPCs affected by irradiation, 1500 sorted donor Hdc-GFPhi or Hdc-GFPlo HSPCs were 3 Gy irradiated and then transplanted along with 2 × 10⁵ whole recipient bone marrow cells. In some experiments, donor mice were pretreated with either PBS or H2 agonist and irradiated (3 Gy) before bone marrow Hdc-GFPhi cells were harvested and transplanted with the same numbers of Sca-1-depleted recipient bone marrow cells. Recipient mice were bled between 4 to 8 weeks intervals starting from the fourth week after transplantation. Multiple-lineage cells were assessed by flow analysis. Secondary bone marrow transplantation was performed by injecting 5 million unfractionated bone marrow cells from the primary recipients of 20 HSCs transplantations into lethally irradiated CD45.1 secondary recipient mice. Secondary peripheral blood multiple-lineage reconstitution was assessed from 4 weeks after transplantation. Limiting dilution assays comparing Hdc-GFPhi and Hdc-GFPlo HSCs were performed by analyzing recipient groups to which 20 or 50 HSCs were transplanted. HSC frequencies of non-responders were calculated using the criterion of < 1% donor contribution.
Hematopoietic stem cells and progenitors colony-forming assay
Bulk or single cells were sorted into methylcellulose culture medium (Stemcell Technology). Myeloid colony-forming capacity was assessed by MethoCult™ GF M3534 for myeloid committed progenitors. HSC colony-forming capacity was tested by using MethoCult™ GF M3434. HSPC Pre-B colony formation was modified by supplementing MethoCult™ M3630 medium with recombinant mouse IL-7 (BioLegend) and SCF (BioLegend) as described previously.
In vivo treatments
Mouse recombinant IFN-γ (BioLegend), IL-6 (BioLegend), and IL-7 (BioLegend) were injected intravenously at 5 μg/mouse. LPS-EB (InvivoGen) was injected intravenously at 0.25 mg/kg body weight. BM and spleen cells were harvested from LPS-challenged mice at 24 hours. In BrdU incorporation experiments, 1mg of BrdU (BD Biosciences) per 6 g body weight was injected intraperitoneally to either Hdc-GFP or Hdc−/−; Hdc-GFP mice. BrdU incorporation was detected 14 hours after injection by using the BD Biosciences BrdU flow kit. For sepsis injury protection experiments, the H2 agonist dimaprit dihydrochloride (Tocris Bioscience) was intraperitoneally injected twice a day for 5 consecutive days after 0.5 mg/kg LPS injection. For myeloid depletion experiments, 250 ng DT (List Biological Labs) was injected intraperitoneally every other day for one week. DT injections combined with a tamoxifen chow (Harlan Laboratories) regimen, was applied to deplete Hdc+ myeloid cells in Hdc-CreERT2; tdTomato; iDTR mice. In some Hdc-DTR groups, 6 millions of Hdc+/+; Hdc-GFPhi or Hdc−/−; Hdc-GFPhiCD11b+Gr1+ myeloid cells were transferred one day after DT treatment. For Gr1+ myeloid depletion, Hdc-GFP mice were injected intravenously 100μg anti-Gr1 (RB6-8C5, BioLegend) or rat IgG2b control (RTK4530, BioLegend) daily for 3 days. 5-FU (Sigma) was diluted in PBS and injected intravenously at 250 mg/kg. Bone marrow and blood were sampled from Hdc−/− and WT mice at 5 days. In irradiation protection experiments, 100 μg/mouse H2 agonist or PBS was injected twice per day for 10 consecutive days prior to irradiation.
Quantitative RT-PCR
Hematopoietic stem cells, progenitors, and myeloid cells were sorted directly into the lysis buffer supplied from either RNeasy Micro kit (Qiagen) or ARCTURUS PicoPure RNA isolation kit (Life Technologies). RNA was prepared following the manufacturer’s instructions. cDNA was synthesized with a mixture of random and Oligo dT primers using SuperScript III Reverse Transcriptase (Life Technologies). Gene expression was determined using either PrimeTime qRT-PCR probe-based Assays (Integrated DNA Technologies) or FastStart Universal SYBR Green Assays (Roche Applied Science). Primers and probes sets for measuring cDNA expression include mouse Hdc (Mm.PT.58.41686379.g), H1R (Mm.PT.58.42325479, Mm.PT.58.41154457, and Mm.PT.58.43886611), H2R (Mm.PT.58.31195142), H3R (Mm.PT.58.32340939), H4R (Mm.PT.58.5634810) and Hprt (Mm.PT.58.32092191). Primer sequences of SYBR Green PCR assays are listed in Table S1. Quantitative PCR was performed with the Applied Biosystems Prism 9700 PCR machine. Relative gene expression was normalized to either Hprt or Gapdh.
RNA-seq analysis
Sorted HSCs (500 of each Hdc-GFPhi or Hdc-GFPlo) and HSPCs (2000 of each Hdc-GFPhi or Hdc-GFPlo, or 2000 of each WT or Hdc−/−) were lysed in RNA lysis buffer supplied in ARCTURUS PicoPure RNA isolation kit (Life Technologies). Total RNA was isolated in accordance with manufacturer’s protocol. cDNA was amplified, and libraries were constructed by using SMARTer Ultra Low Input RNA Kit (Clontech Laboratories) and Nextera XT DNA Library Preparation Kit (Illumina) according to the respective manufacturer’s instructions. Sequencing was performed with Hiseq 2500 (Illumina).
Microarray gene expression profiling
Fractions of bone marrow myeloid cells were isolated from Hdc-GFP mice long bones by flow sorting using combinations of myeloid cell surface makers including CD11b, Gr1, and GFP. Total mRNA was purified by using RNeasy Micro kit (Qiagen) according to the manufacturer’s instructions. RNA was labeled by using the 3′ IVT Expression Kit before hybridized to the Affymetrix GeneChip mouse genome 430 2.0 array. Arrays were scanned on an Affymetrix Scanner 3000-7G scanner with GCOS software.
Cell culture and protein detection
Prepared bone marrow stromal cells were washed and passed through a 70 m nylon mesh to get single layer cells. Cells were then rinsed and plated in Minimum Essential Media (Gibco) supplemented with 20% fetal bovine serum and 1% penicillin and streptomycin (Gibco). Cells were passed three times over 17 days to enrich and expand adhesive stromal cells. Sorted GFPhi or GFPlo fractions of Lin-c-kit+Sca-1+ HSPCs were added and cultured for an additional 7-10 days. In some groups, histamine (Tocris Bioscience), H2 agonist, or the H2 antagonist ICI 162,846 (Tocris Bioscience) were added. For triple cultures, CD11b+Gr1hi myeloid cells (GFP+ or GFP−) were added along with HSPCs. After culturing, Hdc-GFPhi cells were recorded, counted, and flow analyzed by combinations of hematopoietic cell surface markers. For analyzing the HSPC cell cycle after culturing, HSPCs were sorted, fixed and permeablized before being stained with Ki67 and Hoechst 33342. In HSCs stability assays, 4 × 10³ Hdc-GFPhi HSCs were harvested from the BM of Hdc-GFP mice and seeded into RPMI1640 with 20% FBS, 50 ng/ml recombinant mouse SCF, 10 ng/ml recombinant mouse IL-3, and 10 ng/ml recombinant mouse IL-6. After cultured for 5 days, the cells were analyzed with the same templates used in sorting. LPS treatment experiments, fractions of HSCs and CD11b+Gr1+ myeloid cells were sorted into X-VIVO™ 15 medium. SCF and TPO (both from BioLegend) were added to HSC culture at 50 ng/ml concentration. 10 ng/ml GM-CSF (BioLegend) was added to the myeloid cell culture. LPS (1 μg/ml, LPS-EB Ultrapure, InvivoGen) was added 12 hours after cells were plated. The supernatant was collected 6 hours after LPS treatment. In some experiments, mouse femur cell-free bone marrow supernatant was collected. Proteins from serum or bone marrow supernatant were measured by using ELISA Kit (Histamine: Enzo Life Science; IL6, IL7, and IFN-γ: Thermo Fisher Scientific) according to manufacturer’s protocol.
Immunofluorescence microscopy
Dissected mouse femora and spleen were fixed in 4% PFA, embedded in OCT, and snap frozen in liquid nitrogen. Bones were sectioned using CryoJane Tape-Transfer system (Leica Biosystems). Slides were permeabilized with 0.5% TritonX-100 in PBS and blocked with blocking buffer. Primary antibodies were applied for overnight staining. AlexaFluor secondary antibodies (Invitrogen) were used to reveal the staining. All slides were counterstained and mounted with ProLong anti-fade mounting medium (Invitrogen). Images were acquired with an A1 laser scanning confocal attachment on an Eclipse Ti microscope stand (Nikon Instruments, Melville, NY).
Reproducibility
Experimental results were replicated at least once, unless otherwise indicated. Sample sizes for each study were estimated on the basis of the expected differences and previous experience with the particular assay. Power calculations were performed when needed. In most cases, studies were performed on genotype positive litters, with genotype negative litters used as controls. Blinding was not deemed to be required for most studies.
QUANTIFICATION AND STATISTICAL ANALYSIS
Statistical analysis was performed to detect the significance of differences in means of the abundance of mRNA or cell types, or of survival, in the different conditions being compared. All data are shown as the mean ± SEM. Kaplan-Meier survival was statistically analyzed by Logrank test. Other statistical comparisons were evaluated with Student’s t-test or one-way ANOVA. Statistical analysis was performed using Prism 7 (Graphpad). Significance levels were set at *p < 0.05; **p < 0.01; ***p < 0.001; n.s., not significant. n.d., not detectable. n indicates biological replicates. For each experiment the specific statistical details can be found in the figure legends.
Gene expression microarray analysis
A battery of quality test was performed to test the quality of the arrays. Samples were normalized using the GCRMA algorithm, and the statistical significance of differential expression was estimated using Linear Models for MicroArrays (Limma). A significance cutoff of a Benjamini-Hochberg false discovery rate, fdr ≤ 0.05 was used (Benjamini and Hochberg, 1995). This analysis was performed using the Bioconductor platform in the R statistical computing environment.
Analysis of RNA-seq data
30M single-end reads per sample were taken. Sequenced reads were mapped to the NCBI annotated genes of the mm9 assembly of the mouse genome with BowTie2 and TopHat 2.0.4. Expression datasets are available in Gene Expression Omnibus (GEO). The statistical significance of differential expression was estimated with weighted Limma-Voom for HPSCs or Deseq2 for HSCs both of which run under Bioconductor/R. A significance cutoff of fdr ≤ 0.05 was used, except specifically mentioned otherwise. Significantly differentially expressed genes (fdr ≤ 0.05 and absolute value of log2 fold change ≥ 0.6, were assigned to Biological Process Gene Ontology (GO) categories and KEGG pathways with iPathwayGuide. GO categories and pathways relevant to biological processes under discussion were chosen for further investigation.
Computational modeling of HSC distribution
MB-HSC was identified by GFP+CD150+Lin−CD41−CD48− (represented as “yellow” cells, since they stain for green (GFP), and red (CD150), but not blue (Lineage, CD41, CD48) on Hdc-GFP mouse bone sections. Next, an MB-HSC/myeloid cluster was defined by the presence of direct contact between an MB-HSC with at least 2 GFP+CD150− myeloid cells. All MB-HSCs found in a given section were scored and marked using the Fiji distribution of ImageJ, and the percentage of such MB-HSCs that were present in MB-HSC/myeloid clusters was calculated. To assess whether the observed cluster localization could have occurred by chance we used methods similar to those in previously published work (Bruns et al., 2014; Cordeiro Gomes et al., 2016). Simulated images were generated using an ImageJ Python script (available from https://github.com/theresaswayne/random-cells). For each confocal image field analyzed, spots were placed randomly on the tissue area in the CD150 (red) channel and overlaid on the GFP channel. The size and density (number per μm2) of the randomized spots were set to match the size and density of observed MB-HSCs in the original image. The spots were also constrained not to overlap with each other. These simulated images were then scored for their co-location within the above mentioned “cluster.” In total, 2480 random spots and 541 MB-HSCs were analyzed.
DATA AND SOFTWARE AVAILABILITY
Microarray data have been deposited in the Gene Expression Omnibus (GEO) under the following accession numbers: Hdc-GFPhiCD11b+Gr1+ and Hdc-GFPloCD11b+Gr1+ cells (GSE79728) and for Hdc-GFPhiCD11b+Gr1hi and Hdc-GFPhiCD11b+Gr1lo cells (GSE80143). RNA-Seq data has been deposited in the GEO under the following accession numbers: Hdc-GFPhi HSCs and Hdc-GFPlo HSCs (GSE90787), Hdc-GFPhi HSPCs and Hdc-GFPlo HSPCs (GSE80092), and Hdc−/− HSPCs and WT HSPCs (GSE80284).
Supplementary Material
Acknowledgments
This work was supported by NIH NIDDK to T.C.W. (5R01DK048077) and NHLBI to S.M. (5R01HL115145). Huan Deng was supported by the grant from the National Science Foundation of China (81770624). Moritz Middelhoff was supported by a postdoctoral fellowship grant from the Mildred-Scheel-Stiftung, Deutsche Krebshilfe, Germany (70111870). Hongshan Wang was supported by the Shanghai Pujiang Program of China (16PJ1401900). Ryota Takahashi was supported by Uehara Memorial Foundation. We thank Dr. Kazuhiko Yanai and Dr. Takeo Yoshikawa from Tohoku University School of Medicine, Japan for providing H2R−/− mice. We thank Dr. Caisheng Lu and Dr. Wei Wang from the CCTI Flow Cytometry Core (supported in part by the Office of the Director, National Institutes of Health, under awards S10OD020056 and S10RR027050). Images were collected and analyzed at the Confocal and Specialized Microscopy Shared Resource of the Herbert Irving Comprehensive Cancer Center at Columbia University, supported by NIH grant #P30 CA013696 (National Cancer Institute). We thank Dr. Xiangdong Yang, Ms. Sarah Stokes, and Ms. Ashlesha Muley for helping to generate the Hdc-CreERT2 construct. We gratefully acknowledge Dr. Lei Ding at Columbia University for the discussions and providing the Cryojane system for the preparation of mouse bone sections. We also thank Dr. Jianchun Chen at Columbia University for the discussions. Finally, we express our greatest appreciation and admiration for Dr. Xiaowei Chen, who devoted his postdoctoral career to this study, and made most of the original observations reported here. He sadly passed away in April of 2017, during the revision of this manuscript.
Footnotes
Publisher's Disclaimer: This is a PDF file of an unedited manuscript that has been accepted for publication. As a service to our customers we are providing this early version of the manuscript. The manuscript will undergo copyediting, typesetting, and review of the resulting proof before it is published in its final citable form. Please note that during the production process errors may be discovered which could affect the content, and all legal disclaimers that apply to the journal pertain.
SUPPLEMENTAL INFORMATION
Supplemental Information includes seven figures and one table.
AUTHOR CONTRIBUTIONS
X.C. and H. D. conceptualized and designed the study, performed the experiments, interpreted the data, and wrote the manuscript. M.J.C., X.D., S.H.H., S.V.S., P.T., Z. J. and F.B. contributed to flow cytometric analysis or cell cultures. T.H.C., T.S., and L.M. acquired and computationally analyzed fluorescence confocal images. R.A.F., H.X.D., A.L.E.W., and A.C. performed and analyzed RNA-Seq and microarray experiments. L.L.L., M.M., and R.A.F. also participated in the manuscript writing. K.K.N., Y.H.T, H.L., Z.N., H.W., W.C., R.T., B.W.R, and Y.H. participated in mouse handling, irradiation, or bone marrow transplantation. S.R. provided expertise on the bone section and immunostaining. D.L.W., C.B.W., S.A., C.S.L., and H.W.S. contributed to transgenic mouse constructor design or manuscript revision. T.C.W. and S.M. supervised the project including study design, data interpretation, and manuscript writing.
References
- Alcaniz L, Vega A, Chacon P, El Bekay R, Ventura I, Aroca R, Blanca M, Bergstralh DT, Monteseirin J. Histamine production by human neutrophils. FASEB J. 2013;27:2902–2910. doi: 10.1096/fj.12-223867. [DOI] [PubMed] [Google Scholar]
- Ardi VC, Kupriyanova TA, Deryugina EI, Quigley JP. Human neutrophils uniquely release TIMP-free MMP-9 to provide a potent catalytic stimulator of angiogenesis. Proc Natl Acad Sci U S A. 2007;104:20262–20267. doi: 10.1073/pnas.0706438104. [DOI] [PMC free article] [PubMed] [Google Scholar]
- Beerman I, Maloney WJ, Weissmann IL, Rossi DJ. Stem cells and the aging hematopoietic system. Current opinion in immunology. 2010;22:500–506. doi: 10.1016/j.coi.2010.06.007. [DOI] [PMC free article] [PubMed] [Google Scholar]
- Benjamini Y, Hochberg Y. Controlling the false discovery rate; A practical and powerful approach to multiple testing. J Roy Stat Soc Ser B. 1995;57:289–300. [Google Scholar]
- Broxmeyer HE, Hoggatt J, O’Leary HA, Mantel C, Chitteti BR, Cooper S, Messina-Graham S, Hangoc G, Farag S, Rohrabaugh SL, et al. Dipeptidylpeptidase 4 negatively regulates colony-stimulating factor activity and stress hematopoiesis. Nat Med. 2012;18:1786–1796. doi: 10.1038/nm.2991. [DOI] [PMC free article] [PubMed] [Google Scholar]
- Brune M, Castaigne S, Catalano J, Gehlsen K, Ho AD, Hofmann WK, Hogge DE, Nilsson B, Or R, Romero AI, et al. Improved leukemia-free survival after postconsolidation immunotherapy with histamine dihydrochloride and interleukin-2 in acute myeloid leukemia: results of a randomized phase 3 trial. Blood. 2006;108:88–96. doi: 10.1182/blood-2005-10-4073. [DOI] [PubMed] [Google Scholar]
- Bruns I, Lucas D, Pinho S, Ahmed J, Lambert MP, Kunisaki Y, Scheiermann C, Schiff L, Poncz M, Bergman A, et al. Megakaryocytes regulate hematopoietic stem cell quiescence through CXCL4 secretion. Nat Med. 2014;20:1315–1320. doi: 10.1038/nm.3707. [DOI] [PMC free article] [PubMed] [Google Scholar]
- Busch K, Klapproth K, Barile M, Flossdorf M, Holland-Letz T, Schlenner SM, Reth M, Hofer T, Rodewald HR. Fundamental properties of unperturbed haematopoiesis from stem cells in vivo. Nature. 2015;518:542–546. doi: 10.1038/nature14242. [DOI] [PubMed] [Google Scholar]
- Challen GA, Boles NC, Chambers SM, Goodell MA. Distinct hematopoietic stem cell subtypes are differentially regulated by TGF-beta1. Cell Stem Cell. 2010;6:265–278. doi: 10.1016/j.stem.2010.02.002. [DOI] [PMC free article] [PubMed] [Google Scholar]
- Chen X, Takemoto Y, Deng H, Middelhoff M, Friedman RA, Chu TH, Churchill MJ, Ma Y, Nagar KK, Tailor YH, et al. Histidine decarboxylase (HDC)-expressing granulocytic myeloid cells induce and recruit Foxp3+ regulatory T cells in murine colon cancer. Oncoimmunology. 2017;6:e1290034. doi: 10.1080/2162402X.2017.1290034. [DOI] [PMC free article] [PubMed] [Google Scholar]
- Cheung TH, Rando TA. Molecular regulation of stem cell quiescence. Nat Rev Mol Cell Biol. 2013;14:329–340. doi: 10.1038/nrm3591. [DOI] [PMC free article] [PubMed] [Google Scholar]
- Cordeiro Gomes A, Hara T, Lim VY, Herndler-Brandstetter D, Nevius E, Sugiyama T, Tani-Ichi S, Schlenner S, Richie E, Rodewald HR, et al. Hematopoietic Stem Cell Niches Produce Lineage-Instructive Signals to Control Multipotent Progenitor Differentiation. Immunity. 2016;45:1219–1231. doi: 10.1016/j.immuni.2016.11.004. [DOI] [PMC free article] [PubMed] [Google Scholar]
- De Bacco F, Luraghi P, Medico E, Reato G, Girolami F, Perera T, Gabriele P, Comoglio PM, Boccaccio C. Induction of MET by ionizing radiation and its role in radioresistance and invasive growth of cancer. J Natl Cancer Inst. 2011;103:645–661. doi: 10.1093/jnci/djr093. [DOI] [PubMed] [Google Scholar]
- de Bruin AM, Libregts SF, Valkhof M, Boon L, Touw IP, Nolte MA. IFNgamma induces monopoiesis and inhibits neutrophil development during inflammation. Blood. 2012;119:1543–1554. doi: 10.1182/blood-2011-07-367706. [DOI] [PubMed] [Google Scholar]
- Dias S, Silva H, Jr, Cumano A, Vieira P. Interleukin-7 is necessary to maintain the B cell potential in common lymphoid progenitors. J Exp Med. 2005;201:971–979. doi: 10.1084/jem.20042393. [DOI] [PMC free article] [PubMed] [Google Scholar]
- Ding L, Morrison SJ. Haematopoietic stem cells and early lymphoid progenitors occupy distinct bone marrow niches. Nature. 2013;495:231–235. doi: 10.1038/nature11885. [DOI] [PMC free article] [PubMed] [Google Scholar]
- Dutta P, Sager HB, Stengel KR, Naxerova K, Courties G, Saez B, Silberstein L, Heidt T, Sebas M, Sun Y, et al. Myocardial Infarction Activates CCR2(+) Hematopoietic Stem and Progenitor Cells. Cell Stem Cell. 2015;16:477–487. doi: 10.1016/j.stem.2015.04.008. [DOI] [PMC free article] [PubMed] [Google Scholar]
- Gekas C, Graf T. CD41 expression marks myeloid-biased adult hematopoietic stem cells and increases with age. Blood. 2013;121:4463–4472. doi: 10.1182/blood-2012-09-457929. [DOI] [PubMed] [Google Scholar]
- Grimbaldeston MA, Geczy CL, Tedla N, Finlay-Jones JJ, Hart PH. S100A8 induction in keratinocytes by ultraviolet A irradiation is dependent on reactive oxygen intermediates. J Invest Dermatol. 2003;121:1168–1174. doi: 10.1046/j.1523-1747.2003.12561.x. [DOI] [PubMed] [Google Scholar]
- Guo F, Velu CS, Grimes HL, Zheng Y. Rho GTPase Cdc42 is essential for B-lymphocyte development and activation. Blood. 2009;114:2909–2916. doi: 10.1182/blood-2009-04-214676. [DOI] [PMC free article] [PubMed] [Google Scholar]
- Hart GW, Slawson C, Ramirez-Correa G, Lagerlof O. Cross talk between O-GlcNAcylation and phosphorylation: roles in signaling, transcription, and chronic disease. Annu Rev Biochem. 2011;80:825–858. doi: 10.1146/annurev-biochem-060608-102511. [DOI] [PMC free article] [PubMed] [Google Scholar]
- Iida R, Welner RS, Zhao W, Alberola-lla J, Medina KL, Zhao ZJ, Kincade PW. Stem and progenitor cell subsets are affected by JAK2 signaling and can be monitored by flow cytometry. PloS one. 2014;9:e93643. doi: 10.1371/journal.pone.0093643. [DOI] [PMC free article] [PubMed] [Google Scholar]
- Jung J, Bohn G, Allroth A, Boztug K, Brandes G, Sandrock I, Schaffer AA, Rathinam C, Kollner I, Beger C, et al. Identification of a homozygous deletion in the AP3B1 gene causing Hermansky-Pudlak syndrome, type 2. Blood. 2006;108:362–369. doi: 10.1182/blood-2005-11-4377. [DOI] [PMC free article] [PubMed] [Google Scholar]
- King KY, Goodell MA. Inflammatory modulation of HSCs: viewing the HSC as a foundation for the immune response. Nat Rev Immunol. 2011;11:685–692. doi: 10.1038/nri3062. [DOI] [PMC free article] [PubMed] [Google Scholar]
- Klimenkova O, Ellerbeck W, Klimiankou M, Unalan M, Kandabarau S, Gigina A, Hussein K, Zeidler C, Welte K, Skokowa J. A lack of secretory leukocyte protease inhibitor (SLPI) causes defects in granulocytic differentiation. Blood. 2014;123:1239–1249. doi: 10.1182/blood-2013-06-508887. [DOI] [PubMed] [Google Scholar]
- Land RH, Rayne AK, Vanderbeck AN, Barlowe TS, Manjunath S, Gross M, Eiger S, Klein PS, Cunningham NR, Huang J, et al. The orphan nuclear receptor NR4A1 specifies a distinct subpopulation of quiescent myeloid-biased long-term HSCs. Stem Cells. 2015;33:278–288. doi: 10.1002/stem.1852. [DOI] [PMC free article] [PubMed] [Google Scholar]
- Matatall KA, Jeong M, Chen S, Sun D, Chen F, Mo Q, Kimmel M, King KY. Chronic Infection Depletes Hematopoietic Stem Cells through Stress-Induced Terminal Differentiation. Cell reports. 2016;17:2584–2595. doi: 10.1016/j.celrep.2016.11.031. [DOI] [PMC free article] [PubMed] [Google Scholar]
- Morita Y, Ema H, Nakauchi H. Heterogeneity and hierarchy within the most primitive hematopoietic stem cell compartment. J Exp Med. 2010;207:1173–1182. doi: 10.1084/jem.20091318. [DOI] [PMC free article] [PubMed] [Google Scholar]
- Morrison SJ, Scadden DT. The bone marrow niche for haematopoietic stem cells. Nature. 2014;505:327–334. doi: 10.1038/nature12984. [DOI] [PMC free article] [PubMed] [Google Scholar]
- Nagai Y, Garrett KP, Ohta S, Bahrun U, Kouro T, Akira S, Takatsu K, Kincade PW. Toll-like receptors on hematopoietic progenitor cells stimulate innate immune system replenishment. Immunity. 2006;24:801–812. doi: 10.1016/j.immuni.2006.04.008. [DOI] [PMC free article] [PubMed] [Google Scholar]
- Notta F, Zandi S, Takayama N, Dobson S, Gan OI, Wilson G, Kaufmann KB, McLeod J, Laurenti E, Dunant CF, et al. Distinct routes of lineage development reshape the human blood hierarchy across ontogeny. Science. 2016;351:aab2116. doi: 10.1126/science.aab2116. [DOI] [PMC free article] [PubMed] [Google Scholar]
- Oguro H, Ding L, Morrison SJ. SLAM family markers resolve functionally distinct subpopulations of hematopoietic stem cells and multipotent progenitors. Cell Stem Cell. 2013;13:102–116. doi: 10.1016/j.stem.2013.05.014. [DOI] [PMC free article] [PubMed] [Google Scholar]
- Rodriguez S, Chora A, Goumnerov B, Mumaw C, Goebel WS, Fernandez L, Baydoun H, HogenEsch H, Dombkowski DM, Karlewicz CA, et al. Dysfunctional expansion of hematopoietic stem cells and block of myeloid differentiation in lethal sepsis. Blood. 2009;114:4064–4076. doi: 10.1182/blood-2009-04-214916. [DOI] [PMC free article] [PubMed] [Google Scholar]
- Saligrama N, Noubade R, Case LK, del Rio R, Teuscher C. Combinatorial roles for histamine H1-H2 and H3-H4 receptors in autoimmune inflammatory disease of the central nervous system. Eur J Immunol. 2012;42:1536–1546. doi: 10.1002/eji.201141859. [DOI] [PMC free article] [PubMed] [Google Scholar]
- Sanjuan-Pla A, Macaulay IC, Jensen CT, Woll PS, Luis TC, Mead A, Moore S, Carella C, Matsuoka S, Bouriez Jones T, et al. Platelet-biased stem cells reside at the apex of the haematopoietic stem-cell hierarchy. Nature. 2013;502:232–236. doi: 10.1038/nature12495. [DOI] [PubMed] [Google Scholar]
- Schinke C, Giricz O, Li W, Shastri A, Gordon S, Barreyro L, Bhagat T, Bhattacharyya S, Ramachandra N, Bartenstein M, et al. IL8-CXCR2 pathway inhibition as a therapeutic strategy against MDS and AML stem cells. Blood. 2015;125:3144–3152. doi: 10.1182/blood-2015-01-621631. [DOI] [PMC free article] [PubMed] [Google Scholar]
- Schurch CM, Riether C, Ochsenbein AF. Cytotoxic CD8+ T cells stimulate hematopoietic progenitors by promoting cytokine release from bone marrow mesenchymal stromal cells. Cell Stem Cell. 2014;14:460–472. doi: 10.1016/j.stem.2014.01.002. [DOI] [PubMed] [Google Scholar]
- Shi X, Siggins RW, Stanford WL, Melvan JN, Basson MD, Zhang P. Toll-like receptor 4/stem cell antigen 1 signaling promotes hematopoietic precursor cell commitment to granulocyte development during the granulopoietic response to Escherichia coli bacteremia. Infection and immunity. 2013;81:2197–2205. doi: 10.1128/IAI.01280-12. [DOI] [PMC free article] [PubMed] [Google Scholar]
- Siggs OM, Arnold CN, Huber C, Pirie E, Xia Y, Lin P, Nemazee D, Beutler B. The P4-type ATPase ATP11C is essential for B lymphopoiesis in adult bone marrow. Nat Immunol. 2011;12:434–440. doi: 10.1038/ni.2012. [DOI] [PMC free article] [PubMed] [Google Scholar]
- Takeuchi O, Hoshino K, Kawai T, Sanjo H, Takada H, Ogawa T, Takeda K, Akira S. Differential roles of TLR2 and TLR4 in recognition of gram-negative and gram-positive bacterial cell wall components. Immunity. 1999;11:443–451. doi: 10.1016/s1074-7613(00)80119-3. [DOI] [PubMed] [Google Scholar]
- Takizawa H, Fritsch K, Kovtonyuk LV, Saito Y, Yakkala C, Jacobs K, Ahuja AK, Lopes M, Hausmann A, Hardt WD, et al. Pathogen-Induced TLR4-TRIF Innate Immune Signaling in Hematopoietic Stem Cells Promotes Proliferation but Reduces Competitive Fitness. Cell Stem Cell. 2017;21:225–240 e225. doi: 10.1016/j.stem.2017.06.013. [DOI] [PubMed] [Google Scholar]
- Terskikh AV, Miyamoto T, Chang C, Diatchenko L, Weissman IL. Gene expression analysis of purified hematopoietic stem cells and committed progenitors. Blood. 2003;102:94–101. doi: 10.1182/blood-2002-08-2509. [DOI] [PubMed] [Google Scholar]
- Trumpp A, Essers M, Wilson A. Awakening dormant haematopoietic stem cells. Nat Rev Immunol. 2010;10:201–209. doi: 10.1038/nri2726. [DOI] [PubMed] [Google Scholar]
- Viatour P, Somervaille TC, Venkatasubrahmanyam S, Kogan S, McLaughlin ME, Weissman IL, Butte AJ, Passegue E, Sage J. Hematopoietic stem cell quiescence is maintained by compound contributions of the retinoblastoma gene family. Cell Stem Cell. 2008;3:416–428. doi: 10.1016/j.stem.2008.07.009. [DOI] [PMC free article] [PubMed] [Google Scholar]
- Yamamoto R, Morita Y, Ooehara J, Hamanaka S, Onodera M, Rudolph KL, Ema H, Nakauchi H. Clonal analysis unveils self-renewing lineage-restricted progenitors generated directly from hematopoietic stem cells. Cell. 2013;154:1112–1126. doi: 10.1016/j.cell.2013.08.007. [DOI] [PubMed] [Google Scholar]
- Yang XD, Ai W, Asfaha S, Bhagat G, Friedman RA, Jin G, Park H, Shykind B, Diacovo TG, Falus A, et al. Histamine deficiency promotes inflammation-associated carcinogenesis through reduced myeloid maturation and accumulation of CD11b+Ly6G+ immature myeloid cells. Nat Med. 2011;17:87–95. doi: 10.1038/nm.2278. [DOI] [PMC free article] [PubMed] [Google Scholar]
- Yu VW, Scadden DT. Heterogeneity of the bone marrow niche. Curr Opin Hematol. 2016;23:331–338. doi: 10.1097/MOH.0000000000000265. [DOI] [PMC free article] [PubMed] [Google Scholar]
- Zhao M, Perry JM, Marshall H, Venkatraman A, Qian P, He XC, Ahamed J, Li L. Megakaryocytes maintain homeostatic quiescence and promote post-injury regeneration of hematopoietic stem cells. Nat Med. 2014;20:1321–1326. doi: 10.1038/nm.3706. [DOI] [PubMed] [Google Scholar]
Associated Data
This section collects any data citations, data availability statements, or supplementary materials included in this article.