Abstract
Successful outcome of Photodynamic therapy (PDT) depends on accurate delivery of prescribed light dose. A quality assurance program is necessary to ensure that light dosimetry is correctly measured. We have instituted a QA program that include examination of long term calibration uncertainty of isotropic detectors for light fluence rate, power meter head intercomparison for laser power, stability of the light-emitting diode (LED) light source integrating sphere as a light fluence standard, laser output and calibration of in-vivo reflective fluorescence and absorption spectrometers. We examined the long term calibration uncertainty of isotropic detector sensitivity, defined as fluence rate per voltage. We calibrate the detector using the known calibrated light fluence rate of the LED light source built into an internally baffled 4″ integrating sphere. LED light sources were examined using a 1mm diameter isotropic detector calibrated in a collimated beam. Wavelengths varying from 632nm to 690nm were used. The internal LED method gives an overall calibration accuracy of ±4%. Intercomparison among power meters was performed to determine the consistency of laser power and light fluence rate measured among different power meters. Power and fluence readings were measured and compared among detectors. A comparison of power and fluence reading among several power heads shows long term consistency for power and light fluence rate calibration to within 3% regardless of wavelength. The standard LED light source is used to calibrate the transmission difference between different channels for the diffuse reflective absorption and fluorescence contact probe as well as isotropic detectors used in PDT dose dosimeter.
Keywords: Light dose, LED, QA, photodynamic therapy, calibration
1. INTRODUCTION
Light dosimetry is critical for PDT [1, 2], thus it is important to establish a comprehensive QA program, to ensure the accuracy of isotropic detectors and the laser output. The AAPM TG140 [3,4] has established dosimetry accuracy for power meters and recommend an uncertainty of optical power of 5% and a frequency of 24 month for power meter calibration. There are currently no well-established QA standards for light fluence and fluence rate, which is the focus of this paper.
We examined the long term calibration uncertainty of isotropic detector sensitivity, defined as fluence rate per voltage. LED light sources were examined using a 1mm diameter isotropic detector calibrated in a collimated beam. Wavelengths varying from 632nm to 690nm were used. Intercomparison among power meters was performed to determine the consistency of laser power and light fluence rate measured among different power meters. Power and fluence readings were measured and compared among detectors. A comparison of power and fluence reading among several power heads shows long term consistency for power and light fluence rate calibration. The standard LED light source is used to calibrate the transmission difference between different channels for the diffuse reflective absorption and fluorescence contact probe as well as isotropic detectors used in PDT dose dosimeter.
2. METHODS
2.1 Long-term stability among thermal type power head meters use for laser light fluence and power measurements
AAPM has established a task group (TG140) to examine accuracy requirement for power meter head. We examined the long-term stability among thermal type power head meters used for laser light fluence and power measurements. Intercomparison among power meters was performed to determine the consistency of laser power and light fluence rate measured among different power meters. Measurements were done over an extended period of time. We used the same laser source and the same source-to-detector distance (SDD). The light source passes through an optic fiber with a micro-lens at the tip. For measurements of power (mW), the beam diameter at the detector surface is smaller than the cross section of the power meter head receiver. For measurement of irradiance (mW/cm2), the light covers the entire aperture of the detector and the area of detector sensitive area was used to calculate the measured light fluence rate as a ratio of measured power and the sensitive area. The configuration for light fluence and power intercomparison are shown in Figure 1(a) and (b), respectively.
Figure 1.
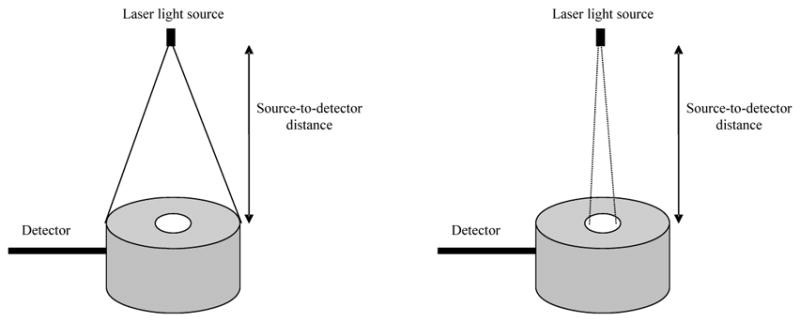
Experimental setup of: (a) irradiance measurement and (b) power measurement
2.2 Fluence and Power calibration
To calibrate the fluence rate and the laser power, first we calibrate a 1 mm detector under broad beam geometry. A 1mm isotropic detector with good isotropy is placed in the center of the uniform beam, at the same level as the power meter, at the same distance from the light source and is connected to a dosimetry system. The light fluence rate of the isotropic detector is then calibrated in the collimated beam geometry using the measured power S and the calculated light fluence rate (ϕ = S (mW)/πD2, D is the detector diameter) as a transfer standard.
We use a 6″ integrating sphere (IS-06-SF, Labsphere, North Sutton, NH) to ensure uniformity and reproducibility of light fluence rate during calibration (figure 2). The integrating sphere contains three 1.5-inch diameter input ports and one 0.5-inch diameter detector port. Because of the multiple scattering inside the sphere, the light fluence rate is uniform everywhere inside the sphere, regardless the relative geometry of the light and the integrating sphere. The fluence rate in air ϕ0 is proportional to the power reading R of the power meter by a calibration constant α, i.e.
Figure 2.
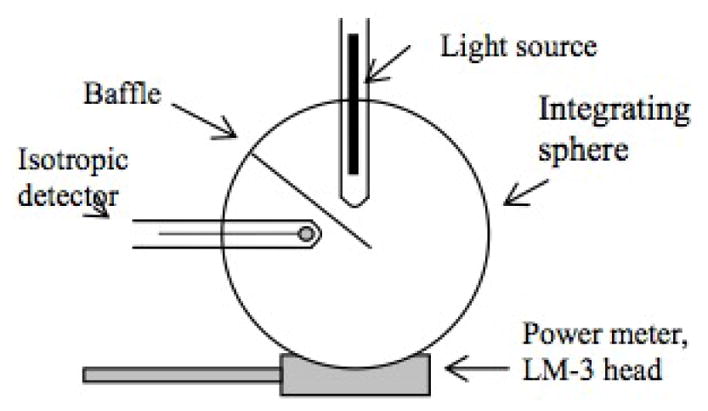
Experimental setup for calibration of isotropic detectors. The integrating sphere provides uniform light. The light fluence rate inside the sphere is determined by the LM-1 detector.
| (1) |
The calibration is performed using the transfer isotropic detector. Using the calibrated integrating sphere, one can calibrate isotropic detectors in the integrating sphere such that the measured photovoltage (V) from the isotropic detector was proportional to the light fluence rate by:
| (2) |
where A (mW/cm2/V) is the conversion factor for fluence rate and b (V) characterizes the leakage of the photodiode. The isotropic detector is inserted in the integrating sphere via a diffusive tube to ensure that no direct light from the light source reaches the isotropic detector.
2.3 Isotropic detector calibration accuracy
An ideal isotropic detector would respond to light isotropically from any angle. However, a practical isotropic detector does not respond to light isotropically [5], because the light incident to the detector at an angle close to the stem of the detector will not be detected because of the blockage by the optical fiber. The angular response of the detectors was measured in two planes: horizontal and vertical, as shown in figure 3.
Figure 3.
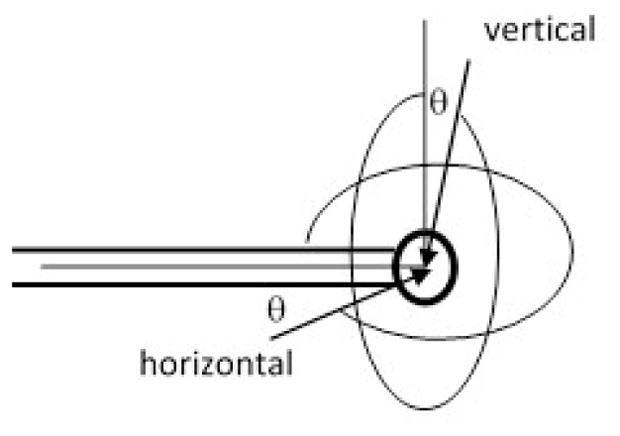
Definition of angle for vertical and horizontal planes.
2.4 Isotropic detector calibration using LED
Using the LED method, we directly calibrate the detector using a light-emitting diode (LED) light source (Philips LumiLED) built into an internally baffled 4″ integrating sphere (figure 4). The LED emits over a broad range of wavelengths centered at approximately 630 nm. The sphere is fabricated from a plastic sphere coated with barium sulfate coating (Spectraflect, Labsphere), and the LED and its driver circuitry is built into the housing which holds the sphere. The calibration fluence rate is defined as the fluence rate read by a detector calibrated for the wavelength in question. The illumination of the detector is independent of wavelength in this case; the variation in calibration factor with wavelength reflects the wavelength-dependence of the photodiode detector’s response and the optical fiber’s transmission. This can be quantified by a wavelength correction factor, equal to the ratio of calibration factors at two wavelengths.
Figure 4.
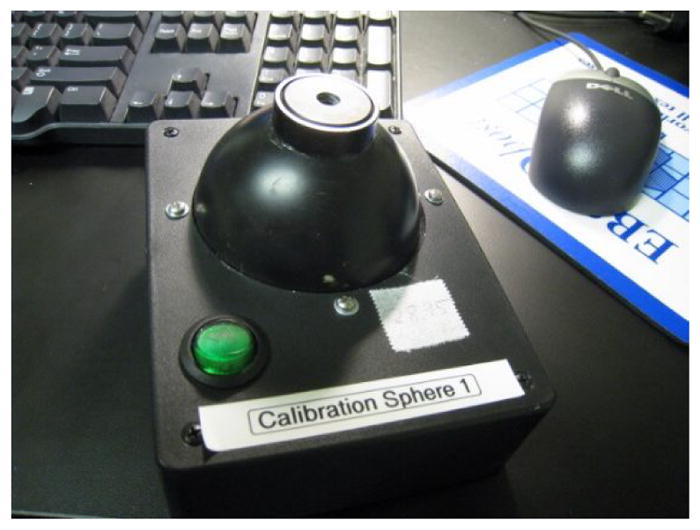
Picture of the light-emitting diode (LED) light source.
2.5 Detector calibration corrections factors
2.5.1 Backscatter Correction (superficial application)
An ideal isotropic detector should have isotropic response for any incident angle and should measure the light fluence rate in any medium. However, isotropic detectors used in practice have limitations in isotropy response. As a result, the reading is lower than what is expected of the light fluence, defined as the total radiance from all incident angles per unit area of the detector volume.
When the detector is placed on the surface of the treated area (breast, intra-peritoneal) a correction factor α, should be applied, to account for limitation of collection angles of the detector. When the measurements are taken interstitially (prostate) another water correction factor, β must be applied to account for index of refraction mismatch.
To correct for the difference in isotropy response, we introduce a detector collection correction factor (α), defined as the ratio of the measured ϕ/ϕo and the true ϕ/ϕo for an ideal diffuse reflection surface. The measurements were performed on a perfect diffuse reflection surface (certified reflectance standard from Labsphere, ID# SRS-99-020) with known diffuse reflectance, R, as shown in figure 5(a) and (b). The ratio ϕ/ϕo = 1+2R, where ϕ and ϕo are the light fluence rate with and without the diffuse reflection surface. When an isotropic detector is used, its reading is R and Ro for a broad collimated light incident perpendicular towards the diffuse reflecting surface. R/Ro is usually smaller than ϕ/ϕo because the isotropic detector can only collect light correctly when the light is incident at 90° angle (i.e. Ro), but it will have reduced response when the incident light is coming from all directions. Therefore:
| (3) |
| (4) |
where Rd = 1 for a 100% diffuse surface.
Figure 5.
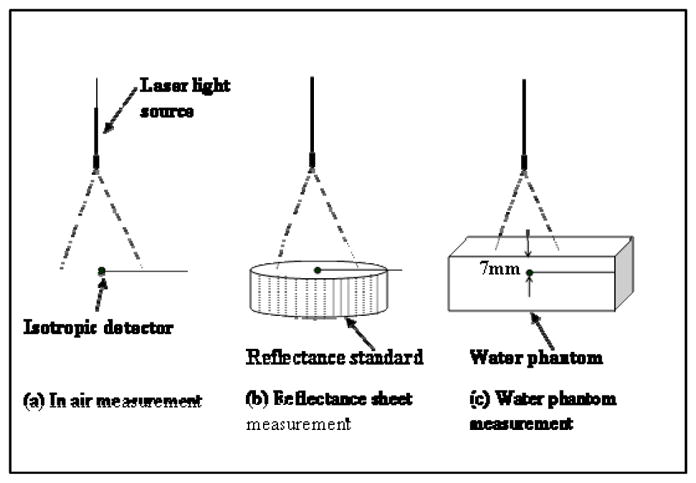
Experimental setup for measuring α and β: (a) in air, (b) on reflecting sheet and (c) in water.
Figure 6 shows a picture of three different isotropic detectors used in our study. Different scattering tips were used: (A) is an isotropic detector with a 1.0mm scattering tip manufactured by by CardioFocus, Inc (West Yarmoth, MA), while (B) and (C) are two types of 0.5mm and 0.8mm, scattering tip detectors manufactured by CardioFocus and MedLight S.A. (Switzerland), respectively.
Figure 6.
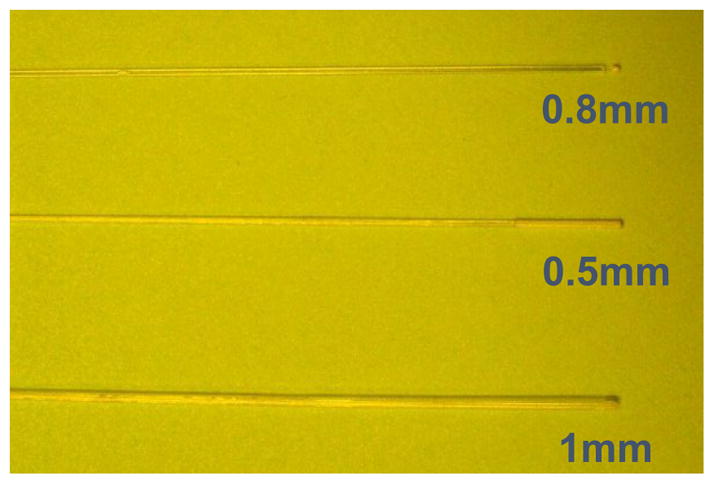
Picture of the three isotropic detectors used in the study. (a) Cardiofocus with 1mm tip, (b) Cardiofocus with 0.5mm tip and (c) Medlight with 0.8mm tip.
2.5.2 Correction for index mismatch
Water correction factor is used to correct for detector response change due to mismatch of index of refraction. The measurement is made in water (figure 5c) because its index of refraction is very similar to that of tissue. We define the water correction factor β, as the ratio of the detector reading in water and air, for the same incident light fluence rate.
| (5) |
3. RESULTS AND DISCUSSION
3.1 Power meter intercomparison
Power and fluence readings were measured and compared among five detectors, for laser power settings ranging from 0.5 to 6W and wavelengths between 630 to 730 nm. The power meters used in the measurements are all from Coherent and are listed here: Coherent LM-150LS, LM-150, LM-10 (18M38), LM-10 (18M95) and LM3 (QK). Table 1 is a summary of all the intercomparison done for both the irradiance and power setup.
Table 1.
Intercomparison of power meters at 630nm, 665nm and 730nm, using experimental setup for irradiance measurement (Fig. 1a) and power comparison (Fig. 1b). The table displays the laser power settings, the raw power readings and the comparison of each reading to that of the power meter LM-10 (18M38).
| Fluence measurement (a) | ||||||
|---|---|---|---|---|---|---|
| 730nm | ||||||
|
| ||||||
| SN/Date | 2012 | 2013 | 2014 | 2015 | 2016 | 2017 |
| LM10 (18M95) | 1.01 | 1.00 | 1.01 | 1.05 | 1.02 | 1.02 |
| LM3 (QK) | 1.06 | 1.05 | 1.02 | 1.07 | 1.06 | x |
| LS150 (MF85) | 1.57 | 1.28 | 1.45 | 1.49 | 1.51 | 1.58 |
| LM10 (18M38) | 1.00 | 1.00 | 1.00 | 1.00 | 1.00 | 1.00 |
| LS150 | x | x | x | x | x | 0.98 |
|
| ||||||
| 665nm | ||||||
|
| ||||||
| SN/Date | 2012 | 2013 | 2014 | 2015 | 2016 | 2017 |
|
| ||||||
| LM10 (18M95) | 1.02 | 1.03 | 1.00 | 1.01 | 1.00 | 1.00 |
| LM3 (QK) | 1.07 | 1.01 | 1.05 | 1.07 | 1.06 | x |
| LS150 (MF85) | 1.53 | 1.29 | 1.39 | 1.50 | 1.50 | 1.67 |
| LM10 (18M38) | 1.00 | 1.00 | 1.00 | 1.00 | 1.00 | 1.00 |
| LS150 | x | x | x | x | x | 0.96 |
|
| ||||||
| 630nm | ||||||
|
| ||||||
| SN/Date | 2012 | 2013 | 2014 | 2015 | 2016 | 2017 |
|
| ||||||
| LM10 (18M95) | 1.01 | 1.00 | 1.01 | 1.01 | 0.99 | 1.02 |
| LM3 (QK) | 1.08 | 1.04 | 1.04 | 1.04 | 1.07 | x |
| LS150 (MF85) | 1.58 | 1.28 | 1.36 | 1.43 | 1.51 | 1.51 |
| LM10 (18M38) | 1.00 | 1.00 | 1.00 | 1.00 | 1.00 | 1.00 |
| LS150 | x | x | x | x | x | 0.97 |
| Power measurement (b) | ||||||
|---|---|---|---|---|---|---|
| 730nm | ||||||
|
| ||||||
| SN/Date | 2012 | 2013 | 2014 | 2015 | 2016 | 2017 |
| LM10 (18M95) | 1.01 | 1.01 | 1.01 | 1.01 | 1.01 | 1.00 |
| LM3 (QK) | 1.07 | 1.08 | 1.08 | 1.06 | 1.07 | x |
| LS150 (MF85) | 1.00 | 1.02 | 0.98 | 1.02 | 0.99 | 0.99 |
| LM10 (18M38) | 1.00 | 1.00 | 1.00 | 1.00 | 1.00 | 1.00 |
| LS150 | x | x | x | x | x | 0.99 |
|
| ||||||
| 665nm | ||||||
|
| ||||||
| SN/Date | 2012 | 2013 | 2014 | 2015 | 2016 | 2017 |
|
| ||||||
| LM10 (18M95) | 1.01 | 1.01 | 1.00 | 1.01 | 1.00 | 1.00 |
| LM3 (QK) | 0.96 | 1.07 | 1.08 | 1.10 | 1.08 | x |
| LS150 (MF85) | 1.01 | 0.99 | 0.98 | 0.99 | 1.00 | 1.02 |
| LM10 (18M38) | 1.00 | 1.00 | 1.00 | 1.00 | 1.00 | 1.00 |
| LS150 | x | x | x | x | x | 1.00 |
|
| ||||||
| 630nm | ||||||
|
| ||||||
| SN/Date | 2012 | 2013 | 2014 | 2015 | 2016 | 2017 |
|
| ||||||
| LM10 (18M95) | 1.01 | 1.00 | 1.01 | 0.99 | 1.00 | 1.02 |
| LM3 (QK) | 0.96 | 1.07 | 1.07 | 1.10 | 1.06 | x |
| LS150 (MF85) | 1.00 | 0.98 | 1.10 | 0.99 | 0.99 | 1.00 |
| LM10 (18M38) | 1.00 | 1.00 | 1.00 | 1.00 | 1.00 | 1.00 |
| LS150 | x | x | x | x | x | 0.98 |
For all thermal type power meter suitable for power measurement less than 20W, the calibration of power of different power meters can generally change by 8% among different power meters. However, this calibration does not change over time and remains consistent to within 3% for all power meters. Similar results are obtained for laser fluence rate calibration except for a thermal type power meter head with thick absorbing coating that is suitable for measuring laser power up to 150 W, it’s calibration factor can be different from other power meters for as much as 67%.
3.2 Integrating sphere calibration accuracy
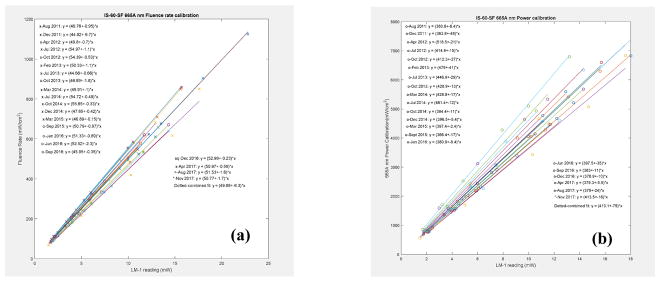
The integrating sphere was calibrated for the light fluence rate (figure 7). The variation of the calibration factors, α, over a period of time is plotted in figure 7(a) for fluence and (b) for power, for 665nm. The average CF is plotted as a continuous line.
Figure 7.
Fluence rate (a) and power (b) calibration in an integrating sphere for 665nm wavelength.
3.3 LED output variation with time
A study of the LED output variation with time was made. The output was measured over a 1.5 hour period time, with a calibrated isotropic detector. Figure 8 shows that there is a 5–7% decay measured within the first hour, with the steepest slope seen in the first 15 minutes of measured data.
Figure 8.
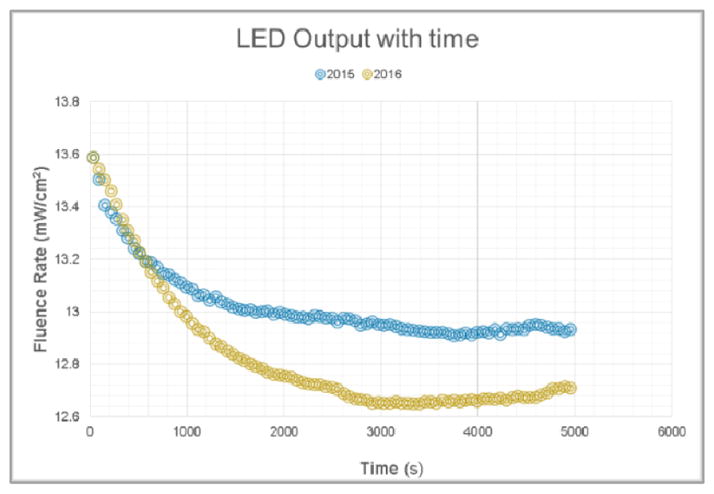
LED output variation with time, measured in 2015 and 2016.
3.4 Isotropic detector calibration
3.4.1 Angular dependence of isotropic detectors
The response of each detector was measured for every ten degree in each plane. Normalized angular response to 0 degree correction factor of eleven 0.5mm isotropic detectors in the vertical plane is shown in figure 9a and normalized angular response to 90 degrees in the horizontal plane is shown in figure 9b.
Figure 9.
Angular response of the detectors in: (a) vertical plane and (b) horizontal plane.
3.4.2 Variation of angular dependence with time
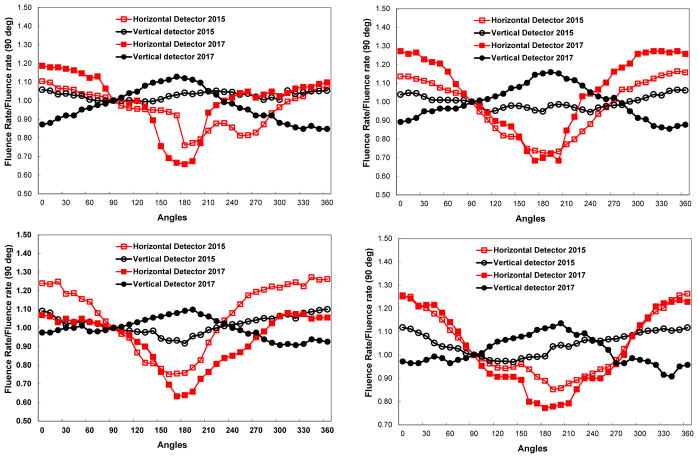
We studied the angular dependence for all detectors in both horizontal and vertical planes. We also looked at the variation with time of angular dependence by measuring it at different years. Both the vertical and horizontal plane measurements agree, with the vertical one having the bigger discrepancy given that the starting point of measurement cannot be defined.
3.4.3 Long term stability of isotropic detector calibration using in air method
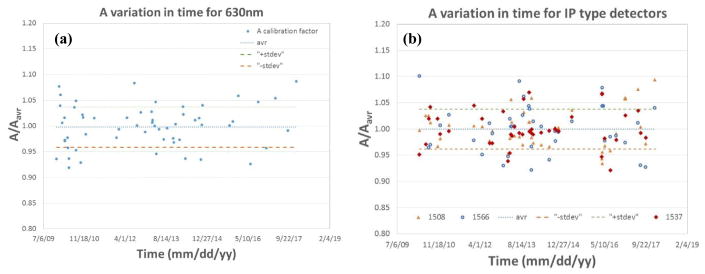
Routine measurements of light fluence use isotropic detectors composed of an optical fiber with a scattering tip. We examined the long term calibration uncertainty of isotropic detector sensitivity, defined as fluence rate per unit voltage, for two types of detectors: 1mm scattering tip isotropic detector (Figure 11(a)) and 0.5mm scattering tip isotropic detector (Figure 11(b)).
Figure 11.
Variation of A value over an extended period of for a 1mm isotropic detector (a) and for a 0.5mm IP type isotropic detector (b).
We used a 6″ calibrated integrating sphere with an external laser light source and detection system. The fluence rate in the integrating sphere is calibrated each time by comparison with a broad beam geometry measurement. The external laser method gave an overall accuracy of ±15%. The likely cause of the overall uncertainty includes positioning errors of the detector and light source in the integrating sphere and errors introduced by isotropic detector angular dependence in the broad beam geometry.
3.4.4 Calibration of isotropic detectors using LED
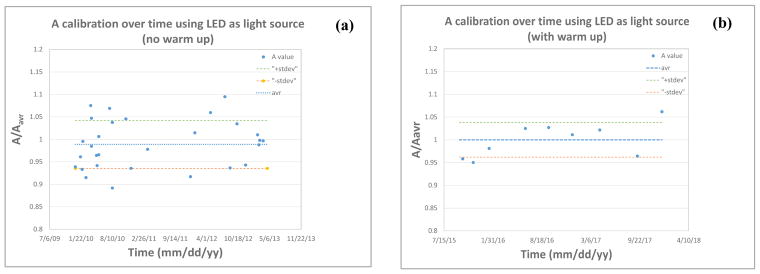
A calibration fluence rate was determined by comparing the measured fluence rate in the sphere to that of a laser in the 6-inch integrating sphere described above. The LED is warmed up for about 15 minutes before calibration, to avoid the steep output decay mentioned above. As seen in Figure 12(a), calibration made within the warm-up period results in higher A value errors, while calibrating after the recommended warm-up period results in a variation of up to ±5%, Figure 12(b).
Figure 12.
Variation of A calibration value over time, using an LED as a light source with (a) no LED warm up and (b) 10–15 minutes warm up.
3.4.5 Linearity of isotropic detectors
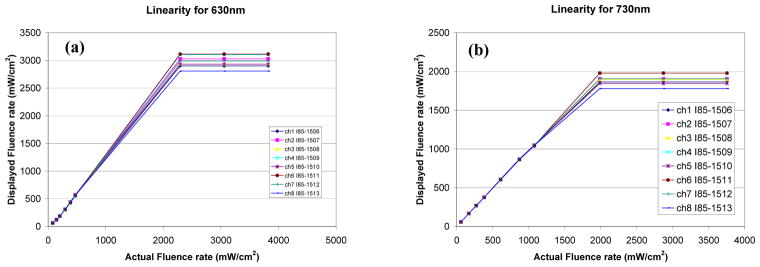
Linearity for an isotropic detector is defined as the function of measured fluence by the detector vs. actual fluence for the fluence range used in clinic. For an ideal isotropic detector, this relationship should be y = x. We have characterized the linearity of the in-vivo light dosimetry system for the isotropic detectors at 630nm and 730nm, as shown in Fig. 13.
Figure 13.
Linearity of isotropic detectors at different wavelengths: (a) 630nm and (b) 730 nm. All detectors are capable of measuring fluence rates of at least 1000 mW/cm2 without saturating.
The linearity of photodiodes is determined by measuring the isotropic detector output at different light intensity levels, for a given wavelength laser beam. An LM-3 Coherent power head was used along with LabMaster meter. All detectors are capable of measuring fluence rates of at least 1500 mW/cm2 without saturating.
3.4.6 Detector calibration corrections factors
The detector reading should be corrected by the detector collection correction factor (α) for surface measurements and water correction factor (β) for interstitial measurements. Tables 3 and 4 summarize the measured correction factors α and β, respectively, for the four types of isotropic detectors used in the study. Also shown are the minimum, maximum and average values.
Table 3.
Summary of the measured correction β for the three types of isotropic detectors used in the study. Also shown are the minimum, maximum and average values.
| Index | Cardiofocus | Medlight (batch 1) | Medlight (batch 2) | ||
|---|---|---|---|---|---|
| 0.5mm bulb | 0.8mm bulb | 0.8mm bulb | 0.8mm bulb | 1 mm bulb | |
| 1 | 1.95 | 1.79 | 1.89 | 1.72 | 1.52 |
| 2 | 1.92 | 1.71 | 1.82 | 1.73 | 1.44 |
| 3 | 1.92 | 1.81 | 1.8 | 1.7 | 1.47 |
| … | … | … | |||
| 26 | 1.973 | ||||
|
| |||||
| MIN | 1.89 | 1.71 | 1.69 | 1.7 | 1.44 |
| MAX | 2.01 | 1.81 | 1.92 | 1.75 | 1.52 |
| AVR | 1.96 ± 0.03 | 1.77 ± 0.05 | 1.81 ± 0.08 | 1.72 ± 0.02 | 1.48 ± 0.03 |
The index mismatch was measured periodically to study its variation with time. We found that variation to be within ±5% as shown in Figure 14.
Figure 14.
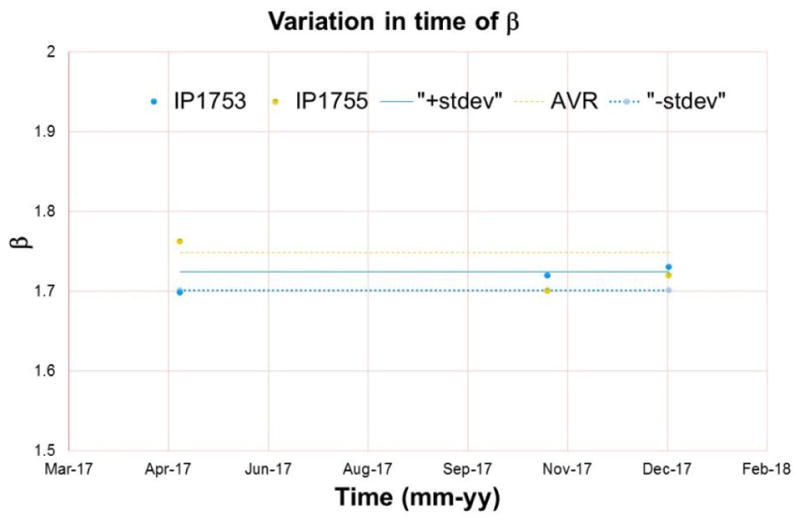
Variation in time of index mismatch.
4. CONCLUSIONS
We have examined over a long period of time the behavior of several critical components of light dosimetry. These include light fluence rate and power, power meter head intercomparison, stability of the light-emitting diode (LED) light with time, anisotropy measurement of isotropic detectors and its variation with time, long term calibration uncertainty of isotropic detectors, linearity of isotropic detectors and reflectance and water correction factor.
As part of a comprehensive QA program we recommend performing an initial commissioning and acceptance that would measure isotropic detector water correction and reflectance (±10% and ±15%, respectively) as well as angular dependence (±30%) and LED output variation with time (5%). Isotropic detector calibration is recommended to be performed in an integrating sphere in air and it is recommended to QA routinely: daily, quarterly, and annually with a recommended accuracy of ±15%. Light fluence rate for LED at used wavelengths and linearity of isotropic detectors should be part of the annual QA. As part of the quarterly QA the following should be tested: laser output and wavelength check, power and fluence calibration using integrating sphere, intercomparison of power meter and heads and light fluence rate for LED for all wavelengths.
Figure 10.
Angular dependence variation with time for 4 isotropic detectors.
Table 2.
Summary of the measured correction factors α for the three types of isotropic detectors used in the study. Also shown are the minimum, maximum and average values.
| Index | Cardiofocus | Medlight | Cardiofocus | |
|---|---|---|---|---|
| 0.5mm bulb | 0.8mm bulb | 0.8mm bulb | 1mm bulb | |
| 1 | 1.15 | 1.32 | 1.18 | 1.17 |
| 2 | 1.15 | 1.33 | 1.12 | 1.17 |
| 3 | 1.13 | 1.38 | 1.25 | 1.16 |
| … | … | … | ||
| 26 | 1.42 | |||
|
| ||||
| MIN | 1.13 | 1.32 | 1.04 | 1.11 |
| MAX | 1.18 | 1.47 | 1.25 | 1.18 |
| AVR | 1.16 ± 0.08 | 1.39 ± 0.08 | 1.13 ± 0.05 | 1.16 ± 0.04 |
Acknowledgments
This work is supported by grants from National Institute of Health (NIH) R01 CA 154562 and P01 CA87971.
References
- 1.Dougherty TJ, Marcus SL. Photodynamic Therapy. Eur J Cancer. 1992;28A:1734–1742. doi: 10.1016/0959-8049(92)90080-l. [DOI] [PubMed] [Google Scholar]
- 2.Delaney TF, Glatstein E. Photodynamic therapy of cancer. Compr Ther. 1988;14(5):43–55. [PubMed] [Google Scholar]
- 3.Zhu TC, et al. Absolute calibration of optical power for PDT: Report of AAPM TG140. Med Phys. 2013;40(8) doi: 10.1118/1.4813897. [DOI] [PubMed] [Google Scholar]
- 4.Kutcher GJ, et al. Comprehensive QA for Radiation Oncology. AAPM TG40. Med Phys. 1994;21(4) doi: 10.1118/1.597316. [DOI] [PubMed] [Google Scholar]
- 5.Marijnissen JPA, Star WM. Calibration of isotropic light dosimetry probes based on scattering bulbs in clear media. Phys Med Biol. 1996;41:1191–1208. doi: 10.1088/0031-9155/41/7/008. [DOI] [PubMed] [Google Scholar]


