Abstract
Research is ongoing to find a noninvasive method of monitoring, which can predict fluid responsiveness in patients undergoing kidney transplantation.
To compare the responses to fluid challenges with the Pleth Variability Index, a noninvasive dynamic index derived from plethysmographic variability (Radical 7 pulse oximeter; Masimo Corporation, Irvine, CA), and the esophageal Doppler, the criterion standard.
Observational study.
University hospital; study from May 2011 and May 2012.
Forty-eight patients with end-renal function were included and 44 analyzed. Patients with cardiac failure were not eligible.
Fluid challenges were administered during maintenance of general anesthesia but before skin incision and repeated if the patient was deemed to be a “responder” (increase in stroke volume ≥10%).
The primary endpoint was to assess if the Pleth Variability Index is an accurate predictor of fluid responsiveness.
Among 76 fluid challenges, 38 were considered as positive (increase in stroke volume measured by Doppler ≥10%). Pleth Variability Index was similar at baseline between responders and nonresponder patients. Fluid challenges were associated with a significant decrease in Pleth Variability Index in overall cases (12 [8–14] vs 10 [6–17], P = .050), but it was not able to discriminate between responders (12 [8–15] vs 10 [5–15], P = .650) and nonresponders (11 [6–16] vs 8 [5–14], P = .047). The area under the Receiver Operating Characteristic curve for Pleth Variability Index was 0.49 (0.36–0.62).
Pleth Variability Index is not an accurate predictor of fluid responsiveness during kidney transplantation.
Keywords: cardiac output, fluid therapy, kidney transplantation
1. Introduction
As pointed out by Schnuelle and Johannes van der Woude,[1] adequate volume maintenance is essential to prevent acute renal failure after renal transplantation. Two major questions must be answered. The first question (what is the appropriate fluid?) has a simple answer: crystalloids with a safe profile are now the first choice for volume replacement in kidney transplantation.[1] The second (how much is needed?) is much more controversial. Very early studies recommended large fluid infusion,[2–4] but patients suffering from end-stage renal disease often present substantial comorbidities and are at high risk of poor myocardial function,[5] and acute postoperative pulmonary edema.[6] These studies also recommended invasive monitoring such as the central venous pressure or even the pulmonary arterial pressure.[7] However, monitoring of central venous pressure is known to be a poor indicator of volume status and prospective randomized clinical trials have demonstrated that the routine use of Swan-Ganz catheters does not provide any benefit.[8]
Most recent knowledge comes from colonic resection during which a goal-directed therapy for fluid regimen is advocated during anesthesia.[9] This dynamic approach has reduced overall postoperative complications and hospital length of stay.[10] In this strategy, noninvasive cardiac output (CO) measurement by the esophageal Doppler (OD) in anaesthetized patients[11] is now strongly recommended by NICE (National Institute for Health and Clinical Excellence) guidelines in Great Britain for patients undergoing major or high-risk surgery.[12,13] The optimal way would be a strong predictor of fluid responsiveness as an alternative to optimize cardiac preload. Therefore, based on heart-lung interaction, variation in invasive arterial pressure during mechanical ventilation is a reliable predictor of fluid responsiveness.[14] But invasive arterial devices should be avoided if possible in patients undergoing renal transplantation to preserve arterial capital in case of possible need for a fistula. More recently, some authors have shown that fluid responsiveness could be noninvasively predicted, using the variability of the pulse oximeter plethysmographic waveform amplitude.[15] The derivative “Pleth Variability Index” (PVI) reflects plethysmographic variability and is able to accurately predict fluid responsiveness in intensive care or in surgical situations.[16–18] To date, few studies have assessed the ability of PVI to detect fluid responsiveness during surgery.[19,20]
The aim of this study was to determine whether a noninvasive method such as PVI, measured using a finger probe, accurately predicts fluid responsiveness assessed by OD, in patients undergoing kidney transplantation.
2. Methods
2.1. Study population
After Ethics Committee approval (RCB-2010-A00367-32) and written informed consent, adults scheduled for kidney transplantation between May 2011 and May 2012 were enrolled in this prospective observational study performed in a University hospital. To be eligible, end-disease chronic kidney failure patients had to be supplied with an extrarenal replacement from 2 to 4 times per week on an arteriovenous fistula. All patients had a transthoracic echocardiography to identify left ventricle hypertrophy and low left ventricular ejection fraction (<35%), the latter being a noninclusion criterion. Other noninclusion criteria were: body mass index >35 or <15 kg/m2 (limit of signal detection by the probe), history of bilateral arteriovenous fistula, peritoneal catheter, cardiac arrhythmia, valvular heart disease, and history of esophageal or aortic disease. Exclusion criteria were inaccurate measurements meaning poor signal quality or absence of signal in one or both technique(s).
2.2. Anesthesia
Extrarenal replacement was performed within the 12 hours before surgery for every patient with limited depletion (dry weight + 500 to 1000 mg). This technique was the routine care among nephrologists to avoid occurrence of arterial hypotension during the induction of anesthesia. Upon the arrival in the operative theatre, standard monitoring (scope, pulse oximetry, noninvasive arterial blood pressure, end-tidal carbon dioxide) was set up on the patient. Depth of anesthesia was recorded through Bispectral Index monitoring (BIS-XP, A2000 monitor; Aspect Medical Systems, Natick, MA) and neuromuscular monitoring. From the induction to the recovery from anesthesia, BIS was maintained between 40 and 60 with continuous infusion of propofol and remifentanil. Mechanical ventilation settings were in accordance with current guidelines.[21]
2.3. Hemodynamic monitoring
In anaesthetized patients under positive pressure ventilation, cyclic changes in aortic blood flow are observed and dynamic indices of fluid responsiveness indirectly measure this beat-to-beat variation. As a reference, a CardioQ EDM probe (Deltex Medical, Chichester, UK) was inserted orally into the esophagus and each measurement was preceded by an adjustment in the position of the probe to obtain the maximal stroke volume (SV) during 5 consecutive cardiac beats. The second monitoring of this volume variation in cardiac ejection was recorded through a Masimo Radical 7 pulse oximeter (Masimo Corporation, Irvine, CA) with a probe applied on the opposite index finger to the arm with the arteriovenous fistula. The PVI reflects the percentage variation in the plethysmograph throughout the respiratory cycle and is calculated from the perfusion index (PI), which is the percentage of infrared light absorbed due to arterial pulsation relative to the total amount of light absorbed. PVI is defined as [(PImax – PImin)/PImax] × 100%. To ensure quality of measure due to the correlation with the PI, a value of PI >4% is required.[22] Changes in the amplitude of the pulse oximeter plethysmogram correlate closely with variations in pulse pressure, and PVI can predict fluid responsiveness in many clinical situations.[23] However, some current studies suggest a grey zone, that is, zone of uncertainty about preload-dependence status: with a value between 9 and 13[24] and consequently 13 was considered as the limit to distinguish a responder with PVI.
2.4. Study protocol
During induction of general anesthesia perfusion of fluids was strictly limited to 250 mL of crystalloids with use of vasopressor if any arterial hypotension (a drop of the systolic arterial pressure above 20%) occurred. As soon as a steady state was reached, baseline measurements were performed: usual hemodynamic parameters (heart rate, blood pressure), parameters from the OD (cardiac index, SV, corrected flow time), and parameters from the Radical 7 monitor (PI, PVI). Then a first bolus of 250 mL of crystalloids (NaCl 0.9%) was infused in <5 minutes[25] to emphasize the effect of this volume challenge. Two minutes later the hemodynamic parameters as previously described were collected. Patients were considered as “responders” if their SV increased with a ΔSV ≥10%, and nonresponders if not (ΔSV< 10%).[17,26] If the patient was a responder on OD, a new fluid challenge was performed with a similar methodology until the variation in SV was <10% (Fig. 1). Ventilatory settings were kept constant during the study period: tidal volume 7 mL/kg, positive end expiratory pressure at 5 cm H2O and ventilatory rate at 14/min. PVI value was masked to the investigator in charge of the patient and Doppler data were the single accessible resources during fluid challenges. A third person not involved in the anesthesia collected the data. The study was terminated before surgical incision because of the risk of a potential artifact in the measurement of the plethysmographic variability.
Figure 1.
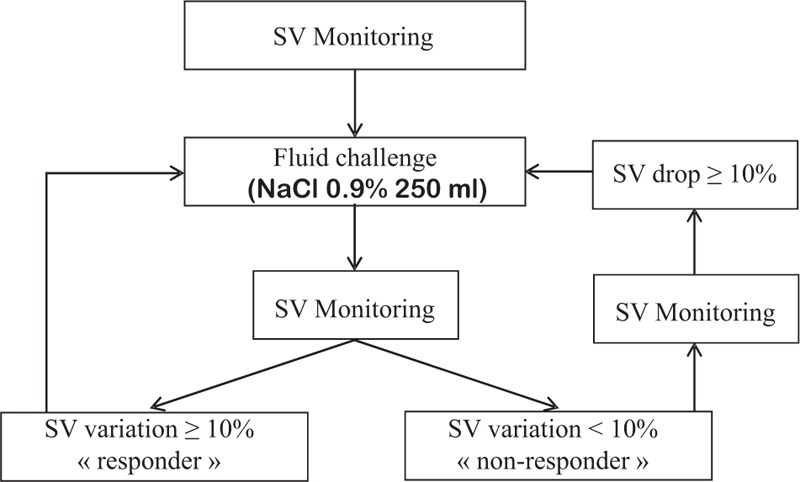
Protocol of fluid challenges during kidney transplantation. SV = stroke volume.
2.5. Data analysis
A priori sample size calculation of patients to be included was not performed because it was difficult to prospectively presage what would be the percentage of “responding patients” among the patients receiving a kidney transplant. It was decided to include 45 patients which is around twice of the number of patients usually included in such type of studies.[20,27]
Categorical variables, expressed as numbers (percentages), were compared using chi-square test. Continuous variables, expressed as median and interquartile range (25th–75th), were compared between responders and nonresponders to a fluid challenge by a Wilcoxon rank-sum test. A value of P < .05 was considered statistically significant.
An ROC curve about predictive performance of PVI to detect responders to a fluid challenge was drawn and a threshold was therefore obtained. In the case of pulse pressure variation, some authors have described a range of values between 9% and 13%, named as the grey zone, for which fluid responsiveness could not be predicted reliably and performance of PVI was examined with the same definition. Statistical analyses were performed using SPSS version 11.0 (SPSS Science Inc, Chicago, IL), and R 2.12.0 (The R Foundation for Statistical Computing).
3. Results
Forty-eight patients were eligible for the study and 44 were finally included. One kidney transplantation was cancelled after the patient had given his written consent, 2 transplantations were performed in the absence of one of the main investigators (AF and MLG) of the study, and 1 patient was excluded for unavailable data for PVI (Fig. 2).
Figure 2.
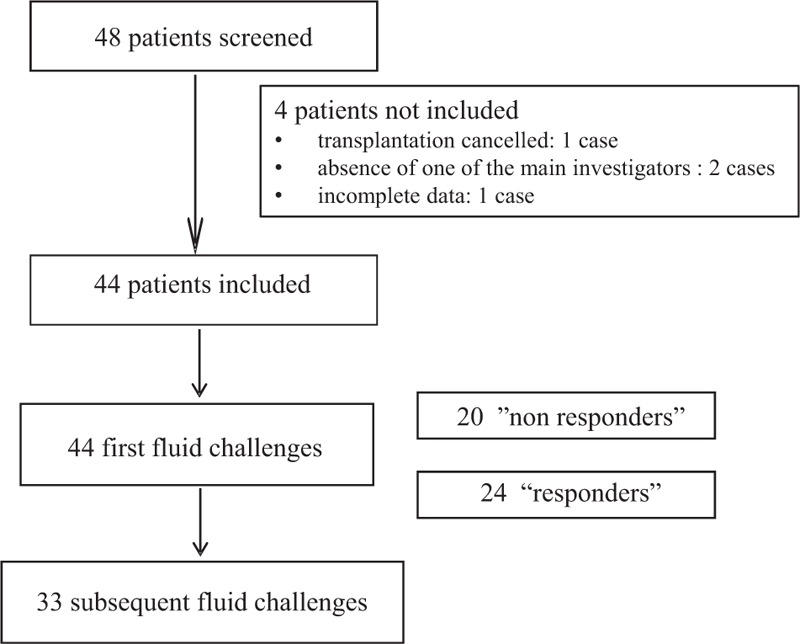
Flow chart.
Demographic characteristics are presented in Table 1. Blood loss was always <500 mL and was not present during the first fluid challenges following induction.
Table 1.
Patient characteristics.
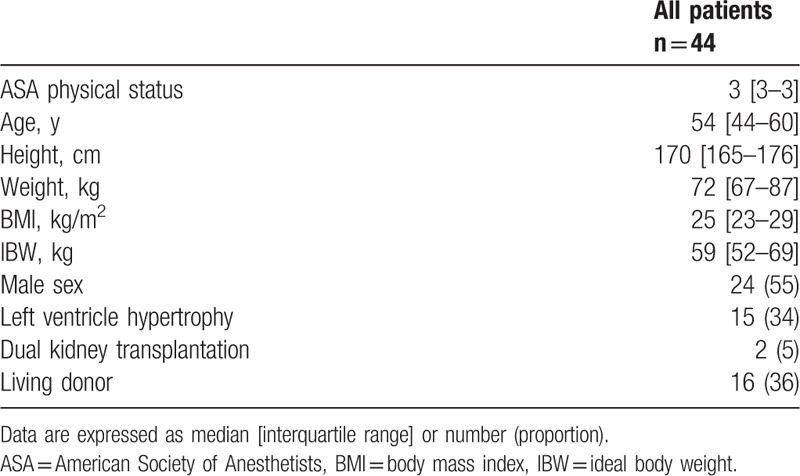
Seventy-six fluid challenges were performed before skin incision. Hemodynamic variables recorded before and after all fluid challenges are presented in Table 2. Every variable related to the Doppler measurement changed significantly while the heart rate, the mean arterial pressure, and the PVI were unchanged.
Table 2.
Hemodynamic variables before and after all fluid challenges.

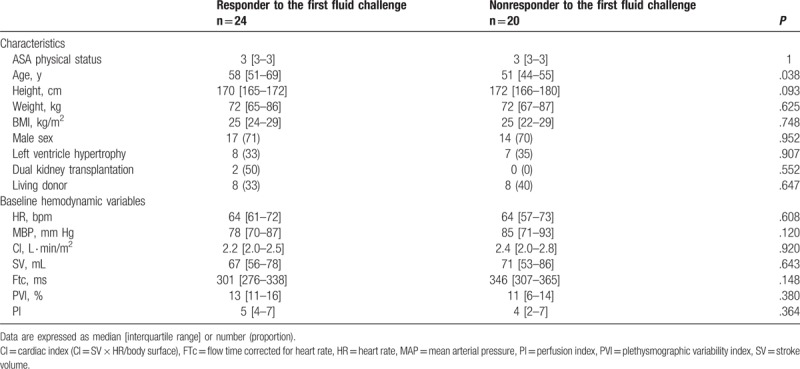
There were 24 responders (55% of the patients) and 20 nonresponders to the first fluid loading, their demographic characteristics and baseline hemodynamic variables are presented in Table 3. The only parameter which differed between responders and 20 nonresponders was age (P = .038).
Table 3.
Characteristics and baseline hemodynamic variables of responders and nonresponders to the first fluid challenge.
The area under the ROC curve for PVI was 0.49 (0.36–0.62) (P = .83) for all challenges and 0.61 (0.42–0.78) (P = .22) when considering only the first challenge. Among all the hemodynamic parameters considered, SV before fluid challenge was associated with the highest area under the ROC curve (0.679 [0.558–0.795], P = .007) (Fig. 3). A baseline PVI value of 10.5 had 59% sensitivity and 47% specificity for predicting a 10% SV increase considering all fluid challenges.
Figure 3.
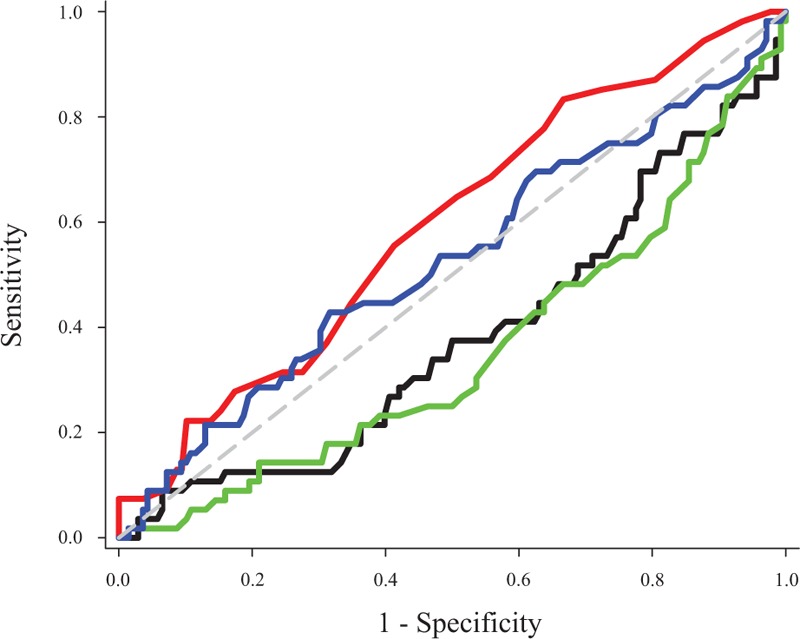
Area under the receiver operating characteristic (ROC) curve for flow time corrected for heart rate, plethysmographic variability index, stroke volume, and mean arterial pressure. Black line = flow time corrected for heart rate, blue line = mean arterial pressure, green line = stroke volume, red line = plethysmographic variability index.
Considering a grey zone for PVI from 9 to 13, 17 couplets of baseline PVI and SV variation are concordant, 14 discordant, and 13 in the grey zone. Consequently, the global concordance between PVI and OD dropped to 0.38 and the percentage of values in this zone was 29% (Fig. 4).
Figure 4.
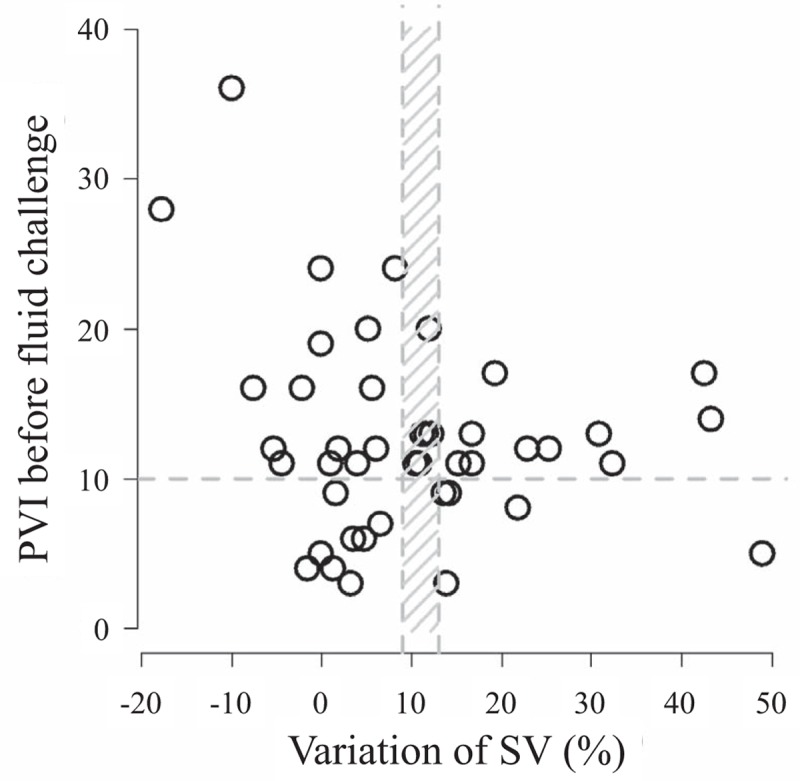
Repartition of couplets (PVI-delta SV). PVI = Plethysmographic Variability Index, SV = stroke volume.
Postoperative complications were mainly represented by primary graft dysfunction (3 vs 2 cases among responders and nonresponders, respectively), hemorrhage (2 vs 1 patient), and arrhythmia (1 case per group) with no difference between groups.
4. Discussion
Our results suggest that PVI measured through Massimo Radical 7 is not an accurate predictor of fluid responsiveness in anaesthetized patients during renal transplantation. Our data, mostly recorded in intraoperative conditions, are consistent with recent articles showing that PVI becomes an unreliable predictor of fluid responsiveness when patients undergo surgical stimulation.[17,20]
To date, OD is the only noninvasive device recommended to guide fluid therapy in the operating room. A fluid challenge rapidly gives information about volume status: a significant increase in SV indicates that volemia can be improved and optimal filling is reached when no further change occurs.[28] OD has been used in multiple prospective, randomized, controlled perioperative trials to guide fluid optimization. This is currently the only minimally invasive CO technology separately evaluated and endorsed by the United States Agency for Healthcare Research and Quality1 and the UK Centre for evidence-based purchasing.[11]
Cannesson et al[29,30] recently introduced a new parameter, the respiratory variations in pulse oximeter waveform amplitude (ΔPOP) to predict fluid responsiveness in mechanically ventilated patients whether in the operating room or in the intensive care unit.[31,32] A threshold of 13% has been proposed to be predictive of fluid responsiveness.[29] Measurement of ΔPOP was complex since the waveform is highly processed and filtered and PVI was then developed. This index is automatically and continuously calculated by software integrated in a pulse oximeter, making it totally noninvasive, needing minimal knowledge, and relatively cheap. The PVI belongs to the family of dynamic indicators for predicting fluid responsiveness, all derived from respiratory variations in arterial pulse pressure, inferior vena cava diameter and SV and having consistently been shown to be more accurate than static indicators in mechanically ventilated patients under general anesthesia.[14] Sandroni et al[23] concluded in their meta-analysis that ΔPOP and PVI are equally effective for predicting fluid responsiveness in ventilated adult patients in sinus rhythm. Several studies have shown that ΔPOP is an accurate predictor of fluid responsiveness in mechanically ventilated patients.[29,33] Cannesson et al[15,34] found that a PVI value >11.5% can predict ΔPOP >13% with good sensitivity and specificity. Nevertheless, the literature is divided on the ability of PVI to predict fluid responsiveness with sufficient accuracy in anaesthetized patients with favorable [15,18,35] and unfavorable studies.[20,22] Recently, Vos et al[19] have compared PVI in patients undergoing liver surgery to 2 other dynamic preload variables to predict fluid responsiveness: arterial pressure waveform-based variations in SV and pulse pressure (FloTrac-Vigileo device). PVI was unable to track changes after fluid administration despite providing an adequate prediction of fluid responsiveness. Moreover, it appears of limited value in critically ill patients receiving norepinephrine since it could not be measured 17% of the cases.[36] A recent meta-analysis retrieved 10 studies in the literature with a correct methodology and the authors concluded that there was a significant heterogeneity in the results. This could be explained by a lower accuracy of plethysmographic variability index in spontaneously breathing or pediatric patients and by studies that used preload challenges other than colloid fluid as in our study.[37]
The poor agreement between PVI and OD could be explained by different points in the present study. The finger probe may be questionable in this kind of surgery. It has been reported that a finger probe allows a better prediction of fluid responsiveness than an ear probe in patients undergoing colorectal surgery,[17] but chronic renal failure could lead to vascular and endothelial changes that may modify distal outflow and capillary distribution. Another limit in PVI determination involves PI, which was fundamental for PVI evaluation, as it was directly present in the mathematical formula of this predictor. But PI is influenced by changes in vascular tone, which modify the pulsatile component of plethysmographic waveforms. These variances range from the great arteries to peripheral vessels and could be induced by vascular disease, hypothermia, low CO, various vasoactive drugs, and the autonomic nervous system.[20,38,39] Moreover, some patients presented with diabetes, which is known to promote vascular and endothelial changes and specific response to different triggers related to autonomic nervous system dysfunction. Surgical stimulation may also alter the vasomotor tone and hence PI and PVI as previously described by Hoiseth et al.[20] The vasomotor tone is constant during a single respiratory cycle and does not alter the analysis of the relative changes in PI induced by mechanical ventilation, but it can change during surgical stimulation. In the present study, almost half of measurements occurred during surgery.
Another confounding factor may be the fluid challenge. In a meta-analysis, Sandroni et al[23] observed that for identification of fluid responders, sensitivity and specificity of PVI were higher in studies with a bolus of >250 mL (0.84 vs 0.72 [small bolus], P = .08 and .86 vs .68 [small bolus], P = .02), respectively. This could explain the difficulty in the present study to demonstrate a high accuracy between PVI and OD with a significant threshold at 10% of SV.[40] Another alternative for our protocol could have been the use of colloids, but this is no longer recommended in this indication.[41] We probably underestimated the fact that chronic renal failure is frequently associated with hypertension and restrictive cardiopathy.[5] Nevertheless, previous studies have concluded to the absence of modification in SV whatever the cardiac status except for major right ventricle failure.[42]
Finally, it is important to note that PVI may be evaluated using the current concept of a “grey zone.” The grey zone approach has been proposed to avoid the binary constraint of a “black-or-white” decision of the ROC curve approach that often does not fit the reality of clinical or screening practice.[24,43] Two cut-offs define the borders of the grey zone: the first cut-off allows exclusion of the diagnosis (fluid responsiveness in the current case) with near certainty; the second cut-off is chosen to include the diagnosis with near certainty. Intermediate values included in the grey zone correspond to a prediction not precise enough for diagnostic decision. In the case of PPV values, the grey zone approach identified a range of values between 9% and 13% for which fluid responsiveness could not be predicted reliably.[24] In our study, as shown in Figure 4, the minimum risk in the conclusion (10%) about responders was a PVI of 6 and the maximum risk not to consider a nonresponder was a PVI of 16. We consider this choice of an accurate “grey-zone” not acceptable due to the sample size and we referred to previous studies.
Our study presents some limitations. We had a relatively small number of volume loadings which was not really expected because we presupposed that these patients, just before a kidney transplantation would be “dry” related to preoperative extrarenal replacement and fasting. But the protocol changed just before starting the study with an extrarenal replacement without any loss of weight to avoid hypovolemia.
Our study was restricted to the time between anesthesia induction and skin incision to limit the disturbance of the plethysmographic signal due to any stimulation through sympathetic activation. Finally, we did not guide fluid therapy with OD or PVI throughout the surgery, but it was not the goal of the study. A posteriori calculation of the power of this nondifference study gives a weak value at 28% and makes any generalization very cautious.
In conclusion, in patients undergoing renal transplantation, PVI was not a reliable predictor of fluid responsiveness assessed with OD and it should not be used to guide fluid therapy.
Acknowledgments
The authors would like to thank Polly Gobin for her help with the English version.
Author contributions
Conceptualization: Morgan Le Guen, Arnaud Follin, Etienne Gayat, Marc Fischler.
Data curation: Morgan Le Guen, Arnaud Follin, Etienne Gayat.
Formal analysis: Morgan Le Guen, Etienne Gayat.
Investigation: Morgan Le Guen, Arnaud Follin.
Methodology: Morgan Le Guen, Etienne Gayat, Marc Fischler.
Validation: Morgan Le Guen, Arnaud Follin, Marc Fischler.
Writing – original draft: Morgan Le Guen, Arnaud Follin, Etienne Gayat, Marc Fischler.
Writing – review & editing: Morgan Le Guen, Arnaud Follin, Etienne Gayat, Marc Fischler.
Visualization: Etienne Gayat, Marc Fischler.
Funding acquisition: Marc Fischler.
Project administration: Marc Fischler.
Supervision: Marc Fischler.
Footnotes
[Esophageal Doppler ultrasound-based cardiac output monitoring for real-time therapeutic management of hospitalized patients. 2007. http://www.guideline.gov/resources/ahrq _products.aspx.].
Abbreviations: CO = cardiac output, OD = esophageal Doppler, PI = perfusion index, ΔPOP = respiratory variations in pulse oximeter waveform amplitude, PVI = pleth variability index, ROC = receiver operating characteristic, SV = stroke volume.
This work was supported by Hôpital Foch, Suresnes, France.
The authors have no conflicts of interest to disclose.
No registration of the study in a public registry since it was not a randomized controlled study. Ethics Committee: RCB-2010-A00367-32.
Implication Statement: In patients with terminal renal failure receiving a kidney transplant, the Pleth Variability Index is not able to discriminate between responders and nonresponders to a fluid challenge of 250 mL of crystalloid infused in <5 minutes, responsiveness being defined as an increase of the stroke volume ≥10%.
References
- [1].Schnuelle P, Johannes van der Woude F. Perioperative fluid management in renal transplantation: a narrative review of the literature. Transpl Int 2006;19:947–59. [DOI] [PubMed] [Google Scholar]
- [2].Dawidson I, Berglin E, Brynger H, et al. Intravascular volumes and colloid dynamics in relation to fluid management in living related kidney donors and recipients. Crit Care Med 1987;15:631–6. [DOI] [PubMed] [Google Scholar]
- [3].Dawidson I, Peters P, Sagalowsky A, et al. The effect of intraoperative fluid management on the incidence of acute tubular necrosis. Transplant Proc 1987;19:2056–7. [PubMed] [Google Scholar]
- [4].Willms CD, Dawidson IJ, Dickerman R, et al. Intraoperative blood volume expansion induces primary function after renal transplantation: a study of 96 paired cadaver kidneys. Transplant Proc 1991;23:1338–9. [PubMed] [Google Scholar]
- [5].Schiffrin EL, Lipman ML, Mann JF. Chronic kidney disease: effects on the cardiovascular system. Circulation 2007;116:85–97. [DOI] [PubMed] [Google Scholar]
- [6].Carlier MB, Paulus G, Maldague P, et al. Early toxic events in kidney of rat and man following administration of gentamicin at low doses. Arch Toxicol Suppl 1982;5:287–90. [DOI] [PubMed] [Google Scholar]
- [7].Luciani J, Frantz P, Thibault P, et al. Early anuria prevention in human kidney transplantation. Advantage of fluid load under pulmonary arterial pressure monitoring during surgical period. Transplantation 1979;28:308–12. [PubMed] [Google Scholar]
- [8].Chatterjee K. The Swan-Ganz catheters: past, present, and future. A viewpoint. Circulation 2009;119:147–52. [DOI] [PubMed] [Google Scholar]
- [9].Joshi GP. Intraoperative fluid restriction improves outcome after major elective gastrointestinal surgery. Anesth Analg 2005;101:601–5. [DOI] [PubMed] [Google Scholar]
- [10].Brandstrup B, Tonnesen H, Beier-Holgersen R, et al. Effects of intravenous fluid restriction on postoperative complications: comparison of two perioperative fluid regimens: a randomized assessor-blinded multicenter trial. Ann Surg 2003;238:641–8. [DOI] [PMC free article] [PubMed] [Google Scholar]
- [11].Singer M. Oesophageal Doppler. Curr Opin Crit Care 2009;15:244–8. [DOI] [PubMed] [Google Scholar]
- [12].Abbas SM, Hill AG. Systematic review of the literature for the use of oesophageal Doppler monitor for fluid replacement in major abdominal surgery. Anaesthesia 2008;63:44–51. [DOI] [PubMed] [Google Scholar]
- [13].Chytra I, Pradl R, Bosman R, et al. Esophageal Doppler-guided fluid management decreases blood lactate levels in multiple-trauma patients: a randomized controlled trial. Crit Care 2007;11:R24. [DOI] [PMC free article] [PubMed] [Google Scholar]
- [14].Michard F, Boussat S, Chemla D, et al. Relation between respiratory changes in arterial pulse pressure and fluid responsiveness in septic patients with acute circulatory failure. Am J Respir Crit Care Med 2000;162:134–8. [DOI] [PubMed] [Google Scholar]
- [15].Cannesson M, Desebbe O, Rosamel P, et al. Pleth variability index to monitor the respiratory variations in the pulse oximeter plethysmographic waveform amplitude and predict fluid responsiveness in the operating theatre. Br J Anaesth 2008;101:200–6. [DOI] [PubMed] [Google Scholar]
- [16].Loupec T, Nanadoumgar H, Frasca D, et al. Pleth variability index predicts fluid responsiveness in critically ill patients. Crit Care Med 2011;39:294–9. [DOI] [PubMed] [Google Scholar]
- [17].Hood JA, Wilson RJ. Pleth variability index to predict fluid responsiveness in colorectal surgery. Anesth Analg 2011;113:1058–63. [DOI] [PubMed] [Google Scholar]
- [18].Zimmermann M, Feibicke T, Keyl C, et al. Accuracy of stroke volume variation compared with pleth variability index to predict fluid responsiveness in mechanically ventilated patients undergoing major surgery. Eur J Anaesthesiol 2010;27:555–61. [DOI] [PubMed] [Google Scholar]
- [19].Vos JJ, Kalmar AF, Struys MM, et al. Comparison of arterial pressure and plethysmographic waveform-based dynamic preload variables in assessing fluid responsiveness and dynamic arterial tone in patients undergoing major hepatic resection. Br J Anaesth 2013;110:940–6. [DOI] [PubMed] [Google Scholar]
- [20].Hoiseth LO, Hoff IE, Myre K, et al. Dynamic variables of fluid responsiveness during pneumoperitoneum and laparoscopic surgery. Acta Anaesthesiol Scand 2012;56:777–86. [DOI] [PubMed] [Google Scholar]
- [21].De Backer D, Heenen S, Piagnerelli M, et al. Pulse pressure variations to predict fluid responsiveness: influence of tidal volume. Intensive Care Med 2005;31:517–23. [DOI] [PubMed] [Google Scholar]
- [22].Broch O, Bein B, Gruenewald M, et al. Accuracy of the pleth variability index to predict fluid responsiveness depends on the perfusion index. Acta Anaesthesiol Scand 2011;55:686–93. [DOI] [PubMed] [Google Scholar]
- [23].Sandroni C, Cavallaro F, Marano C, et al. Accuracy of plethysmographic indices as predictors of fluid responsiveness in mechanically ventilated adults: a systematic review and meta-analysis. Intensive Care Med 2012;38:1429–37. [DOI] [PubMed] [Google Scholar]
- [24].Cannesson M, Le Manach Y, Hofer CK, et al. Assessing the diagnostic accuracy of pulse pressure variations for the prediction of fluid responsiveness: a “gray zone” approach. Anesthesiology 2011;115:231–41. [DOI] [PubMed] [Google Scholar]
- [25].Gan H, Cannesson M, Chandler JR, et al. Predicting fluid responsiveness in children: a systematic review. Anesth Analg 2013;117:1380–92. [DOI] [PubMed] [Google Scholar]
- [26].Lee JH, Kim JT, Yoon SZ, et al. Evaluation of corrected flow time in oesophageal Doppler as a predictor of fluid responsiveness. Br J Anaesth 2007;99:343–8. [DOI] [PubMed] [Google Scholar]
- [27].Davies SJ, Minhas S, Wilson RJ, et al. Comparison of stroke volume and fluid responsiveness measurements in commonly used technologies for goal-directed therapy. J Clin Anesth 2013;25:466–74. [DOI] [PubMed] [Google Scholar]
- [28].Singer M, Bennett ED. Noninvasive optimization of left ventricular filling using esophageal Doppler. Crit Care Med 1991;19:1132–7. [DOI] [PubMed] [Google Scholar]
- [29].Cannesson M, Attof Y, Rosamel P, et al. Respiratory variations in pulse oximetry plethysmographic waveform amplitude to predict fluid responsiveness in the operating room. Anesthesiology 2007;106:1105–11. [DOI] [PubMed] [Google Scholar]
- [30].Solus-Biguenet H, Fleyfel M, Tavernier B, et al. Non-invasive prediction of fluid responsiveness during major hepatic surgery. Br J Anaesth 2006;97:808–16. [DOI] [PubMed] [Google Scholar]
- [31].Feissel M, Kalakhy R, Banwarth P, et al. Plethysmographic variation index predicts fluid responsiveness in ventilated patients in the early phase of septic shock in the emergency department: a pilot study. J Crit Care 2013;28:634–9. [DOI] [PubMed] [Google Scholar]
- [32].Natalini G, Rosano A, Taranto M, et al. Arterial versus plethysmographic dynamic indices to test responsiveness for testing fluid administration in hypotensive patients: a clinical trial. Anesth Analg 2006;103:1478–84. [DOI] [PubMed] [Google Scholar]
- [33].Feissel M, Teboul JL, Merlani P, et al. Plethysmographic dynamic indices predict fluid responsiveness in septic ventilated patients. Intensive Care Med 2007;33:993–9. [DOI] [PubMed] [Google Scholar]
- [34].Cannesson M, Slieker J, Desebbe O, et al. The ability of a novel algorithm for automatic estimation of the respiratory variations in arterial pulse pressure to monitor fluid responsiveness in the operating room. Anesth Analg 2008;106:1195–200. [DOI] [PubMed] [Google Scholar]
- [35].Trepte CJ, Eichhorn V, Haas SA, et al. Comparison of an automated respiratory systolic variation test with dynamic preload indicators to predict fluid responsiveness after major surgery. Br J Anaesth 2013;111:736–42. [DOI] [PubMed] [Google Scholar]
- [36].Monnet X, Dres M, Ferre A, et al. Prediction of fluid responsiveness by a continuous non-invasive assessment of arterial pressure in critically ill patients: comparison with four other dynamic indices. Br J Anaesth 2012;109:330–8. [DOI] [PubMed] [Google Scholar]
- [37].Yin JY, Ho KM. Use of plethysmographic variability index derived from the Massimo((R)) pulse oximeter to predict fluid or preload responsiveness: a systematic review and meta-analysis. Anaesthesia 2012;67:777–83. [DOI] [PubMed] [Google Scholar]
- [38].Landsverk SA, Hoiseth LO, Kvandal P, et al. Poor agreement between respiratory variations in pulse oximetry photoplethysmographic waveform amplitude and pulse pressure in intensive care unit patients. Anesthesiology 2008;109:849–55. [DOI] [PubMed] [Google Scholar]
- [39].Shelley KH, Murray WB, Chang D. Arterial-pulse oximetry loops: a new method of monitoring vascular tone. J Clin Monit 1997;13:223–8. [DOI] [PubMed] [Google Scholar]
- [40].Cannesson M, de Backer D, Hofer CK. Using arterial pressure waveform analysis for the assessment of fluid responsiveness. Expert Rev Med Devices 2011;8:635–46. [DOI] [PubMed] [Google Scholar]
- [41].Cittanova ML, Leblanc I, Legendre C, et al. Effect of hydroxyethylstarch in brain-dead kidney donors on renal function in kidney-transplant recipients. Lancet 1996;348:1620–2. [DOI] [PubMed] [Google Scholar]
- [42].Reuter DA, Kirchner A, Felbinger TW, et al. Usefulness of left ventricular stroke volume variation to assess fluid responsiveness in patients with reduced cardiac function. Crit Care Med 2003;31:1399–404. [DOI] [PubMed] [Google Scholar]
- [43].Feinstein AR. The inadequacy of binary models for the clinical reality of three-zone diagnostic decisions. J Clin Epidemiol 1990;43:109–13. [DOI] [PubMed] [Google Scholar]


