Abstract
To investigate the relationship between the regulatory immune network and endoplasmic reticulum stress (ERS) in patients with different stages of chronic kidney disease (CKD).
A total of 91 patients diagnosed with CKD were divided into different groups according to the stage of disease and treatment with hemodialysis (HD) or peritoneal dialysis (PD). Routine blood and biochemical tests were performed in patients in the different CKD groups and in healthy controls (n = 20). The frequencies of T helper type 17 (Th17) and regulatory T (Treg) cells in the overall T cell population were measured by flow cytometric analysis. Levels of Th17 cell (IL-17) and Treg cell (IL-10) cytokines and the ERS markers CCAAT-enhancer-binding protein homologous protein (CHOP) and glucose-regulated protein 78 (GRP78) were measured by enzyme-linked immunosorbent assay in serum samples collected from controls and patients. Correlations between each parameter and serum creatinine were analyzed by Spearman rank correlation and regression test.
CKD stage showed a positive correlation with serum creatinine level, and increased and decreased percentages of Th17 and Treg cells, respectively, reflected in an increased Th17/Treg cell ratio. Consistent with this, CKD stage was positively correlated with serum concentrations of IL-17 and negatively correlated with serum IL-10 levels. Moreover, serum levels of CHOP and GRP78 increased with advancing CKD stage. These correlations were most pronounced in patients in the CKD5 group, who also had the poorest response to HD and PD treatment, compared with CKD5 patients in the nondialysis group. Correlation analysis showed that serum levels of CHOP and GRP78 were independently and positively correlated with the ratio of Th17/Treg cells.
We have found that an increased Th17/Treg cell ratio and increased serum levels of ERS markers correlate with the progression of CKD. Our results indicate that the interplay between regulation of the immune network and management of ERS is closely associated with the pathogenesis of CKD. Although HD and PD treatment manage chronic kidney conditions and prevent further deterioration of renal function, they have limited effects on improving the immune disorder and relieving ERS. Our study suggests a potential new direction for development of therapeutic strategies in CKD.
Keywords: chronic kidney disease, endoplasmic reticulum stress, Th17 cell, Treg cell
1. Introduction
Chronic kidney disease (CKD) is characterized by progressive loss of kidney function, and has developed into a major global health problem. The incidence and mortality of CKD have increased over the past few decades,[1] with 1 prediction of the prevalence of individuals in the United States with end-stage CKD at over 700,000 by 2015.[2] Moreover, a 2012 Chinese survey found that the overall prevalence of CKD in adults was approximately 10.8%, placing a huge burden on healthcare resources.[3] The absence of an effective treatment to retard or reverse the progression of CKD highlights the need for a better understanding of the mechanistic basis of its development and progression, and of designing novel therapeutic strategies in CKD.
Immune imbalance has been proposed as a critical contributing factor in pathogenesis of CKD, with early studies implicating T helper type 1 (Th1) and type 2 (Th2) cells.[4,5] The subsequent discovery of novel T helper subpopulations such as Th17 and regulatory T (Treg) cells, heralded the concept of T cell-mediated immunity.[6] The ratio of Th17 and Treg cells is important for maintaining the immune balance, and a solid body of evidence has demonstrated the role of imbalances in this ratio in tissue inflammation, autoimmunity, and a wide variety of diseases,[7–10] including uremic and end-stage CKD.[11,12]
Endoplasmic reticulum (ER) is a vital organelle in eukaryotes that is responsible for the production and proper folding of proteins. Consonant with this, ER stress (ERS) and the subsequent unfolded-protein response (UPR) have been shown to be among the earliest events occurring in the initiation of many diseases.[13] The recent discovery of crosstalk between ERS pathways and immune signaling suggests the possibility of their cooperation in modulating the immune responses.[14] For example, defective MHC class I molecule expression has been associated with induction of UPR,[15] and protein kinase C-mediated T cell activation has been linked to induction of ERS.[16] Moreover, macrophages have been shown to respond to ERS and UPR via synergistic production of interferon beta.[17] Collectively these studies suggest that the ERS response may be a mechanism of immune alteration. Here, we set out to investigate the association between Th17/Treg imbalance and ERS in different stages of CKD, with the ultimate goal of improving our understanding CKD pathophysiology and the prospects of novel therapies in this disease.
2. Materials and methods
2.1. Patients
All study subjects were recruited from the Dialysis Management and Blood Purification Center in the Second Affiliated Hospital of Xi’an Jiaotong University. The primary disease for all patients was chronic glomerulonephritis, and the inclusion criteria were as follows: stable blood pressure, absence of complicated infection and heart failure within the last 3 months, no blood transfusion or adjuvant therapies received within the past month, no hepatitis or connective tissue diseases, not pregnant or breast feeding, absence of severe cardiovascular, cerebrovascular or hematopoietic complications and other primary diseases, and no severe mental disorders. The patients were not taking any immunosuppressive agents or other drugs which might affect the results of measurement in the study.
A total of 91 patients were enrolled and divided into 3 groups (CKD3, CKD4, and CKD5) according to the CKD stages calculated from measured glomerular filtration rate (GFR). Using the abbreviated modification of diet in renal disease (MDRD) equation to calculate the estimated GFR:GFR (mL/min per 1.73 m2) = 186 × (creatinine/88.4)−1.154 × (age)−0.203 × (0.742 if female). CKD3 (30 < GFR < 59), CKD 4 (15 < GFR < 29), and CKD5 (GFR < 15). Patients in CKD5 group were further divided into 3 subgroups based on the dialysis treatment: nondialysis uremic group (n = 14), hemodialysis group (HD, n = 18), and peritoneal dialysis group (PD, n = 18). The patients in the HD group had undergone regular HD treatment (4-h treatment given 3 times a week) for more than 3 months using a sugar-free low-calcium dialysis solution with low-molecular weight heparin as anticoagulant. The dialysis membrane was polysulfone with an area of 1.2 to 1.5 m2, and the blood flow was set to 200 to 250 mL/min, dialysate flow 500 mL/min. The patients in the PD group had undergone regular PD treatment for more than 3 months using low-calcium PD solution. The catheters placed in patients were adopted from the standard Tenckhoff PD catheter, and the daily volume of replacement fluid was 8000 mL.
Twenty healthy volunteers (12 males and 8 females) were recruited to the control group. They had no medical history of hypertension, diabetes, hepatitis, tuberculosis and related immune disorders, and no preceding infection.
This study was approved by the Ethics Committee in the Second Affiliated Hospital of Xi’an Jiaotong University. Written informed consent was obtained from all patients and healthy volunteers participating in the study.
2.2. Sample preparation
Fasting hemospasia was performed in all participants. Blood samples from the patients in the HD group were collected prior to HD on the day of treatment. Routine blood test that included a complete blood count and routine clinical chemistry tests were performed. Peripheral blood (3 mL) was loaded into heparin anticoagulant containing tubes (Sigma, Santa Clara, CA) and peripheral blood mononuclear cells (PBMCs) were purified by density gradient centrifugation. Another 3 mL of peripheral blood was centrifuged at 3000 rpm for 5 min, and the supernatant (serum) was collected and stored at −80°C until further use.
PBMCs were cultured at a density of 2 × 10⁶ cells/mL in RPMI 1640 complete medium supplemented with 10% (v/v) heat inactivated fetal bovine serum and 1% (v/v) penicillin/streptomycin (Gibco-BRL, Gaithersburg, MD). Cells were treated with 2 μL/mL leukocyte activation cocktail with monensin and GolgiPlug (Brefeldin A) (BD Biosciences, Franklin Lakes, NJ) and incubated for 4 h in a 5% CO2 incubator at 37°C. Cells were collected by centrifugation at 250g for 5 min and resuspended in Stain Buffer (BD Biosciences) at a density of 1 × 10⁷/mL for flow cytometric analysis of Th17 and Treg cell numbers.
2.3. Flow cytometry
Approximately 1 × 10⁶ cells were fixed in 2 mL 1× Human FoxP3 Buffer A (BD Biosciences) for 10 to 20 min at room temperature (RT) and protected from light. Fixed cells were washed with 2 mL Stain Buffer followed by centrifugation at 500g for 5 min. Cells were permeabilized in 0.5 mL 1× Human FoxP3 Buffer C (BD Biosciences) for 30 min at RT and protected from light. Cells were washed with Stain Buffer and resuspended to 1 × 10⁷ cells/mL in 100 μL aliquots. Antihuman antibodies (PerCP-Cy5.5-CD4, phycoerythrin (PE)-IL-17A, and Alexa Fluor647-FoxP3) or isotype controls (PerCP-Cy5.5-, PE-, and PEAlexa Fluor 647-conjugated mouse IgG1 κ isotype controls) were added to the cells (20 μL/test) and incubated for 40 min at RT protected from light. After staining, cells were washed twice with Stain Buffer and analyzed immediately using BD FACSCalibur flow cytometer (BD Biosciences). Approximately 20,000 to 30,000 cells were acquired and results were analyzed by FlowJo Data Analysis software (FlowJo LLC, Ashland, OR).
2.4. Enzyme-linked immunosorbent assay
All serum samples were stored at −80°C and processed all at once. Serum levels of IL-10, IL-17, glucose-regulated protein 78 (GRP78), and CCAAT-enhancer-binding protein homologous protein (CHOP) were determined by enzyme-linked immunosorbent assay (ELISA) using specific detection reagents following the manufacturer's instruction (Westang, Shanghai, China). Each assay was performed in triplicates and the experiments were repeated once.
2.5. Statistical analysis
Data were analyzed using SPSS 16.0 Statistical Analysis software (SPSS Inc, Chicago, IL). Measurement data are expressed as mean ± standard deviation. Comparison of means between groups was made by 1-way analysis of variance, and comparison between 2 groups was made by Fisher least significant difference test. Spearman rank-order correlation was used for bivariate correlation analysis. A P value < .05 was considered statistically significant, and P < .01 indicated a more significant difference.
3. Results
3.1. Clinical characteristics of CKD patients
A total of 91 patients with primary chronic glomerulonephritis were classified according to the following CKD stages: stage 3 CKD (30 < GFR < 59, 12 males and 10 females, mean age: 58.9 ± 19.0 years), stage 4 CKD (15 < GFR < 29, 10 males and 9 females, mean age: 58.3 ± 13.1 years), and stage 5 CKD (GFR < 15). Stage 5 CKD was further divided into NHD group (8 males and 6 females, mean age: 54 ± 20.1 years), HD group (9 males and 9 females, mean age: 48.3 ± 17.5 years), and PD group (9 males and 9 females, mean age: 46.6 ± 15.0 years). Healthy volunteers (n = 20) were recruited to the control group, including 12 males and 8 females with a mean age of 48.9 ± 11.4 years.
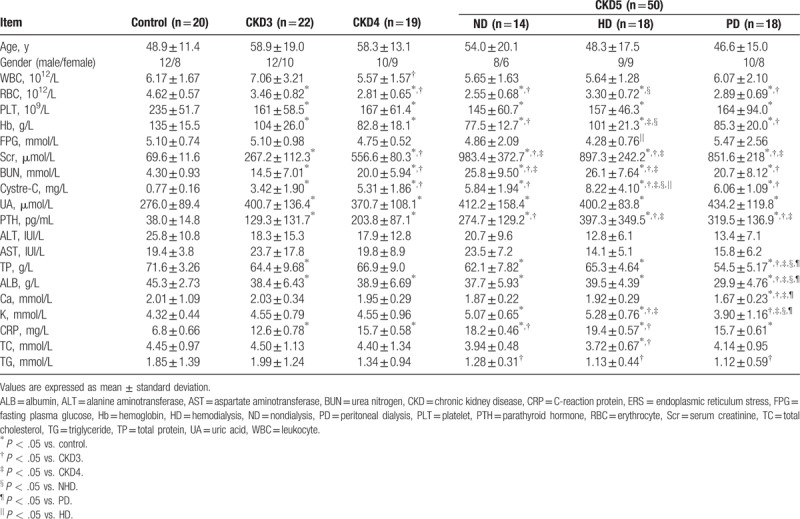
Routine blood and clinical chemistry tests were performed using the blood samples obtained from all participants. Complete blood count was measured, and liver and renal functions were assessed. Results were analyzed for each group and comparison was made between groups (Table 1). Significant differences between the healthy controls and CKD patients were observed in parameters, such as serum creatinine, urea nitrogen, uric acid, parathyroid hormone, albumin, and C-reaction protein, indicating the presence of chronic renal disorders and impaired kidney function in CKD patients (Table 1). There were no significant differences in age and sex distributions between the healthy controls and patients in different CKD stages (Table 1).
Table 1.
Clinical characteristics of all participants.
3.2. Increasing Th17/Treg cell ratio is positively correlated with CKD stage
The percentage of Th17 (CD4+IL-17A+) cells was significantly increased in CKD patients compared with controls (P < .05), and the percentage of Th17 cells increased with advancing CKD stage (Table 2, Fig. 1A and B). By contrast, the percentage of Treg (CD4+FoxP3+) cells was lower in CKD3 and CKD4 patients than in healthy controls (P < .05), with the lowest percentage of Treg cells observed in CKD5 patients without dialysis treatment (P < .05; Table 2, Fig. 1A and C). The changes in the frequencies of Th17 and Treg cells were reflected in an increase in the ratio of Th17/Treg cells in CKD patients that was positively correlated with disease stage (Fig. 1D).
Table 2.
Flow cytometric analysis of Th17 and Treg cells ( ).
).

Figure 1.
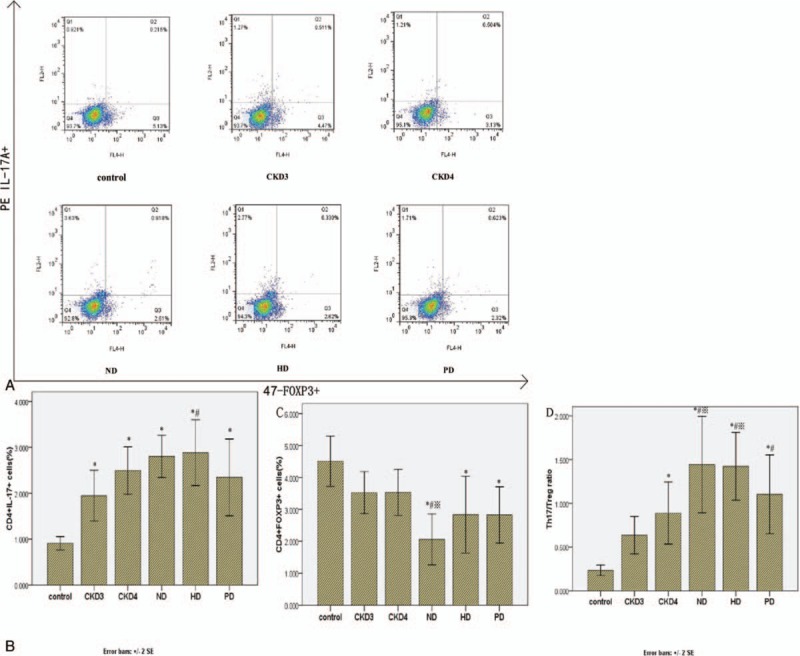
Percentage of Th17 and Treg cells in CKD patients and healthy controls. (A) Representative flow cytometric analysis from a single patient in each group. PBMCs were stained with PerCP-Cy5.5-conjugated CD4 antibodies and PE-conjugated IL-17A and Alexa Fluor 647-conjugated FoxP3 antibodies to measure the percentages of Th17 cells (CD4+IL-17+) and Treg cells (CD4+FoxP3+). (B) The percentage of Th17 cells averaged from all patients within the group. (C) The percentage of Treg cells averaged from all patients within the group. (D) The ratio of Th17/Treg cells in each group. CKD = chronic kidney disease, PBMCs = peripheral blood mononuclear cells.
3.3. Correlation of Th17/Treg cell ratio with serum creatinine level in CKD patients
Serum creatinine is among the most accurate and reliable indicators of kidney function. We next investigated the correlation between the peripheral blood frequencies of Th17 and Treg cells and serum creatinine level. Serum creatinine levels in both controls and CKD patients were found to be positively correlated with the frequency of Th17 cells and the ratio of Th17/Treg cells (r = 0.546, P < .01 and r = 0.659, P < .01, respectively), and negatively correlated with the frequency of Treg cells (r = −0.413, P < .01) (Fig. 2). Th17/Treg ratio was more robustly correlated with serum creatinine level (r = 0.659) than with the frequency of Th17 (r = 0.546) or Treg (r = −0.413) cells indicated that Th17/Treg cell ratio is a potential indicator for the degree of renal damage and progression of kidney disease.
Figure 2.
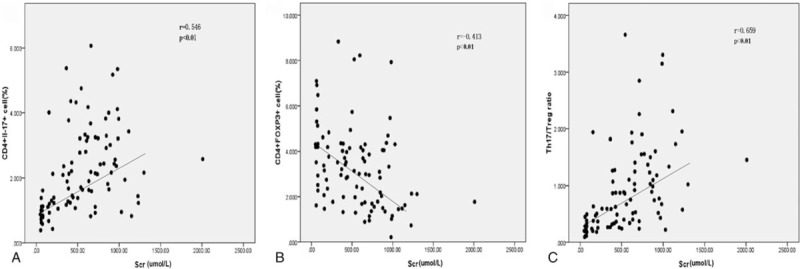
Correlations of the frequency of Th17, frequency of Treg cells, and ratio of Th17/Treg cells with serum creatinine level in controls and CKD patients. Serum creatinine level was measured in all study participates and its correlation with the frequency of Th17 cells (A) and Treg cells (B) and the ratio of Th17/Treg cells (C) was analyzed by Spearman rank correlation and regression test. The P value and r value are indicated in the graphs. CKD = chronic kidney disease.
3.4. Serum levels of Th17 and Treg cytokines are correlated with creatinine level in CKD patients
The proinflammatory and regulatory functions of Th17 and Treg cells are mediated by IL-17 and IL-10, respectively, serum levels of which were determined by ELISA in CKD patients and healthy controls. The concentration of IL-17 was significantly higher in the CKD patients and increased with the progression of CKD (Fig. 3A). By contrast, the concentration of IL-10 was lower in all CKD groups than in the control group (P < .05), but not between different CKD groups (Fig. 3B) (Table 3). Moreover, serum creatinine levels in serum CKD patients correlated positively with serum IL-17 levels (r = 0.666, P < .01), and negatively with serum IL-10 levels (r = −0.346, P = .01; Fig. 3C and D). Dialysis treatment had no significant effect on the level of IL-17 and IL-10 in CKD5 patients.
Figure 3.
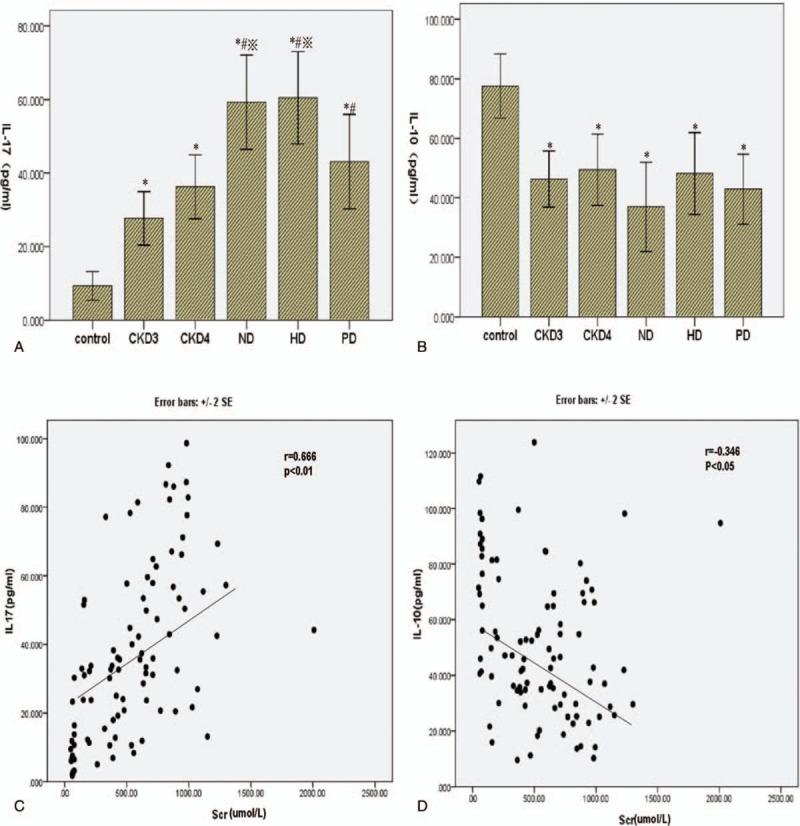
Correlations of IL-17 and IL-10 with serum creatinine level. (A) The serum concentration of IL-17 was measured by ELISA in the control and CKD groups. (B) The serum concentration of IL-10 was measured by ELISA in the control and CKD groups. (C) The correlation between serum IL-17 concentration and creatinine level was analyzed by Spearman rank correlation and regression test. (D) The correlation between serum IL-10 concentration and creatinine level was analyzed similarly. The P value and r value are indicated in the graphs. CKD = chronic kidney disease, ELISA = enzyme-linked immunosorbent assay.
Table 3.
Serum concentrations of cytokines (IL-17 and IL-10) in CKD patients and normal control subjects ( , pg/mL).

3.5. Correlation of serum levels of the ERS markers CHOP and GRP78 with creatinine level in CKD patients
Historical evidence has linked ERS to the pathophysiology of kidney disease. We next evaluated the correlation of serum levels of the ERS markers CHOP and GRP78 with creatinine levels in CKD patients. Serum levels of CHOP (Fig. 4A) and GRP78 (Fig. 4C) were significantly higher in CKD patients than in controls (P < .05) and positively correlated with CKD stage (P < .05) (Table 4). By contrast, serum levels of neither CHOP nor GRP78 were altered by dialysis treatment. In addition, serum creatinine level in CKD patients were positively correlated with serum levels of CHOP (r = 0.603, P < .01 and GRP78 (r = 0.802, P < .01) (Fig. 4B and D), reflecting an association between the extent of ERS and the severity of renal damage.
Figure 4.
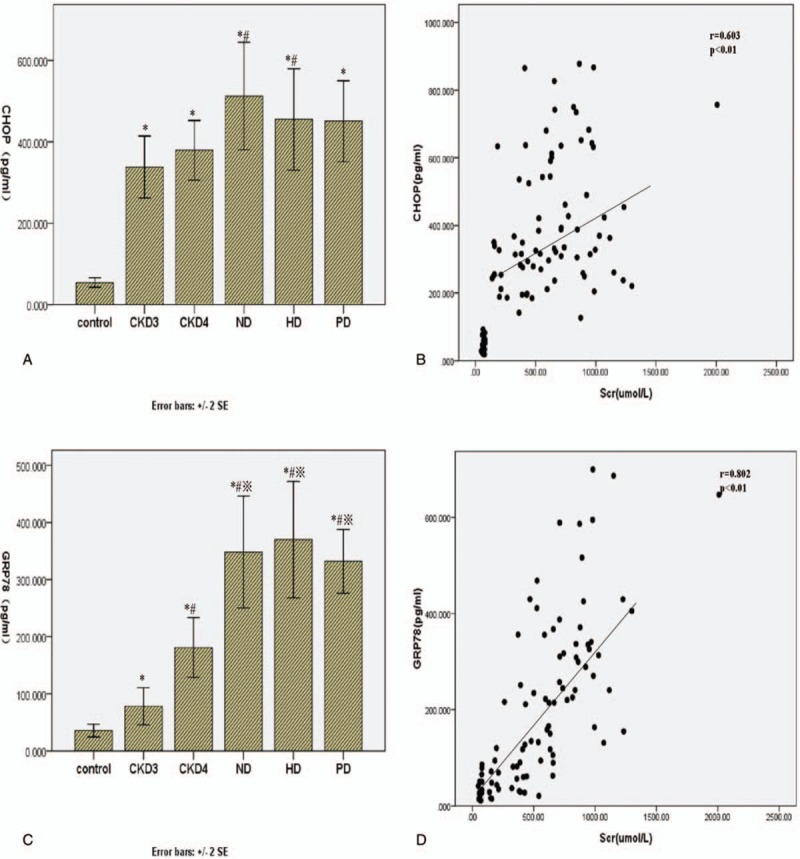
Correlation between ERS markers and serum creatinine level. Serum concentrations of CHOP (A) and GRP78 (B) were measured by ELISA in the control group and different CKD groups. The correlation between serum creatinine level and the CHOP (C) and GRP78 (D) concentrations was analyzed by Spearman rank correlation and regression test. The P value and r value are indicated in the graphs. CHOP = CCAAT-enhancer-binding protein homologous protein, CKD = chronic kidney disease, ELISA = enzyme-linked immunosorbent assay, ERS = endoplasmic reticulum stress, GRP78 = glucose-regulated protein 78.
Table 4.
Serum concentrations of ERS marks in CKD patients and normal control subjects ( , pg/mL).

3.6. Correlation of the serum Th17/Treg cell ratio with serum ERS marker levels in CKD patients
Having established that the Th17/Treg cell ratio and serum levels of ERS markers were independently correlated with creatinine levels in CKD patients, we next asked whether these parameters were correlated with each other. We found that the ratio of Th17/Treg cells was positively correlated with serum CHOP and GRP78 levels (r = 0.465, P < .01 and r = 0.498, P < .01, respectively) (Fig. 5), indicating that ERS and imbalances in immune components might interact to influence the progression of CKD.
Figure 5.
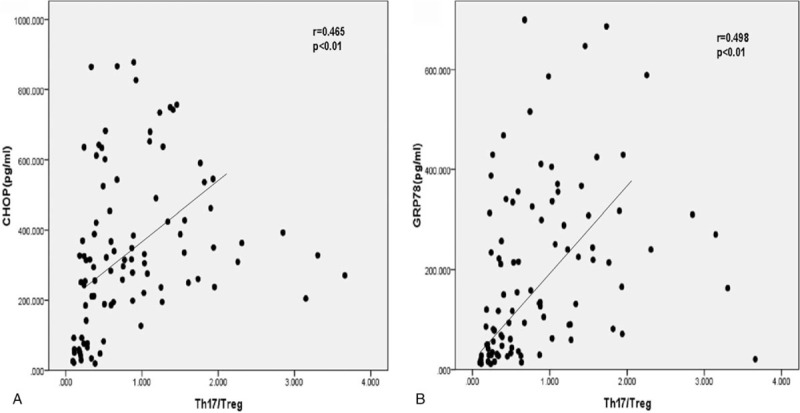
Correlation between serum concentration of ERS markers and ratio of Th17/Treg cells in CKD patients. (A) Correlation between the concentration of CHOP and ratio of Th17/Treg was analyzed by Spearman rank correlation and regression test. (B) Correlation between the concentration of GRP78 and ratio of Th17/Treg was analyzed similarly. The P value and r value are indicated in the graphs. CHOP = CCAAT-enhancer-binding protein homologous protein, CKD = chronic kidney disease, ERS = endoplasmic reticulum stress, GRP78 = glucose-regulated protein 78.
4. Discussion
In the present study, we investigated the changes in Th17 and Treg cell populations and the levels of specific cytokines and ERS markers in patients with differing CKD stages. In addition, we assessed the impact of different dialysis treatments on restoration of immune balance. We found that compared with controls CKD patients had an increased percentage of Th17 cells and a decreased percentage of Treg cells, reflected in an increased Th17/Treg cell ratio that was positively correlated with CKD stage. Corresponding differences in serum levels of Th17 (IL-17) and Treg (IL-10)-specific cytokines were observed in CKD patients. Moreover, the percentage of Th17 cells, serum IL-17 level, and Th17/Treg ratio were all positively correlated with the severity of kidney disease, as determined by serum creatinine levels. By contrast, the percentage of Treg cells was negatively correlated with serum creatinine level. Furthermore, serum levels of the ERS markers CHOP and GRP78 were positively correlated with CKD stage and serum creatinine levels. Interestingly, while the ratio of Th17/Treg cells showed positive correlation with the levels of CHOP and GRP78, dialysis treatment did not appreciably affect immune balance or amelioration of ERS. Our data suggest a possible mechanism of CKD pathogenesis and disease progression, and indicate a rationale for development of new therapeutic strategies that target the interplay between the immune network and ERS responses.
Risk factors for CKD include metabolism, hemodynamics, and genetic predisposition. With recent advances in studies of CKD pathophysiology, inflammation, and dysregulated immune responses have emerged as important factors contributing to the gradual loss of renal function in CKD patients.[18] Moreover, the risk of developing heart disease and cancer increases markedly in CKD patients.[19,20] Th17 cells and their major effector cytokine IL-17 play important roles in tissue inflammation and are involved in various immune disorders and human malignancies, including rheumatoid arthritis, systemic lupus, multiple myeloma, and cancer.[21–25] However, the role of Th17 cells in CKD pathogenesis and disease progression remains inconclusive. On the other hand, Treg cells generate immune mediators (IL-10) or immunosuppressive cytokines (TGF-beta) to modulate immune responses and autoimmunity in immune tolerance.[26,27] Th17 and Treg cells function in an interrelated and antagonistic manner, and the balance between the ratio of 2 is important in the maintenance of human health. Although IL-17 is considered a specific Th17 cytokine, IL-17-producing Treg cells have been identified during inflammation or upon activation.[28,29] The balancing mechanism of Th17 and Treg cells is therefore extremely complicated and has not yet been fully elucidated. That said, the role of Th17/Treg imbalance in the development of various diseases, including autoimmune conditions and cancer, has been well established.[12,30,31]
In the present study, the frequency of Th17 cells was markedly increased in CKD3 patients; however, the frequency of Treg cells was significantly decreased in CKD5 patients. It is possible that the decrease of Treg cell frequency was following the increase of Th17 cell frequency. As a result, the Th17/Treg cell ratio was significantly increased with the progression of CKD. These results suggest that in early stage of CKD, the proinflammatory Th17 cells are antagonized by large numbers of immunosuppressive Treg cells. However, with the progressing of CKD, the Treg cells are consumed in late stage, which causes an increase in Th17 cells and creates an imbalance between Th17 and Treg cells. That explains the increased incidence of complications in late CKD stage. In addition, we demonstrated that the serum creatinine level, an indicator of renal function, was positively correlated with the frequency of Th17 cells, but was negatively correlated with the frequency of Treg cells. An even stronger positive correlation was observed between serum creatinine levels and the Th17/Treg cell ratio. These results clearly indicate that the imbalance between proinflammatory and immunosuppressive cells plays a critical role in CKD progression. What remains unclear is whether the fluctuations in the Th17/Treg ratio are a cause or a result of renal failure.
Advanced stage CKD often requires dialysis treatment, including HD and PD. In our study, although dialysis treatment improved the survival of CKD patients, it had a limited effect on restoring the balance between Th17 and Treg cells, a result that is consistent with a previous study in end-stage renal disease patients.[32] Dialysis augments reduced renal function by removing metabolic waste products and toxins and maintaining the electrolyte balance and acid–base equilibrium. However, due to the possible risks present in HD, such as severe anemia due to blood loss during treatment, hemodynamic instability, aluminum intoxication,[33] and dialyzer biocompatibility,[34] immune disorders may be worsened by dialysis. Although PD has advantages over HD in these respects,[35] problems such as increased protein loss, excessive glucose intake, and triglyceride abnormalities make it ineffective in restoring immune balance in CKD patients. Further investigation is required to identify new therapeutic agents or strategies to improve the patient's immune microenvironment.
ERS is a physiological and pathological disorder of ER characterized by impaired protein and lipid synthesis, and the disturbance of intracellular calcium homeostasis. Markers for ERS include GRP78 as a marker for activation of ERS response, and CHOP as a primary marker for induction of apoptotic pathway.[36,37] Numerous studies have indicated the involvement of ERS in the pathophysiology of kidney diseases by causing damage to glomerular mesangial cells, podocytes, and tubular epithelial cells.[38–40] Consistent with their previously established association with ERS, we found that serum levels of GRP78 and CHOP were positively correlated with serum creatinine levels in CKD patients. The results reiterate that the severity of CKD correlates with the degree of ERS. ERS response is a normal physiological response and has protective effects in patients with adequate renal compensation. However, as the renal function deteriorates, ERS response might impair renal function and the extent of renal damage could conceivably increase during progression of CKD.
Immune disorder and ERS have long been reported as 2 independent causes/consequences of CKD. CHOP and GRP78 in circulation can be contributed by any cells beyond T cells. Although ERS-induced inflammation has been described in previous studies,[41,42] the relationship between ERS and immune regulation is largely unknown. Given the profound impact of oxidative stress on T cell activation and function,[43] ERS—a subtype of oxidative stress—could potentially contribute to immune dysregulation. Our study identified a positive correlation between the serum levels of the ERS markers CHOP and GRP78 and the ratio of Th17/Treg cells in CKD patients, indicating a crosstalk between these 2 components. Because inflammation is a common downstream event of ERS response and Th17/Treg imbalance, we hypothesize that inflammation is a major mediator of ERS and immune dysfunction that contributes significantly to disease progression.
In conclusion, our study is to our knowledge the first to demonstrate the relationship between the ratio of Th17/Treg cells and changes in ERS marker levels and CKD stage. The antioxidant effects of alpha lipoic acid[44] and the flavonoid quercetin[45] suggest the potential of novel therapeutic approaches in CKD. Future studies will focus on the identification of the antioxidant that targets crosstalk between ERS and immune imbalance in order to protect the kidney from inflammation-induced tissue damage.
Acknowledgments
The authors thank the Department of Nephrology in Xi’an Jiaotong University for providing the peripheral blood samples. The authors express our gratitude to all the study participants.
Author contributions
Conceptualization: Yang Xu, Jin Han, Yan Ou.
Data curation: Dan Zhu.
Formal analysis: Dan Zhu, Yang Xu, Pengqian Zhang, Jin Han.
Funding acquisition: Yan Ou, Xiaojing Zhu,Shuiqin Li, Qiaona Zhang, Yang Xu, Pengqian Zhang.
Investigation: Xiaojing Zhu, Shuiqin Li, Dan Zhu, Pengqian Zhang.
Methodology: Shuiqin Li, Dan Zhu, Jin Han.
Project administration: Shuiqin Li, Jie Gao.
Resources: Xiaojing Zhu, Shuiqin Li, Qiaona Zhang, Zhaoyang Duan, Jie Gao.
Software: Zhaoyang Duan, Jie Gao.
Supervision: Yan Ou.
Validation: Xiaojing Zhu, Qiaona Zhang.
Writing – original draft: Xiaojing Zhu, Yan Ou.
Writing – review and editing: Yan Ou.
Footnotes
Abbreviations: CHOP = CCAAT-enhancer-binding protein homologous protein, CKD = chronic kidney disease, ELISA = enzyme-linked immunosorbent assay, ERS = endoplasmic reticulum stress, GFR = glomerular filtration rate, GRP78 = glucose-regulated protein 78, HD = hemodialysis, MDRD = modification of diet in renal disease, PBMCs = peripheral blood mononuclear cells, PD = peritoneal dialysis, UPR = unfolded-protein response.
This work was supported by the Science and Technology Research Fund of Shaanxi Province (No. 2016SF-329) and the National Natural Science Foundation of China (No. 81200554).
The authors have no conflicts of interest to disclose.
References
- [1].Lozano R, Naghavi M, Foreman K, et al. Global and regional mortality from 235 causes of death for 20 age groups in 1990 and 2010: a systematic analysis for the Global Burden of Disease Study 2010. Lancet 2012;380:2095–128. [DOI] [PMC free article] [PubMed] [Google Scholar]
- [2].Gilbertson DT, Liu J, Xue JL, et al. Projecting the number of patients with end-stage renal disease in the United States to the year 2015. J Am Soc Nephrol 2005;16:3736–41. [DOI] [PubMed] [Google Scholar]
- [3].Zhang L, Wang F, Wang L, et al. Prevalence of chronic kidney disease in China: a cross-sectional survey. Lancet 2012;379:815–22. [DOI] [PubMed] [Google Scholar]
- [4].Libetta C, Rampino T, Dal Canton A. Polarization of T-helper lymphocytes toward the Th2 phenotype in uremic patients. Am J Kidney Dis 2001;38:286–95. [DOI] [PubMed] [Google Scholar]
- [5].Alvarez-Lara MA, Carracedo J, Ramirez R, et al. The imbalance in the ratio of Th1 and Th2 helper lymphocytes in uraemia is mediated by an increased apoptosis of Th1 subset. Nephrol Dial Transplant 2004;19:3084–90. [DOI] [PubMed] [Google Scholar]
- [6].Zhu J, Paul WE. Heterogeneity and plasticity of T helper cells. Cell Res 2010;20:4–12. [DOI] [PMC free article] [PubMed] [Google Scholar]
- [7].Liu H, Leung BP. CD4+CD25+ regulatory T cells in health and disease. Clin Exp Pharmacol Physiol 2006;33:519–24. [DOI] [PubMed] [Google Scholar]
- [8].Park H, Li Z, Yang XO, et al. A distinct lineage of CD4 T cells regulates tissue inflammation by producing interleukin 17. Nat Immunol 2005;6:1133–41. [DOI] [PMC free article] [PubMed] [Google Scholar]
- [9].Vila J, Isaacs JD, Anderson AE. Regulatory T cells and autoimmunity. Curr Opin Hematol 2009;16:274–9. [DOI] [PubMed] [Google Scholar]
- [10].Nelson BH. IL-2, regulatory T cells, and tolerance. J Immunol 2004;172:3983–8. [DOI] [PubMed] [Google Scholar]
- [11].Hendrikx TK, van Gurp EA, Mol WM, et al. End-stage renal failure and regulatory activities of CD4+CD25bright+FoxP3+ T-cells. Nephrol Dial Transplant 2009;24:1969–78. [DOI] [PubMed] [Google Scholar]
- [12].Zhang J, Hua G, Zhang X, et al. Regulatory T cells/T-helper cell 17 functional imbalance in uraemic patients on maintenance haemodialysis: a pivotal link between microinflammation and adverse cardiovascular events. Nephrology (Carlton) 2010;15:33–41. [DOI] [PubMed] [Google Scholar]
- [13].Dufey E, Sepulveda D, Rojas-Rivera D, et al. Cellular mechanisms of endoplasmic reticulum stress signaling in health and disease. 1. An overview. Am J Physiol Cell Physiol 2014;307:C582–94. [DOI] [PubMed] [Google Scholar]
- [14].Muralidharan S, Mandrekar P. Cellular stress response and innate immune signaling: integrating pathways in host defense and inflammation. J Leukoc Biol 2013;94:1167–84. [DOI] [PMC free article] [PubMed] [Google Scholar]
- [15].de Almeida SF, Fleming JV, Azevedo JE, et al. Stimulation of an unfolded protein response impairs MHC class I expression. J Immunol 2007;178:3612–9. [DOI] [PubMed] [Google Scholar]
- [16].Pino SC, O'Sullivan-Murphy B, Lidstone EA, et al. Protein kinase C signaling during T cell activation induces the endoplasmic reticulum stress response. Cell Stress Chaperones 2008;13:421–34. [DOI] [PMC free article] [PubMed] [Google Scholar]
- [17].Smith JA, Turner MJ, DeLay ML, et al. Endoplasmic reticulum stress and the unfolded protein response are linked to synergistic IFN-beta induction via X-box binding protein 1. Eur J Immunol 2008;38:1194–203. [DOI] [PMC free article] [PubMed] [Google Scholar]
- [18].Miyamoto T, Carrero JJ, Stenvinkel P. Inflammation as a risk factor and target for therapy in chronic kidney disease. Curr Opin Nephrol Hypertens 2011;20:662–8. [DOI] [PubMed] [Google Scholar]
- [19].Foley RN. Infectious complications in chronic dialysis patients. Perit Dial Int 2008;28suppl 3:S167–71. [PubMed] [Google Scholar]
- [20].Matas AJ, Simmons RL, Kjellstrand CM, et al. Increased incidence of malignancy during chronic renal failure. Lancet 1975;1:883–6. [DOI] [PubMed] [Google Scholar]
- [21].Alexandrakis MG, Pappa CA, Miyakis S, et al. Serum interleukin-17 and its relationship to angiogenic factors in multiple myeloma. Eur J Intern Med 2006;17:412–6. [DOI] [PubMed] [Google Scholar]
- [22].Kohno M, Tsutsumi A, Matsui H, et al. Interleukin-17 gene expression in patients with rheumatoid arthritis. Mod Rheumatol 2008;18:15–22. [DOI] [PubMed] [Google Scholar]
- [23].Maddur MS, Miossec P, Kaveri SV, et al. Th17 cells: biology, pathogenesis of autoimmune and inflammatory diseases, and therapeutic strategies. Am J Pathol 2012;181:8–18. [DOI] [PubMed] [Google Scholar]
- [24].Wong CK, Lit LC, Tam LS, et al. Hyperproduction of IL-23 and IL-17 in patients with systemic lupus erythematosus: implications for Th17-mediated inflammation in auto-immunity. Clin Immunol 2008;127:385–93. [DOI] [PubMed] [Google Scholar]
- [25].Su X, Ye J, Hsueh EC, et al. Tumor microenvironments direct the recruitment and expansion of human Th17 cells. J Immunol 2010;184:1630–41. [DOI] [PubMed] [Google Scholar]
- [26].Costantino CM, Baecher-Allan CM, Hafler DA. Human regulatory T cells and autoimmunity. Eur J Immunol 2008;38:921–4. [DOI] [PMC free article] [PubMed] [Google Scholar]
- [27].Sakaguchi S. Naturally arising CD4+ regulatory T cells for immunologic self-tolerance and negative control of immune responses. Annu Rev Immunol 2004;22:531–62. [DOI] [PubMed] [Google Scholar]
- [28].Beriou G, Costantino CM, Ashley CW, et al. IL-17-producing human peripheral regulatory T cells retain suppressive function. Blood 2009;113:4240–9. [DOI] [PMC free article] [PubMed] [Google Scholar]
- [29].Voo KS, Wang YH, Santori FR, et al. Identification of IL-17-producing FOXP3+ regulatory T cells in humans. Proc Natl Acad Sci USA 2009;106:4793–8. [DOI] [PMC free article] [PubMed] [Google Scholar]
- [30].Ephrem A, Chamat S, Miquel C, et al. Expansion of CD4+CD25+ regulatory T cells by intravenous immunoglobulin: a critical factor in controlling experimental autoimmune encephalomyelitis. Blood 2008;111:715–22. [DOI] [PubMed] [Google Scholar]
- [31].Somasundaram R, Jacob L, Swoboda R, et al. Inhibition of cytolytic T lymphocyte proliferation by autologous CD4+/CD25+ regulatory T cells in a colorectal carcinoma patient is mediated by transforming growth factor-beta. Cancer Res 2002;62:5267–72. [PubMed] [Google Scholar]
- [32].Chung BH, Kim KW, Sun IO, et al. Increased interleukin-17 producing effector memory T cells in the end-stage renal disease patients. Immunol Lett 2012;141:181–9. [DOI] [PubMed] [Google Scholar]
- [33].Tzanno-Martins C, Azevedo LS, Orii N, et al. The role of experimental chronic renal failure and aluminium intoxication in cellular immune response. Nephrol Dial Transplant 1996;11:474–80. [PubMed] [Google Scholar]
- [34].Sanaka T, Koremoto M. Selection guidelines for high-performance membrane. Contrib Nephrol 2011;173:30–5. [DOI] [PubMed] [Google Scholar]
- [35].Gokal R, Figueras M, Olle A, et al. Outcomes in peritoneal dialysis and haemodialysis—a comparative assessment of survival and quality of life. Nephrol Dial Transplant 1999;14suppl 6:24–30. [DOI] [PubMed] [Google Scholar]
- [36].Hammadi M, Oulidi A, Gackiere F, et al. Modulation of ER stress and apoptosis by endoplasmic reticulum calcium leak via translocon during unfolded protein response: involvement of GRP78. FASEB J 2013;27:1600–9. [DOI] [PubMed] [Google Scholar]
- [37].Li Y, Guo Y, Tang J, et al. New insights into the roles of CHOP-induced apoptosis in ER stress. Acta Biochim Biophys Sin (Shanghai) 2014;46:629–40. [DOI] [PubMed] [Google Scholar]
- [38].Chiang CK, Hsu SP, Wu CT, et al. Endoplasmic reticulum stress implicated in the development of renal fibrosis. Mol Med 2011;17:1295–305. [DOI] [PMC free article] [PubMed] [Google Scholar]
- [39].He F, Chen S, Wang H, et al. Regulation of CD2-associated protein influences podocyte endoplasmic reticulum stress-mediated apoptosis induced by albumin overload. Gene 2011;484:18–25. [DOI] [PubMed] [Google Scholar]
- [40].Inagi R. Endoplasmic reticulum stress in the kidney as a novel mediator of kidney injury. Nephron Exp Nephrol 2009;112:e1–9. [DOI] [PubMed] [Google Scholar]
- [41].Garg AD, Kaczmarek A, Krysko O, et al. ER stress-induced inflammation: does it aid or impede disease progression? Trends Mol Med 2012;18:589–98. [DOI] [PubMed] [Google Scholar]
- [42].Verfaillie T, Garg AD, Agostinis P. Targeting ER stress induced apoptosis and inflammation in cancer. Cancer Lett 2013;332:249–64. [DOI] [PubMed] [Google Scholar]
- [43].Larbi A, Kempf J, Pawelec G. Oxidative stress modulation and T cell activation. Exp Gerontol 2007;42:852–8. [DOI] [PubMed] [Google Scholar]
- [44].Li Y, Shen H, Shi J, et al. The effects of alpha lipoic acid in preventing oxidative stress-induced retinal pigment epithelial cell injury. Can J Physiol Pharmacol 2014;92:765–72. [DOI] [PubMed] [Google Scholar]
- [45].Ferraresi R, Troiano L, Roat E, et al. Essential requirement of reduced glutathione (GSH) for the anti-oxidant effect of the flavonoid quercetin. Free Radic Res 2005;39:1249–58. [DOI] [PubMed] [Google Scholar]


