

Abstract
Background:
Whether the diagnosis value of computed tomography angiography (CTA) for intracranial aneurysm is in accordance with magnetic resonance angiography (MRA) remains inconclusive. This meta-analysis aims to synthesize relevant studies to compare the diagnostic efficacies of the 2 methods.
Methods:
Potentially relevant studies were selected through PubMed, Embase, Wanfang, Chongqing VIP, and China National Knowledge Infrastructure databases by using the core terms “computer tomography angiography” (CTA) and “magnetic resonance angiography” (MRA) and “intracranial aneurysm∗” in the titles, abstracts, and keywords of the articles. Quality Assessment for Diagnostic Accuracy Studies (QUADAS-2) was utilized to evaluate the quality. Pooled sensitivity, specificity, positive likelihood ratio (PLR), negative likelihood ratio (NLR), and diagnostic odds ratio (DOR) were count. Summary receiver operating characteristic curves (SROC) and area under the curve (AUC) were used to summarize the overall diagnostic performance. Statistical analyses were performed by Stata version 12.0 and MetaDisc 1.4 software.
Results:
Ten articles were identified in this current paper. For CTA, the pooled estimates of diagnostic parameters for intracranial aneurysm were as follows: sensitivity, 0.84 (95%CI = 0.81–0.86); specificity, 0.85 (95%CI = 0.79–0.89); PLR, 4.09 (95%CI = 2.45–6.81); NLR, 0.18 (95%CI = 0.11–0.28); DOR, 23.74 (95%CI = 10.49–53.74); AUC, 0.90, respectively. For MRA, the pooled estimates of diagnostic parameters for intracranial aneurysm were as follows: sensitivity, 0.80 (95%CI = 0.77–0.83); specificity, 0.87 (95%CI = 0.82–0.91); PLR, 3.61 (95%CI = 1.72–7.55); NLR; 0.27 (95%CI = 0.21–0.35); DOR, 16.77 (95%CI = 7.38–38.11); AUC, 0.87, respectively. No significant difference was found the AUC value between CTA and MRA for intracranial aneurysm (Z = 0.828, P > .05).
Conclusion:
This comprehensive meta-analysis demonstrated that the diagnosis value of CTA was in accordance with MRA for intracranial aneurysm. However, considering the limitation of sample size, the results should be treated with caution.
Keywords: CTA, intracranial aneurysm, meta-analysis, MRA
1. Introduction
The prevalence of intracranial aneurysm in the general population is approximately 1% to 5%.[1–4] Ruptured intracranial aneurysm is reportedly the dominant cause leading to nontraumatic subarachnoid hemorrhage, and it can give raise to severe disability and even death.[5–7] Thus, a precise diagnosis is especially important to the patients with intracranial aneurysm.
In clinical practice, the conventionally accepted gold standard for the detection of intracranial aneurysm is digital subtraction angiography (DSA).[8–10] Despite the high sensitivity and specificity of DSA, several flaws have restricted its wide application. First and foremost, the high cost of DSA puts the technology beyond some families. Secondly, DSA requires a high level of skill. Thirdly, DSA can lead to a minimal invasive procedure, such as cerebral thromboembolism and contrast nephrotoxicity.[11,12] Thus, an imaging tool that is fast, efficient, convenient, affordable, and noninvasive is required in clinical practice.
Computed tomography angiography (CTA) and magnetic resonance angiography (MRA) have been widely used to screen intracranial aneurysms. Prior clinical evaluations that compared CTA or MRA with DSA revealed that the diagnostic value of CTA or MRA approaches that of DSA. A recent investigation[13] pooled 8 studies to explore the accuracy of subtraction CTA compared with DSA for diagnosing intracranial aneurysm; the pooled sensitivity and specificity were 96% and 91%, respectively. In addition, the author also suggested that CTA is a highly sensitive, specific and noninvasive imaging method to diagnose intracranial aneurysms. Another investigation[14] pooled 26 studies that addressed the diagnostic value of MRA based on DSA; for time of flight-MRA, the sensitivity and specificity were 86% and 84%, respectively, with rates of 86% and 89%, respectively, for contrast-enhanced MRA. Our review of previous articles indicates that comparative weakness of studies comparing the diagnostic value between CTA and MRA performed on the same objects with intracranial aneurysms, with varied results. For example, Xu et al[15] studied 98 patients with suspected aneurysms to compare the diagnosis accuracy of CTA and MRA; the sensitivity and specificity was 95% and 67% for CTA, and 71% and 50% for MRA. However, Hiratsuka et al[16] found the diagnosis value of the 2 methods was similar.
This meta-analysis systematically compares the diagnosis value between CTA and MRA for intracranial aneurysms.
2. Materials and methods
2.1. Literature search
This meta-analysis was designed according to the Preferred Reporting Items for Systematic Reviews and Meta-Analysis (PRISMA) recommendations. Two investigators independently conducted a comprehensive literature search using several large databases using the terms “computer tomography angiography” (CTA) and “magnetic resonance angiography” (MRA) and “intracranial aneurysm∗” in the article titles, abstracts, and keywords. The databases included PubMed-Medline (1966–October 2017), Embase (1950–October 2017), China National Knowledge Infrastructure (CNKI, 1994–October 2017), Wanfang Data (1980–October 2017), and Chongqing VIP (1989–October 2017). Also, the reference lists of the identified articles were evaluated to identify relevant studies.
2.2. Study selection
Two reviewers (YY and LM) independently reviewed the potential articles on the basis of predetermined inclusion and exclusion criteria. At the end of the review, in case of divergences of opinion for the articles, a third reviewer evaluated whether the article in question was eligible. All the selected studies needed to meet the following inclusion criteria: studies adopted a clinical study design based on a human population; intracranial aneurysms were identified by CTA or MRA; studies provided sufficient information to calculate effect size; articles were in English or Chinese; and in case of duplicated cohorts, the study with the largest number of patients were included. Any study that failed to meet these criteria was excluded.
2.3. Data extraction
The same 2 investigators independently extracted the study information using a standardized form for each study. The basic information included the name of the first author, year of publication, country, mean age of participants, and sample size. In addition, they extracted the information with true positive (TP), false positive (FP), false negative (FN), and true negative (TN) from each study to pool the effect size of diagnosis accuracy. If required, information that had previously been omitted was retrieved by communication with the authors of the studies.
2.4. Quality assessment
In this review, Chen X and Xiong M independently assessed the quality of the included studies according to the Quality Assessment of Diagnostic Accuracy Studies—version 2 (QUADAS-2) scale.[17] This scale has 14 items and covers 4 domains (patient selection, index test, reference standard, flow, and timing). For each case, the answer should be provided as yes/no/unclear in order to evaluate it. “Yes” indicated a low risk of bias for this domain. “No” or “unclear” presented lacking the details or not certain, and indicated a potential bias.
2.5. Ethical approval
No ethical approval was required because all the data were extracted from the previous published articles.
2.6. Statistical analyses
Statistical analyses were carried out by Stata version 12.0 (Stata Corporation, College Station, TX) and MetaDisc 1.4 (XI. Cochrane Colloquium, Barcelona, Spain). In this review, we pooled sensitivity, specificity, positive likelihood ratio (PLR), negative likelihood ratio (NLR), and diagnostic odds ratio (DOR) with 95% confidence intervals (CI) to evaluate CTA and MRA diagnosis accuracy for intracranial aneurysms. In addition, summary receiver-operating curves (SROC) and area under the SROC curve (AUC) were performed to explain the interaction between sensitivity and specificity and the diagnostic ability respectively. Q-statistics was used to evaluate the heterogeneity. I2 was determined to assess the degree of heterogeneity between studies. If P > .10 by Q test and I2 < 50%, no obvious heterogeneity existed.[18] If so, a fixed effects model (Mantel–Haenszel method) was adopted. Conversely, a random effects model (DerSimonian and Laird method) was performed.[19,20] To further determine the difference in AUC between CTA and MRA for intracranial aneurysm, Z test was performed.
In diagnostic accuracy studies, the predominant cause of heterogeneity was threshold effect. In order to identify the threshold effect, Spearman's correlation coefficient between logit of sensitivity and logit of (1-speciticity) was calculated. P < .05 indicated that the threshold effect existed.
2.7. Publication bias
Publication bias was accessed by Deeks’ funnel plot asymmetry test. If P < .05, the potential publication bias was absent.[21]
3. Results
3.1. Literature search
In this meta-analysis, the initial search strategy yielded 376 relevant citations. Of these, 74 articles were retrieved for detailed evaluation and 62 were excluded. Finally, 10 articles met the rigid inclusion criteria.[15,16,22–29] The flowchart of study selection is shown in Figure 1.
Figure 1.
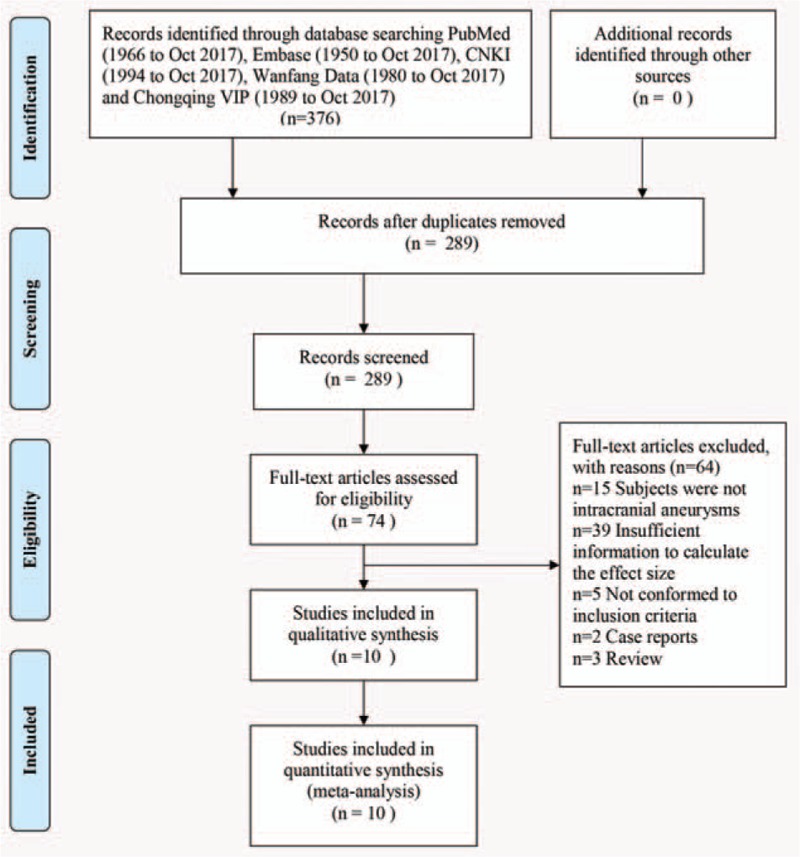
Flowchart of study selection procedure.
3.2. Study characteristics
The main characteristics of the included studies are shown in Table 1. The publication year ranged from 2001 to 2017. Among the 10 studies, 868 subjects were evaluated by CTA and 872 were by MRA. Six studies were conducted in China,[15,22–26] 3 in the United Kingdom,[27–29], and one in the United States.[16] Three studies had a prospective design,[16,27,29], 6 had a retrospective design,[15,22–26] and 1 did not report detailed information.[28] Of the 10 studies, 2 used DSA and operation as the reference standard for the final result of intracranial aneurysms[24,26] and 6 used DSA as the reference standard.[15,16,22,23,25,29] Details were not provided for the remaining 2 studies.[27,28]
Table 1.
Characteristics of included studies.

3.3. Quality assessment
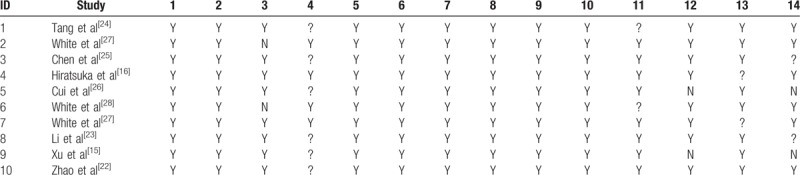
We used the QUADAS-2 checklist to assess the quality of the included studies. The details were provided in Table 2. The overall quality of the included studies was favorable, with all studies fulfilling 11 or more of the 14 items.
Table 2.
Quality assessment of included studies.
3.4. Diagnostic accuracy
3.4.1. CTA
To assess the threshold effect heterogeneity, the Spearman correlation coefficient was used to analyze the diagnostic threshold. The Spearman correlation coefficient for CTA was 0.299 (P = .402), which suggested that not enough evidence supported a threshold effect heterogeneity. The pooled results showed that the combined sensitivity, specificity, PLR, and NLR were 0.84 (95% CI, 0.81–0.86; Fig. 2A), 0.85 (95% CI, 0.79–0.89; Fig. 2B), 4.09 (95% CI, 2.45–6.81; Fig. 2C), and 0.18 (95% CI, 0.11–0.28; Fig. 2D), respectively. The pooled DOR was 23.74 (95% CI, 10.49–53.74; Fig. 3A). The SROC curve revealed a Q value of 0.83, and the AUC was 0.90 (Fig. 4A). The result of Deeks’ funnel plot asymmetry test suggested no evidence for the presence of publication bias (P = .56; Fig. 5A).
Figure 2.
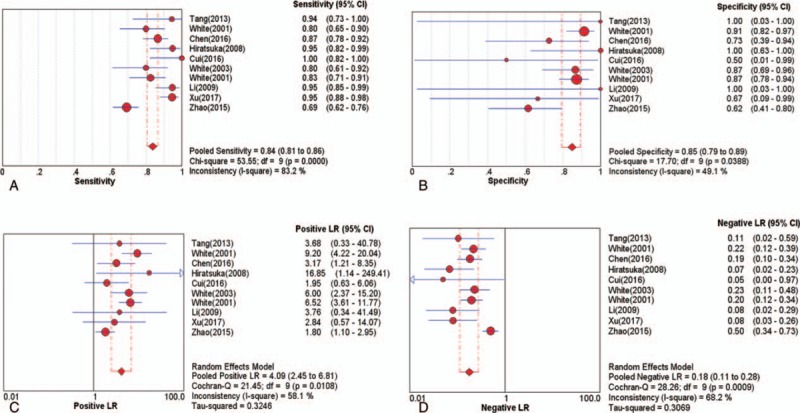
The pooled diagnostic indices for the diagnosis of intracranial aneurysm through CTA (A) sensitivity (B) specificity (C) positive LR (D) Negative LR. CTA = computed tomography angiography, LR = likelihood ratio.
Figure 3.
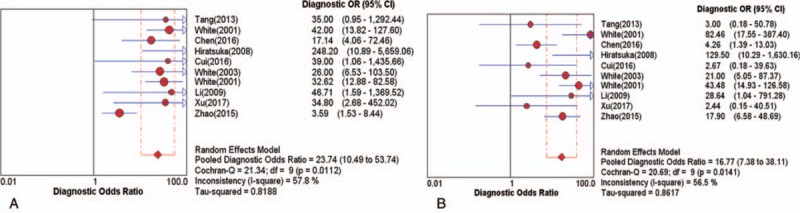
Diagnostic odds ratio (DOR) (A) CTA (B) MRA. CTA = computed tomography angiography, DOR = diagnostic odds ratio, MRA = magnetic resonance angiography.
Figure 4.
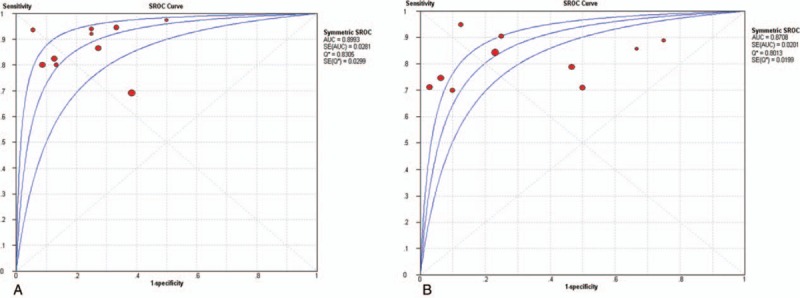
Summary receiver characteristics (SROC) (A) CTA (B) MRA. CTA = computed tomography angiography, MRA = magnetic resonance angiography, SROC = summary receiver operating characteristic curves.
Figure 5.
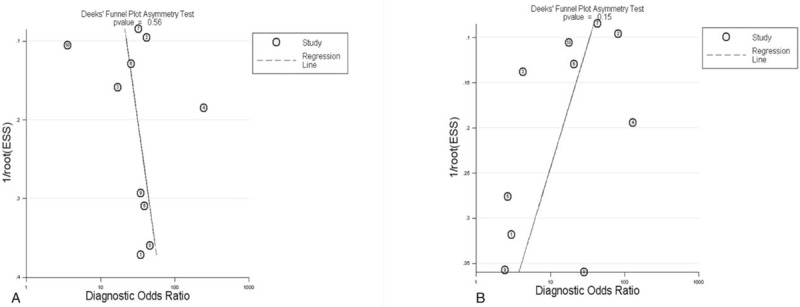
Deeks’ funnel plot (A) CTA (B) MRA. CTA = computed tomography angiography, MRA = magnetic resonance angiography.
3.4.2. MRA
The Spearman correlation coefficient for the diagnostic threshold of MRA was 0.358 (P = .310). This indicated insufficient evidence of heterogeneity resulting from threshold effect. The overall pooled sensitivity, specificity, PLR, and NLR were 0.80 (95% CI, 0.77–0.83; Fig. 6A), 0.87 (95% CI, 0.82–0.91; Fig. 6B), 3.61 (95% CI, 1.72–7.55; Fig. 6C), and 0.27 (95% CI, 0.21–0.35; Fig. 6D), respectively. The pooled DOR was 16.77 (95% CI, 7.38–38.11; Fig. 3B). The SROC curve showed the Q value was 0.80, and the AUC was 0.87 (Fig. 4B). The result of Deeks’ funnel plot asymmetry test indicated there was no publication bias (P = .15; Fig. 5B).
Figure 6.
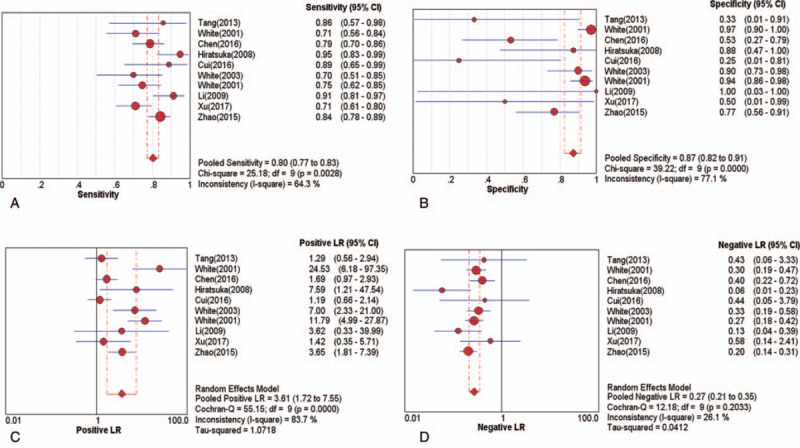
The pooled diagnostic indices for the diagnosis of intracranial aneurysm through MRA (A) sensitivity (B) specificity (C) positive LR (D) negative LR. LR = likelihood ratio, MRA = magnetic resonance angiography.
3.4.3. AUC value between CTA and MRA
In this study, the AUC index was used to compare the difference of diagnosis value between CTA and MRA for intracranial aneurysm. We found there was no significant difference between the 2 methods (Z = 0.828, P > .05).
4. Discussion
For the detection of intracranial aneurysm, CTA, MRA, and DSA are frequently used medical imaging methods. DSA is widely acknowledged as the gold standard. CTA has essentially replaced DSA to detect intracranial aneurysms in many medical institutions because of the lower cost. Furthermore, MRA is widely used to detect the vascular disease because of its high definition and noninvasive nature.
Although some studies have demonstrated the high sensitivity and specificity of CTA and MRA for intracranial aneurysms, no systematic review has evaluated which is better. This meta-analysis is the first comparative evaluation of the diagnostic performance of CTA and MRA for the detection of intracranial aneurysms. Ten studies met the inclusion criteria. The studies collectively comprised 868 patients evaluated by CTA and 872 patients evaluated by MRA. The inclusion of studies from China, UK, and USA resulted in inevitable language bias. According to the QUADAS-2 checklist, the qualities of the included studies were favorable. Overall, based on several indexes in this meta-analysis, such as sensitivity, specificity, PLR, NLR, DOR, and AUC, CTA and MRA both had a high diagnostic value for intracranial aneurysm.
For diagnosing intracranial aneurysm, CTA had a higher sensitivity (0.84, 95% CI, 0.81–0.86 vs 0.80, 95% CI, 0.77–0.83) and a slight lower specificity (0.85, 95% CI, 0.79–0.89 vs 0.87, 95% CI, 0.82–0.91) than MRA, which suggested that CTA is better able to recognize the true patients with intracranial aneurysm, despite the slightly higher false negative rate. In this study, the AUC of CTA and MRA for diagnosing intracranial aneurysm was 0.90 and 0.87, respectively. This indicates that CTA has a slight higher accuracy than MRA in diagnosis of intracranial aneurysms on the surface, which is consistent with several prior studies.[15,23] A recent systematic review[30] involving 5 retrospective studies and thirteen prospective studies evaluated the diagnostic value of three-dimensional time-of-flight MRA to detect intracranial aneurysm; the sensitivity, specificity, and AUC (0.89, 0.94, and 0.96, respectively) indicated that the technique was an excellent diagnostic method. However, compared the AUC value of CTA with MRA for intracranial aneurysm through Z test, we did not find a statistic difference between the 2 methods (Z = 0.828, P > .05).
The use of CTA or MRA to diagnose intracranial aneurysm has advantages and disadvantages. For instance, El Khalidi[31] carried out 130 patients with nontraumatic acute subarachnoid haemorrhage to assess the usefulness of multislice CTA in identifying cerebral aneurysms compared with intra-arterial DSA; the sensitivity of CTA was similar to DSA, even for intracranial aneurysms < 3 mm in size. For intracranial aneurysms ≥5 mm in size, contrast-enhanced MRA reportedly has a lower diagnostic value than CTA, with CTA recommended as the preferred method for the ≥5 mm intracranial aneurysms.[24] An examination[32] of the turbulent flow within aneurysms revealed different visualizations of the aneurysms with CTA and MRA and the findings indicated that the sensitivity of the 2 methods in diagnosing intracranial aneurysms relies mainly on sub-mm slice thickness for MRA and narrow collimation for CTA, respectively. However, in the present meta-analysis, we could not distinguish the relative performance advantage of CTA and MRA for different size of tumors because of insufficient information in the included studies.
Several limitations should be considered. First and foremost, despite the comprehensive search strategy, with screening of the literature, study selection, extraction of data, and independent assessment of study quality, only 10 articles were included. The limited number of studies might influence the results. Further high-quality studies on a larger scale are needed. Secondly, the exclusion of other than English studies might have led to an inevitable publication bias. Thirdly, because of the limitation of extracted data, we were not able to analyze the value of CTA or MRA for detecting different periods of intracranial aneurysm.
In conclusion, this comprehensive meta-analysis results that CTA and MRA both have the same and high diagnostic value for intracranial aneurysm. However, considering the limitation of sample size, the results should be viewed with caution.
Acknowledgments
XC, YD, and YL designed the study and wrote the manuscript. DM and LX performed the statistical analysis. HT, YL and CY discussed the results.
Author contributions
Conceptualization: Yonghai Dong.
Data curation: Dongyang Ma.
Formal analysis: Dongyang Ma, Lei Xu.
Investigation: Xiaodan Chen.
Methodology: Yonghai Dong.
Project administration: Yonghai Dong.
Supervision: Cheng Yang.
Writing – original draft: Yun Liu, Yonghai Dong.
Writing – review & editing: Xiaodan Chen, Huazhang Tong.
Footnotes
Abbreviations: AUC = area under the curve, CTA = computed tomography angiography, DSA = digital subtraction angiography, DOR = diagnostic odds ratio, FN = false negative, FP = false positive, MRA = magnetic resonance angiography, NLR = negative likelihood ratio, PLR = positive likelihood ratio, QUADAS = Quality Assessment for Diagnostic Accuracy Studies, SROC = summary receiver operating characteristic curves, TN = true negative, TP = true positive.
XC, YL, HT, and YD contributed equally to this manuscript.
Formatting of funding sources: This research did not receive any specific grant from funding agencies in the public, commercial, or not-for-profit sectors.
The authors have no conflicts of interest to disclose.
References
- [1].Thien A, See AA, Ang SY, et al. Prevalence of asymptomatic unruptured intracranial aneurysms in a Southeast Asian population. World Neurosurg 2017;97:326–32. [DOI] [PubMed] [Google Scholar]
- [2].Jeon TY, Jeon P, Kim KH. Prevalence of unruptured intracranial aneurysm on MR angiography. Korean J Radiol 2011;12:547–53. [DOI] [PMC free article] [PubMed] [Google Scholar]
- [3].Juvela S. Prevalence of and risk factors for intracranial aneurysms. Lancet Neurol 2011;10:595–7. [DOI] [PubMed] [Google Scholar]
- [4].Vlak MH, Algra A, Brandenburg R, et al. Prevalence of unruptured intracranial aneurysms, with emphasis on sex, age, comorbidity, country, and time period: a systematic review and meta-analysis. Lancet Neurol 2011;10:626–36. [DOI] [PubMed] [Google Scholar]
- [5].Juvela S, Korja M. Intracranial aneurysm parameters for predicting a future subarachnoid hemorrhage: a long-term follow-up study. Neurosurgery 2017;81:432–40. [DOI] [PubMed] [Google Scholar]
- [6].Farag E, Ebrahim Z, Traul D, et al. Perioperative management of intracranial aneurysm and subarachnoid hemorrhage. Curr Pharm Des 2013;19:5792–808. [DOI] [PubMed] [Google Scholar]
- [7].Wermer MJ, Greebe P, Algra A, et al. Incidence of recurrent subarachnoid hemorrhage after clipping for ruptured intracranial aneurysms. Stroke 2005;36:2394–9. [DOI] [PubMed] [Google Scholar]
- [8].Washington CW, Zipfel GJ, Chicoine MR, et al. Comparing indocyanine green videoangiography to the gold standard of intraoperative digital subtraction angiography used in aneurysm surgery. J Neurosurg 2013;118:420–7. [DOI] [PubMed] [Google Scholar]
- [9].Sun G, Ding J, Lu Y, et al. Comparison of standard- and low-tube voltage 320-detector row volume CT angiography in detection of intracranial aneurysms with digital subtraction angiography as gold standard. Acad Radiol 2012;19:281–8. [DOI] [PubMed] [Google Scholar]
- [10].Attali J, Benaissa A, Soize S, et al. Follow-up of intracranial aneurysms treated by flow diverter: comparison of three-dimensional time-of-flight MR angiography (3D-TOF-MRA) and contrast-enhanced MR angiography (CE-MRA) sequences with digital subtraction angiography as the gold standard. J Neurointerv Surg 2016;8:81–6. [DOI] [PubMed] [Google Scholar]
- [11].Chao A, Major K, Kumar SR, et al. Carbon dioxide digital subtraction angiography-assisted endovascular aortic aneurysm repair in the azotemic patient. J Vasc Surg 2007;45:451–8. 458–460. [DOI] [PubMed] [Google Scholar]
- [12].Scherberich JE, Fischer A, Rautschka E, et al. Nephrotoxicity of high and low osmolar contrast media: case control studies following digital subtraction angiography in potential risk patients. Fortschr Geb Rontgenstrahlen Nuklearmed Erganzungsbd 1989;128:91–4. [PubMed] [Google Scholar]
- [13].Feng TY, Han XF, Lang R, et al. Subtraction CT angiography for the detection of intracranial aneurysms: a meta-analysis. Exp Ther Med 2016;11:1930–6. [DOI] [PMC free article] [PubMed] [Google Scholar]
- [14].van Amerongen MJ, Boogaarts HD, de Vries J, et al. MRA versus DSA for follow-up of coiled intracranial aneurysms: a meta-analysis. AJNR Am J Neuroradiol 2014;35:1655–61. [DOI] [PMC free article] [PubMed] [Google Scholar]
- [15].Xu Z, Lu D, Zhang X, et al. The value of CTA and MRA and DSA in the diagnosis of intracranial aneurysms. JPMI 2017;18:17–20. [Google Scholar]
- [16].Hiratsuka Y, Miki H, Kiriyama I, et al. Diagnosis of unruptured intracranial aneurysms: 3T MR angiography versus 64-channel multi-detector row CT angiography. Magn Reson Med Sci 2008;7:169–78. [DOI] [PubMed] [Google Scholar]
- [17].Whiting PF, Rutjes AW, Westwood ME, et al. QUADAS-2: a revised tool for the quality assessment of diagnostic accuracy studies. Ann Intern Med 2011;155:529–36. [DOI] [PubMed] [Google Scholar]
- [18].Higgins JP, Thompson SG, Deeks JJ, et al. Measuring inconsistency in meta-analyses. BMJ 2003;327:557–60. [DOI] [PMC free article] [PubMed] [Google Scholar]
- [19].Vamvakas EC. Meta-analyses of studies of the diagnostic accuracy of laboratory tests: a review of the concepts and methods. Arch Pathol Lab Med 1998;122:675–86. [PubMed] [Google Scholar]
- [20].Moreno GG, Pantoja CT. Systematic reviews of studies of diagnostic test accuracy. Rev Med Chil 2009;137:303–7. [PubMed] [Google Scholar]
- [21].Deeks JJ, Macaskill P, Irwig L. The performance of tests of publication bias and other sample size effects in systematic reviews of diagnostic test accuracy was assessed. J Clin Epidemiol 2005;58:882–93. [DOI] [PubMed] [Google Scholar]
- [22].Zhao D, Li Z, Qiao H, et al. Value of DE-CTA and MRA and DSA in the diagnosis of intracranial aneurysms. Chin J of Clinical Rational Drug Use 2015;8:152–3. [Google Scholar]
- [23].Li W, Luo X, Li J, et al. The technology comparison of 64 slice spiral CTA and 3D-TOF-MRA & inspection effect on intracranial aneurysms. J Haninan Med Coll 2009;15:334–7. [Google Scholar]
- [24].Tang L, Xia L, Liu S, et al. Diagnostic value analysis of CTA and MRA for 5mm and over aneurysms. China Foreign Med Treat 2013;32:166–7. [Google Scholar]
- [25].Chen S, Zhang B, Ye M, et al. Evaluation of CTA and MRA in diagnosis of intracranial aneurysms. Acta Acad Med Weifang 2016;38:87–9. [Google Scholar]
- [26].Cui X, Song Z, Yu J, et al. Comparison of CTA and MRA in diagnosis of aneurysms and aneurysm rupture risk assessment. Med J Chin PAP 2016;27:1214–7. [Google Scholar]
- [27].White PM, Teadsale E, Wardlaw JM, et al. What is the most sensitive non-invasive imaging strategy for the diagnosis of intracranial aneurysms? J Neurol Neurosurg Psychiatry 2001;71:322–8. [DOI] [PMC free article] [PubMed] [Google Scholar]
- [28].White PM, Wardlaw JM, Lindsay KW, et al. The non-invasive detection of intracranial aneurysms: are neuroradiologists any better than other observers? Eur Radiol 2003;13:389–96. [DOI] [PubMed] [Google Scholar]
- [29].White PM, Teasdale EM, Wardlaw JM, et al. Intracranial aneurysms: CT angiography and MR angiography for detection prospective blinded comparison in a large patient cohort. Radiology 2001;219:739–49. [DOI] [PubMed] [Google Scholar]
- [30].HaiFeng L, YongSheng X, YangQin X, et al. Diagnostic value of 3D time-of-flight magnetic resonance angiography for detecting intracranial aneurysm: a meta-analysis. Neuroradiology 2017;59:1083–92. [DOI] [PubMed] [Google Scholar]
- [31].El Khalidi M, Pernter P, Ferro F, et al. Detection of cerebral aneurysms in nontraumatic subarachnoid haemorrhage: role of multislice CT angiography in 130 consecutive patients. Radiol Med 2007;112:123–37. [DOI] [PubMed] [Google Scholar]
- [32].Kouskouras C, Charitanti A, Giavroglou C, et al. Intracranial aneurysms: evaluation using CTA and MRA. Correlation with DSA and intraoperative findings. Neuroradiology 2004;46:842–50. [DOI] [PubMed] [Google Scholar]