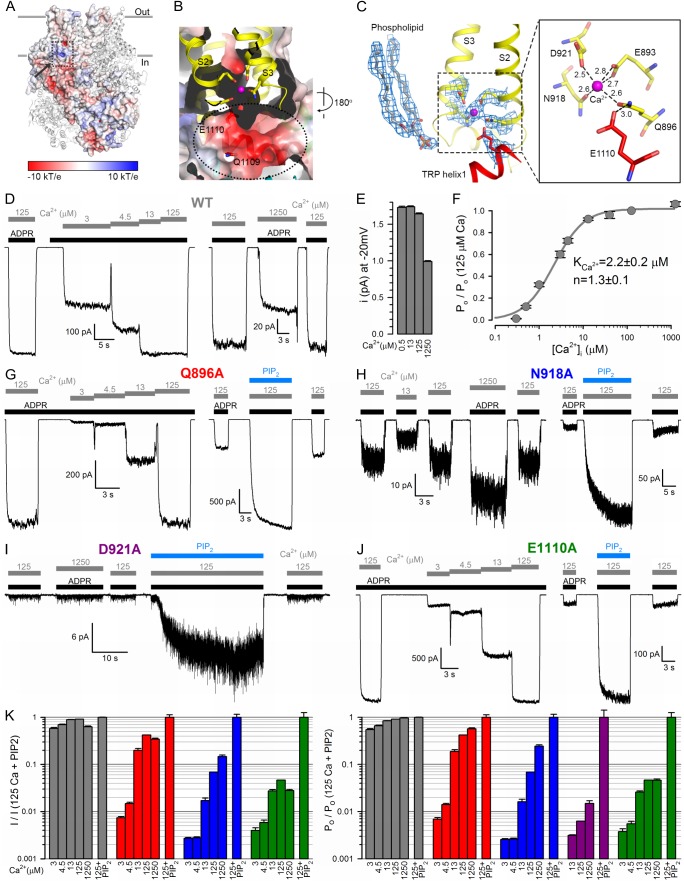
Figure 4. The nvTRPM2 Ca2+binding site.
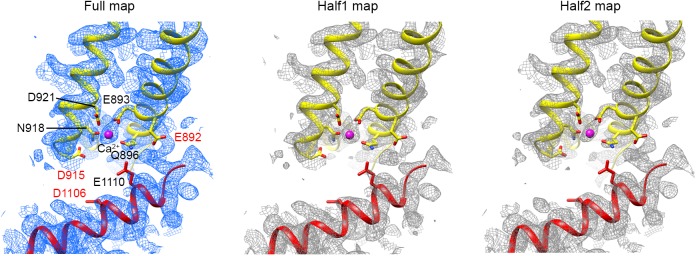
(A) The Ca2+ binding site is located close to the inner leaflet of the membrane. One subunit is represented as electrostatic surface, the remaining three are shown as ribbon. The position of the Ca2+ binding site (hidden behind surface) is indicated with a dashed box and the vestibule of the peripheral tunnel is marked with an arrow. (B) A cross section of the Ca2+ binding site. Ca2+ is shown as a magenta sphere. Side chains of residues from S2 and S3 involved in Ca2+ coordination, as well as nearby side chains of residues in TRP helix 1, are shown as sticks. The peripheral tunnel located between the transmembrane and the TRP domain is indicated with a dashed ellipse. (C) Local EM densities and geometry of the Ca2+ binding site. The nearby phospholipid with a poorly resolved head group was modeled as a phosphatidic acid. (D, G–J) Macroscopic inward Na+ currents through WT (D), Q896A (G), N918A (H), D921A (I), and E1110A (J) nvTRPM2, evoked by cytosolic exposures to 100 μM ADPR (black bars) and various concentrations (in μM) of free Ca2+ (gray bars), with or without 25 μM dioctanoyl-PIP2 (blue bars). Extracellular (pipette) [Ca2+] was ~1 nM, membrane potential was −20 mV. (E) Absolute values of WT nvTRPM2 unitary current amplitudes (mean ± SEM) under conditions similar to those in panel D: at −20 mV membrane potential in the presence of symmetrical 144 mM Na+, but various cytosolic [Ca2+] (in μM). (F) Dependence on cytosolic [Ca2+] of nvTRPM2 open probability (Po; mean ±SEM), normalized to that in 125 μM Ca2+ (Po;125), calculated as Po/Po;125=(I/I125)/(i/i125) (I, macroscopic current; i, unitary current). Gray curve is a fit to the Hill equation with parameters plotted. (K) Dependence on cytosolic [Ca2+] of macroscopic current (left; mean ± SEM) and of channel open probability (right; mean ± SEM), normalized to the values observed in the presence of 125 μM Ca2+ + 25 μM dioctanoyl-PIP2 (see Materials and Methods), for WT (gray), Q896A (red), N918A (blue), D921A (purple), and E1110A (green) nvTRPM2. Fractional Po was calculated as in (F), except for D921A for which it was estimated using dwell-time analysis (see Materials and methods) as currents in the absence of PIP2 were too small for reliable cursor measurement. See also Figure 4—figure supplement 1.


