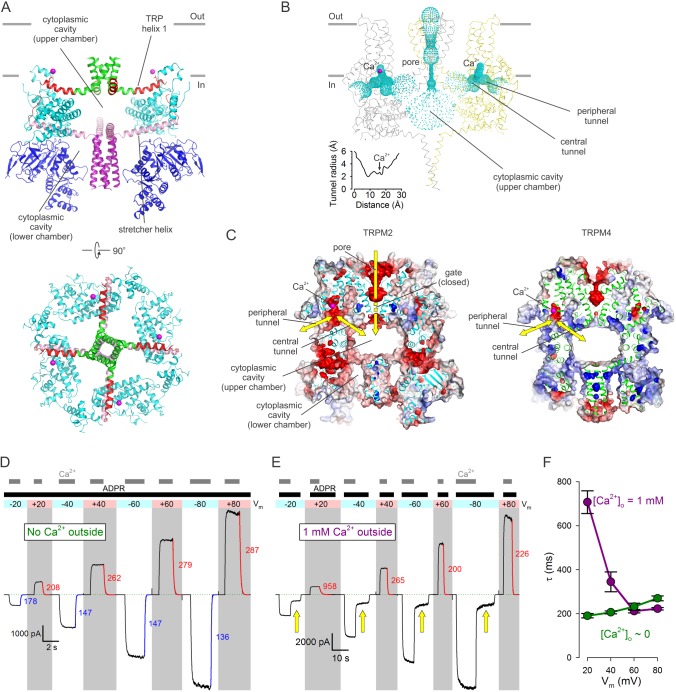
Figure 5. Cytoplasmic cavities and tunnels.
(A) Architecture of the cytoplasmic cavity viewed from an angle parallel (top) or perpendicular (bottom) to the membrane plane. The NTD (blue), the LHD (cyan), the cytoplasmic ends of transmembrane helix S6 (green), TRP helix 1 and the TRP loop (red), the stretcher helix (pink), and the CC (purple) are shown as cartoon, Ca2+ ions as magenta spheres, and the E1110 side chain as sticks. In the top panel two diagonally opposing subunits are shown, in the bottom panel the NTD is removed for clarity. (B) Ribbon representation of the top and middle tiers and the CC helices, front and rear subunits omitted for clarity. Dotted mesh represents the contiguous surface that lines the pore, the upper chamber, the central and peripheral tunnels, and the Ca2+ binding sites. Inset plots the van der Waals radius of the tunnel along its central axis. (C) Longitudinal cross sections through nvTRPM2 (left) and hTRPM4 (right; PDBID:6BQV), showing connectivities and surface electrostatics for the upper chamber, a central and peripheral tunnel, and the corresponding Ca2+ binding site. Yellow arrows highlight possible pathways for Ca2+ flux. (D–E) Macroscopic nvTRPM2 currents evoked at various membrane potentials (colored bars and shading) by cytosolic exposures to 100 μM ADPR +125 μM Ca2+, in the presence of either ~1 nM (D) or 1 mM (E) free Ca2+ in the extracellular (pipette) solution. Colored curves are single exponentials fitted to the current decay time courses that follow cytosolic Ca2+ removal, colored numbers are time constants (in ms). Green dotted line marks zero-current level. Yellow arrows in (E) highlight current fractions that survive removal of cytosolic Ca2+. (F) Voltage dependence of closing time constants (mean ± SEM) upon cytosolic Ca2+ removal, in the presence (purple symbols) or absence (green symbols) of extracellular Ca2+.

