

Abstract
Regenerative medicine and tissue engineering studies are actively developing novel means to repair adult articular cartilage defects using biological approaches. One such approach is the harnessing of adult human therapeutic cells such as those referred to as mesenchymal stem cells. Upon exposure to chondrogenic signals, these cells differentiate and initiate the production of a complex and voluminous cartilaginous matrix that is crucial to both the structure and function of cartilage. Furthermore, this complexity requires the time-sensitive activation of a large number of genes to produce the components of this matrix. The current study analyzed the kinetics of matrix production in an aggregate culture model where adult human mesenchymal stem cells were induced to differentiate as chondrocytes. The results indicate the existence of a biphasic mode of differentiation and maturation during which matrix genes and molecules are differentially activated and secreted. These results have important implications for developing novel approaches for the creation of tissue engineered articular cartilage.
Keywords: Mesenchymal stem cells, cartilage, extracellular matrix, microarray, proteoglycan, tissue engineering
Introduction
Cartilage is a unique tissue in which a relatively small population of cells produce an elaborate and extensive extracellular matrix (ECM)1,2. The development and maturation of this tissue on long bones occurs in multiple stages where cell-cell and cell-matrix interactions combine to regulate elongation of these bones, a process that culminates in the formation of articular surfaces at the ends of these bones1. This articulation is critical for joint movement and depends upon a unique cellular population and a site-specific, functional ECM3. The extensive matrix that surrounds chondrocytes consists of two essential components, proteoglycans (PGs) and collagens2,4. Additional components regulate the assembly of collagenous fibers and provide physical connections between these fibers and highly sulfated PGs2. In combination, these two sets of matrix components provide for the strength and compressive functions that are characteristic of this tissue4. Replacement of this ECM is a current goal of regenerative medicine.
The ECM plays a central role in the development of most tissues, no more so than for cartilage5. The initiation of cartilage development in vivo requires mesenchymal cells to form intimate cell-cell contacts and to respond to inductive agents such as transforming factor-beta (TGFβ)1,5. One of the earliest events during this process is the induction of fibronectin secretion by TGFβ5,6. Fibronectin interacts with neural cell adhesion molecule to initiate early chondrogenic events5. This accompanies the production of an early matrix that is non-cartilaginous in that type I collagen and versican are major components of the ECM. It is not until later that the classical markers of cartilage matrix, type II collagen and aggrecan, appear7. These studies provide a platform to better understand dynamics and control issues in in vitro cartilage matrix development.
Towards this goal, adult human mesenchymal stem cells (hMSCs) were induced to differentiate as chondrocytes by following a pathway that is similar that for in vivo chondrogenesis. Condensation of hMSCs can be achieved in a variety of methods, including gentle centrifugation and induction by exposing cells to TGFβ18-11. Additional enhancement of hMSC differentiation resulted from the addition of fibroblast growth factor-2 (FGF-2) to culture medium used for hMSC expansion11. Chondrogenesis for aggregate cultures was evident by day 3. Chondrogenic events included significant changes in the production and release of ECM molecules and changes in sulfation patterns of PGs. The chondrogenic process was monitored by establishing a time line for the secretion of ECM molecules in such aggregate cultures7. Cultured cells secrete matrix molecules, but only a portion of these molecules become entrapped in an insoluble matrix. Most of these secreted molecules, particularly at early stages, are released into conditioned medium as soluble molecules12,13. This affords the opportunity to apply proteomic methods to follow differentiation events in a non-invasive manner. However, it is first necessary to establish a time line of matrix molecule production by aggregate cultures. This was accomplished through the use of microarray assays to assess mRNA levels for essential matrix molecules. A proof of concept is included where sulfation pattern for chondroitin and keratan sulfate chains were shown to be expressed both in aggregate culture and in conditioned medium.
Materials and Methods
Human Bone Marrow Derived Mesenchymal Stem Cells
Adult human iliac crest aspirates from two healthy adult volunteer donors were collected using a procedure reviewed and approved by the University Hospitals of Cleveland Institutional Review Board. Samples were prepared for culture and placed onto tissue culture plastic as previously described14. Plated cells were expanded using Dulbecco’s Modified Eagle’s Medium with low glucose (DMEM-lg) that was supplemented at a 10% level with a selected batch of fetal bovine serum (FBS) and further supplemented with 10 ng/ml basic fibroblast growth factor-2 (FGF-2)15.
Chondrogenic Differentiation
The hMSCs at first passage were transferred to chondrogenic differentiation medium which consisted of DMEM-high glucose that was supplemented with 1% Insulin-Transferrin-Sodium Selenite medium supplement (BD Bioscience, San Jose, CA), 10−7 M dexamethasone, 1 mM sodium pyruvate, 120 mM ascorbate 2-phosphate, 100 mM non-essential amino acids (all from GIBCO, Waltham, MA), and 10 ng/ml TGFβ1 (Peprotech, Rocky Hill, NJ)10,11,15. Aggregates were created by placing 250,000 cells into conical wells of a non-adhesive 96-well plastic plate and centrifuging the plate at low speed. The expansion medium was replaced with differentiation medium and aggregates were harvested for RNA extractions at the following time points: days 3, 7, 10, 14, 21, and 28. Cultured monolayer hMSCs, before chondrogenic induction (day 0 samples), were included in the analyses.
RNA Extraction
Harvested aggregates were homogenized using RNase-free disposable Aggregate-Pestles (Kimble-Chase, Vineland, NJ) and the extracts were digested on-column with DNase-1 and were then purified using RNeasy mini kit (Quiagen, Hilden, Germany). The RNA concentrations in each sample were determined using a Nanodrop 2000 spectrophotometer (ThermoFisher, Waltham, MA).
Microarrary Analyses16
Whole-genome expressional analyses were carried out using Human Ref-8v3 or Human HT-12 v4 BeadArrays (Illumina, San Diego, CA). Total RNA was linearly amplified with biotin incorporation using Illumina TotalPrep kits (Life Technologies, Carlsbad, CA). The quality of the cRNA was assayed using an Agilent 2100 bioanalyzer (Santa Clara, CA). The resulting cRNA was hybrized to Illumina BeadChips (San Diego, CA), processed and read using a BeadStation array reader (Illumina, San Diego, CA) according to the manufacturer’s instructions. Numerical values of relative fluorescence units (RFU) were determined for indicated genes. Values less than 180 units were considered to be background signals. The RFU values for the two donors were averaged and these values were used to determine fold changes with respect to day 0 hMSCs. Table 1A-C and supplemental Tables present fold difference at the respective time points.
Table 1A.
Matrix Proteoglycans and Related Molecules; mRNA Expression (fold change compared to day 0)
| Large PGs | Day 01 | Day 3 | Day14 |
|---|---|---|---|
| ACAN | ND2 | ND | 1.6 |
| VCAN | 1.03 | 1.0 | 0.7 |
| HAPLN1 | 1.0 | 1.7 | 32.6 |
| Small PGs; CS/DS | |||
| DCN | 1.0 | 2.6 | 1.7 |
| BGN | 1.0 | 1.7 | 1.1 |
| EPYC | ND | 1.2 | 17.8 |
| PRG4 | ND | 20.0 | ND |
| Small PGs; KS | |||
| LUM | 1.0 | 1.6 | 2.2 |
| FMOD | 1.0 | 10.5 | 14.1 |
| PRELP | ND | 2.2 | 2.9 |
| Cell Surface PGs | |||
| GPC6 | 1.0 | 1.1 | 0.4 |
| SDC2 | 1.0 | 0.9 | 2.5 |
| SDC4 | 1.0 | 2.3 | 1.4 |
| CSPG4 | ND | 2.1 | 2.9 |
hMSC non-differentiated cultures;
not detected means RFU values were 180 or below; however, all RFU values were above 0 and that number was used to determine fold changes for aggregate cultures.
RFU at day 0 are set to 1 for comparison when these values were greater than 180. N=2 for all values. Based upon microarray data16.
Table 1C.
Matrix Molecules and Collagens
| Gene | Day 01 | Day 3 | Day14 |
|---|---|---|---|
| DPT | ND2 | 13.0 | 55.0 |
| COMP | 1.03 | 7.4 | 26.6 |
| SERPINH1 | 1.0 | 0.8 | 1.4 |
| TNC | 1.0 | 1.4 | 1.1 |
| FN1,3 | 1.0 | 3.6 | 1.6 |
| FN1,6 | 1.0 | 3.5 | 1.6 |
| FN1,7 | 1.0 | 6.0 | 2.0 |
| COL1A1 | 1.0 | 0.4 | 2.0 |
| COL1A2 | 1.0 | 1.2 | 1.4 |
| COL2A1 | ND | ND | 90.8 |
| COL3A1 | 1.0 | 1.6 | 1.5 |
| COL6A1 | 1.0 | 1.5 | 0.3 |
| COL6A2 | 1.0 | 2.1 | 0.3 |
| COL6A3 | 1.0 | 1.6 | 0.5 |
| COL9A1 | ND | ND | 15.7 |
| COL9A2 | ND | ND | 20.2 |
| COL9A3 | ND | ND | 3.5 |
| COL10A1 | 1.0 | 1.2 | 25.3 |
| COL11A1 | 1.0 | 1.5 | 9.1 |
| COL11A2 | ND | ND | 7.2 |
| COL12A1 | 1.0 | 0.6 | 1.6 |
Based upon microarray data16.
hMSC non-differentiated cultures;
not detected means RFU values were 180 or below; however, all RFU values were above 0 and that number was used to determine fold changes for aggregate cultures.
RFU at day 0 are set to 1 for comparison when these values were greater than 180. N=2
Histological Preparation and Analyses
Chondrogenic aggregates were prepared as described above. Aggregates and conditioned medium were harvested at indicated time points (days 3, 5, 7, 10, 21). Aggregates were fixed in neutral buffered 3% formalin overnight, washed in phosphate buffered saline, and embedded in paraffin. Sections of aggregates were mounted on slides, deparaffinized, and hydrated for histochemical (toluidine blue) and immunohistochemical assays using monoclonal antibodies specific for CS and KS17,18. The antibodies used for these studies recognize carbohydrate epitopes that are stable using the indicated preparation procedures. The monoclonal antibodies used for the study were obtained from hybridoma supernatants. Hybridoma cells were cultured in RMPI 1640 medium that was supplemented with gentamicin and 15% FBS that was selected for hybridoma growth. Hybridoma medium was applied neat for 1 hr. The samples were washed and second antibody, goat anti-mouse IgG, IgA, and IgM conjugated with FITC (Chemicon, now MilliporeSigma, Temecula, CA) was applied for 1 hr. Toluidine staining was performed as previous described11,15. Photographs were taken using a Leica DML Microscope (Wetzlar, Germany) using SPOT Image Capture System (Diagnostic Instruments, Sterling Heights, MI) and saved in the TIFF format as RBG-images. Contrast/brightness was modified using Adobe Photoshop. Composite images were prepared using Adobe Illustrator.
Fluorescence-Activated Cell Sorting
Cultures of hMSC were grown to subconfluence in medium supplemented with FGF-2. The cells were detached using 0.25% trypsin-0.20% EDTA (Sigma/Aldrich, ST Louis, MO) and were washed 3x with Tyrode’s solution. These cells were allowed to sit at 25° C for 1 hour before being fixed with 3% formalin in Tyrode’s solution. The cells were washed 3x with Tyrode’s solution before being counted and divided into aliquots for immunostaining. Primary antibody hybridoma medium (see below) (4C317, 7D417, 6C317, PG-418, CD7319) was added to samples for a 1 hour incubation at 37° C. These samples were washed 3× with Tyrode’s solution and were incubated with secondary anti-mouse IgG/IgM diluted 1/1000 in Tyrode’s solution. These samples were incubated at 37° C in the dark for 1 hour, washed 3x with Tyrode’s solution. An aliquot of each sample was taken for visualization as a suspension culture. The remainder of the sample was assayed using BD Accuri® C6 digital basic flow cytometer equipped with a BD CSampler (BD Biosciences, San Jose, CA). The sample incubated with the 4C3 antibody was used as a negative control for gating. Each run assayed 10,000,000 counts.
Enzyme-Linked-Immunoabsorbance Assay Preparation and Analyses
EIA-plates with 96-wells (Corning Costar, Corning NY) were used for the study. PGs were adsorbed to well by placing 50 μl of conditioned medium into well in triplicate18. Medium that was not used for culture served as the control. The plates were incubated at 4° C overnight, washed 3x with phosphate buffered saline (PBS) to remove unbound materials and each well was blocked with 100 μl of a solution consisting of 1% bovine serum albumin in PBS for 1-2 hours at 25° C. The wells were washed 6× with PBS and 50 μl of primary antibody, neat hybridoma medium, was added to each well. The plates were incubated 2 hr at 37° C and washed 6x to remove unbound antibody. The plates were washed 6x with PBS and secondary antibody, goat anti-mouse Ig conjugated with alkaline phosphatase, was add 50 μl to each well and incubated 2 hours at 37° C. The plates were washed 6x and alkaline phosphate substrate, 100 μl was added to each well. The plates were incubated at 25° C to develop color. The plates were read on a GENios PRO multiplate-reader (Tecan, Durham, NC) using 405 nm absorbance. All readings represent average values from three wells. Purified embryonic chick aggrecan20 was used as a standard for the PG assay.
Safranin-O Assay
The safranin-O assay was performed as previously described15,20. Briefly, glycosaminoglycans (GAGs) were extracted from aggregates, mixed with the Safranin-O dye, and the bound dye was collected by filtration. The dye was eluted from the filter and the amount was determined calorimetrically. Purified chick aggrecan was used as a standard.
Results
Differentiation Stage, Day 3
Compact chondrogenic aggregates are not metachromatic on day 3, but this situation changes by day 7 (Fig 1). Actually, changes in GAGs have occurred by day 3; however, their detection requires more sensitive immunohistochemical staining for visualization (Fig 2); both CS and KS are present. KS, which is not expressed by hMSCs is now present (not shown). The antibodies employed in this study17,18 do not identify specific PGs; however, microarray data (Table 1A) provides an indication of which CS and KS PGs are likely being produced during the initial transition period. Messages for small CS and KS PGs, such as decorin and fibromodulin, are expressed at the early time points as is the message for versican. Matrix molecules other than PGs are also being produced in the early stages of differentiation (Table 1B). These include: fibronectin, dermatopontin, cartilage oligomeric protein, type I collagen, type VI collagen, and tenascin-c. In contrast, signature molecules for cartilage1,2, type II collagen and aggrecan are not actively expressed initially upon differentiation.
Figure 1. Chondrogenic Aggregates, Day 3 and Day 7.

Aggregate cultures established from the same batch of hMSCs were harvested on days 3 and 7 for sectioning and histological staining with toluidine blue. On day 3, aggregates are cellular with no evidence of metachromatic staining. By day 7, a metachromatic matrix is developing. Bars = 500 μm.
Figure 2. CS/KS in day 3 aggregates.

Aggregate sections from the same set as in Fig 1 were immunostained using 6 antibodies that detect different sulfation motifs in chondroitin sulfate (4C3, 7D4, 6C3, PG4) and keratan sulfate (3D2, 8C2). All motifs are represented in these aggregates. Chondroitin sulfate antibodies 6C3 and PG4 detect early extracellular matrix (6C3 inset). Bars = 800 μm.
Table 1B.
Sulfation-Related Molecules; mRNA Expression
| Gene | Day 01 | Day 3 | Day14 |
|---|---|---|---|
| PAPSS2 | 1.03 | 3.5 | 6.9 |
| SLC26A2 | 1.0 | ND | 2.5 |
| CHST3 | 1.0 | 0.7 | 2.0 |
| CHST6 | ND2 | ND | 2.4 |
| CHST7 | 1.0 | 2.2 | 1.3 |
| CHST14 | 1.0 | ND | 0.95 |
| CHST15 | 1.0 | 1.0 | 1.7 |
Based upon microarray data16.
hMSC non-differentiated cultures;
not detected means RFU values were 180 or below; however, all RFU values were above 0 and that number was used to determine fold changes for aggregate cultures.
RFU at day 0 are set to 1 for comparison when these values were greater than 180.N=2
PGs are not restricted to the ECM, but also reside on cell surfaces21. This raises the issue of whether initial differentiation of hMSCs (day 0 cells) affects cell surface PGs. The cell surface expression of CS is limited on hMSCs (Fig 3). Some CS antibodies such as 4C3 and 7D4 (not shown) do not detect surface PGs while others such as PG4 and 6C3 (not shown) detect surface PGs on only a limited subset of cells. The CD73 antibody19 was employed as a positive control as it recognizes most hMSCs. This situation is radically changes upon chondrogenic differentiation of hMSCs (Fig 2). Now, PGs associated with chondrogenic cells express both the 4C3 and 7D4 epitopes that were not expressed by hMSCs (Fig 4). Further, the PG4 and 6C3 epitopes are now expressed by a high percentage of cells (Fig 2). The genes for two cell surface PGs, syndecan 4 and CS PG 4 are upregulated on day 3 (Table 1A), both express CS chains.
Figure 3. CS on hMSC (day 0) Surfaces.

Most hMSCs express CD73 on their surfaces as is demonstrated by visualization of suspension cultures and by FACS analysis. CS as detected by antibody 4C3 is not detected on surfaces of the same population of cells. However, CS as detected by the PG-4 antibody is detected upon a subset of cells. FACS analyses indicates that approximately 10% of these cells express CS as detected by the PG-4 antibody. The 4C3 was used for gating purposed in the FACS analyses. Bars = 200 μm.
Figure 4. CS on Day 3 Cell Surfaces.

In contrast to hMSCs, antibodies 4C3 and 7D4 detect cell surface antigen on cells of day 3 aggregate cultures. Bars = 75 μm.
KS is another GAG whose expression is regulated by chondrogenic differentiation22-25. This GAG is not expressed by hMSCs even though core proteins such as fibromodulin and lumican are expressed by these cells (Table 1A). However, upon differentiation the mRNA for these genes and for PRELP, another KSPG are upregulated. Also upregulated on day 3 are genes that code for the glycosyltransferases that create the backbone of KS chains22. The beta-1,4-galactosyltransferase 1 (B4GALT1) gene and the beta-1,4-galactosyltransferase 4 (B4GALT4) gene22 are upregulated 1.8 and 3.2 fold, respectively. In addition, antibodies that specifically identify KS17 detect antigens in day 3 aggregate cultures (Fig 2). Thus, KS expression is an early marker for chondrogenic differentiation.
Sulfate Metabolism
Enhanced PG synthesis that is initiated during differentiation requires increased levels of sulfate for GAG production26,27. This sulfate upon entering the cell must be transported to the Golgi where GAG synthesis occurs. One of the earliest genes to be upregulated by TGFβ is phosphoadenosine 5′-phosphosulfate synthase 2 (PAPPS 2) that codes for a sulfate chaperone molecule that transports sulfate to the Golgi apparatus28 (Tables 1A, 1B, 1C). This gene is further upregulated on day 14 when PG production is further upregulated. Other genes that are upregulated are SLC26A2, a gene that codes for a membrane sulfate transporter26 and CHST genes that regulate the sulfation of CS and KS chains29.
Conditioned Medium Assays
Day 3 aggregate cultures appear to contain low levels of sulfated GAGs based upon toluidine blue staining (Fig 1); however, both microarray and immunohistochemical data challenge this interpretation. A partial reason for the apparent low levels of aggregate metachromasia is that substantial sulfated PGs are being released into the conditioned medium (Fig 5A). ELISA analyses of this CM confirms that these are both CS and KS PGs (Fig 5B). This is consistent with the microarray data presented above.
Figure 5. Proteoglycans in aggregate cultures and aggregate conditioned media.

A. The safranin-O assay20 for sulfated GAGs was applied to extracts of aggregate cultures at the indicated stages and upon conditioned media that was harvested from these cultures at the same intervals. B. Assays were performed to assess the amounts of chondroitin and keratan sulfate proteoglycans in aggregate culture conditioned media. Antibodies PG4 and 6C3 were used to detect chondroitin sulfate and the antibody 8C2 was used to detect keratan sulfate. Embryonic chick aggrecan was used as a standard. These results represent a single sample, N=1.
Maturation Phase, Day 14
The maturation period is where there is substantial upregulation for multiple ECM genes occurs (Tables 1A and 1C). During normal cartilage development multiple matrix compartments emerge which are characterized by the presence of different sets of PGs1,2 (Fig 6). Immunohistochemical staining of aggregate cultures for CS and KS also reveals the appearance of distinct compartments (Fig 7). Antibody 6C317 sees a sulfation motif that appears to be common to all compartments. In contrast, antibody PG-418 selectively detects a CS motif that is highly expressed in the pericellular matrix that surrounds chondrocytes and is also found in the territorial matrix. The 7D417 antibody is more restrictive in that is sees motifs that are associated with chondrocytes and which are found in the territorial matrix. This patterning of CS motifs is an indication that modifications in gene expression that occur during the maturation phase are creating a cartilage-like matrix (Table 1A).
Figure 6. Hyaline cartilage structure.

Hyaline cartilage contains four discrete regions: the chondrocyte, the pericellular matrix, the territorial matrix, and the interterritorial matrix. Each of these regions contains different sets of proteoglycans that are indicated for each compartment1,2.
Figure 7. CS in Day 21 Aggregate Cultures.
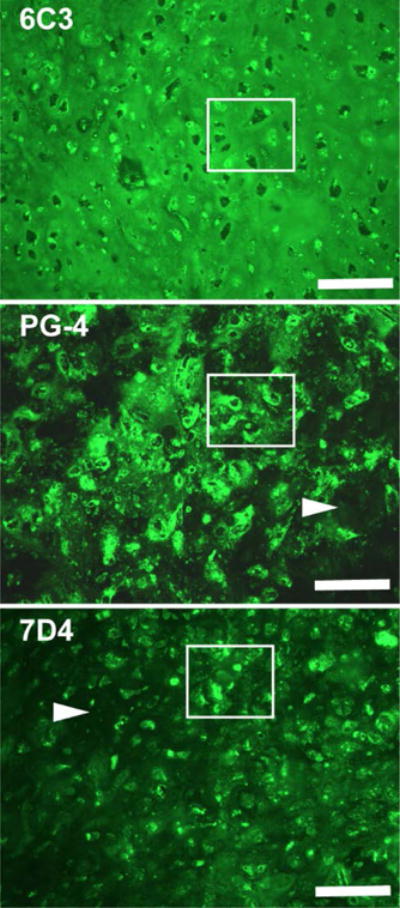
Sections from the same aggregate culture were immunostained using three different antibodies that detect three different CS sulfation motifs17,18. 6C3) This antibody detects CS more or less equally in all compartments of cartilage matrix. Marked region shows examples of cells, pericellular matrices, territorial and interterritorial regions that are positively immunostained. PG-4) The marked region shows that this antibody recognizes a sulfation motif that is highly concentrated in the pericellular region and to a lesser extent is present in the territorial matrix. The arrow indicate low expression in the interterritorial matrix. 7D4) The marker region highlights the detection by this antibody of cells and to a lesser extent the territorial matrices that surround these cells. The arrow further indicates the low expression of this sulfation motif in the interterritorial matrix. Bars = 250 μm.
Sulfate metabolism is critical for the production of PG chains and a significant upregulation of sulfation genes are a component of aggregate maturation (Tables 1A and 1B). The PAPSS2 gene that was upregulated on day 3 is further upregulated on day 14. Also upregulated is the solute carrier family 26 member 2 (SLC26A2) gene that codes for a membrane sulfate transporter29-33. These events indicate that more sulfate can enter the cell during this period, a feature that is necessary to accommodate the increased production of PGs. Sulfation of CS and KS chains occurs in the Golgi apparatus where it is mediated by CHST genes4,31. Multiple CHST genes are upregulated on day 14.
Collagens
Collagens, both fibrillar and non-fibrillar varieties, are a major and critical component of cartilage matrices34,35, and they are accompanied by numerous ancillary molecules that regulate fibrillogenesis and matrix organization36,37. Type I and type II collagens that are critical for cartilage matrices1,2 are both produced in aggregates, but with substantially different mRNA profiles (Table 1C). Type I collagen mRNAs appear early and are further upregulated upon maturation of the matrix. In contrast, type II collagen mRNAs are highly expressed only upon maturation of the matrix. The genes for COMP and non-fibrillar accessory type IX collagens, COL9A1, COL9A2, and COL9A3 are likewise upregulated34. Dermatopontin (DPT), a molecule that plays a role in the initiation of collagen fibrillogenesis is also highly upregulated34.
Type X collagen gene activity is also upregulated. In normal development of long bones, type X collagen expression is primarily confined to hypertrophic chondrocytes at the base of the growth plate2. However, in aggregate cultures the expression of this molecule co-exists with other collagens.
Discussion
The complex and voluminous ECM of cartilage imparts unique functions to this tissue which makes it important to understanding how this matrix matures in culture. Kinetic analyses of this developmental process have been performed in this study and in other studies7,38. However, it is equally essential to develop a better understanding when and how the actual matrix molecules are being produced and are being integrated into the new evolving matrix. In the current study, microarray data analyses16 have been used to monitor mRNA expression profiles for multiple matrix molecules. These same data have also been employed in a recent study that compared mRNA activity of cultured aggregates with that for mRNA activity in human neonatal cartilage16. Significant differences were observed, an indication that much more work is required to create an effective tissue engineered cartilage. Another recent study from this laboratory has provided additional confirmatory data. In this study, the mRNA profiles for SOX9 and ACAN was assayed by inserting lentiviral reporters into hMSCs and then using these cells for aggregate culture39. Live cultures at various time points were assayed for luciferase expression. This resulted in patterns of expression that closely corresponded with the microarray data.
The value of the microarray data is that it affords the opportunity to simultaneously evaluate mRNA expression kinetics for multiple classes of matrix molecules as is presented in the Graphic Abstract. These data can then be analyzed in concert with existing in vivo and in vitro data. It is clear that the initial matrix that is produced in this model is more like that of non-cartilaginous tissues in that principal components consist of type I collagen and versican. Fibronectin, a ubiquitous matrix molecule, also plays a role in the early chondrogenic differentiation process6. In addition, sulfation, as indicated by the early upregulation of the PAPSS2 gene emphasizes the importance of this process4. These early differentiation events lead to a more mature cartilage matrix in this model. Maturation results in the appearance of novel PGs such as epiphycan which is characteristic of articular cartilage40. Thus, substantial changes in matrix molecular production during the maturation phase.
Chondrogenic differentiation in aggregate culture requires the exposure of cells to an agent such as TGF-β10,11,16. Previous studies28,41 have shown that two genes that are rapidly upregulated by TGFβ are PAPSS2 and PRG4. The current data indicates that these two genes are also upregulated by day 3 of culture. The PAPSS2 gene codes for a sulfate chaperone molecule that transports sulfate to the Golgi26,41. Upon entering the Golgi, sulfate is attached to GAG chains. The upregulation of the PAPSS2 gene signifies a modification of sulfate metabolism within newly differentiated chondrocytes, and a further upregulation coincides with the start of the maturation phase. Consequences of this change are detected by monoclonal antibodies that detect cell surface and matrix alterations that occur both upon differentiation and later during the maturation period. Mutation of the PAPSS2 gene result in severe chondrodysplasia in both humans and mice that results from the undersulfation of CS chains4,42. The PRG4 gene codes for the PG core protein termed lubricin30. Lubricin is produced by synovial cells in mature joints. In aggregate cultures, it appears to be produced by cells that have fibroblast-like phenotype, possibly a transitional cell43. In the current cultures, lubricin is transiently produced and does not appear to play a significant role in aggregate development. The modification of sulfation motifs as observed in the current study have been shown to be critical for manner in which cells see and respond to their environment. Stem cells upon differentiation modify sulfation motifs differently to match the direction of their differentiation44.
Archer and co-workers identified a subpopulation of cells in the resting zone of articular cartilage that upon isolation exhibit chondrogenic stem cell characteristics45. Caterson’s group further characterized these cells as expressing the sulfation motifs for 3B3-minus, 4C3, and 7D4 antibodies46. These motifs are not expressed on hMSCs, but upon chondrogenic differentiation of these cells they become expressed. This does not necessarily identify these cells as stem cells, but it does indicate a significant modification in sulfate pattern that is induced by differentiation. Two cell surface core protein genes were upregulated upon differentiation, SDC4 and CSPG447. It is not currently clear to what extent this has upon sulfation motifs. Another factor is the expression of sulfotransferases, enzymes that mediate the attachment of sulfate to GAG chains4,28,31. A family of these enzymes, the CHST family, mediates the sulfation of both CS and KS chains24,31.
Keratan sulfate is a GAG that is restricted to only a few tissues such as the central nervous system, corneal stroma, and cartilage22. This GAG, in its sulfated form, is not produced by hMSCs; however, upon differentiation as chondrocytes it is expressed as a sulfated GAG. The genes for three PG core proteins that bear this GAG, lumican, fibromodulin, and PRELP are also upregulated. Immunohistochemical analyses of hMSCs and day 3 aggregates indicates that sulfated KS appears as a differentiation marker.
The initial ECM upon differentiation is decidedly non-cartilage-like in that the principal components are fibronectin, type I collagen, and versican6,34,48,49. It is during the later maturation period that a more cartilage-like matrix begins to form; this includes type II collagen and aggrecan. Furthermore, this later period is where a significant upregulation in genes that are necessary for the production of molecules that participate in type II collagen fibrillogenesis occurs. In combination, this leads to the appearance of a cartilage matrix in mature aggregates by day 20 of culture. These aggregates contain the four distinct structural domains that have been described for authentic hyaline cartilage2.
Matrix assembly in culture is an inefficient process, particularly in early cultures. Consequently, a substantial portion of matrix molecules enter the surrounding medium. This provides the opportunity to perform semi-quantitative and/or quantitative assays to monitor matrix production, and the evolution of the cultured tissue without disturbing the developmental process. Such non-invasive assays can be performed upon conditioned medium that is routinely collected when medium is replaced. There are a large number of potential matrix molecules that were assembled during this model chondrogenic process. Therefore, it is necessary to obtain a base of information to determine which matrix molecules should be selected for this purpose. Table 2 provides a time-line for chondrogenic aggregate cultures. These data are based upon messenger RNA levels, not upon protein levels. Nonetheless, they provide a guide as to which matrix molecules might be suitable for such assays. A proof of principal assay has been incorporated into the current study.
Table 2.
Time Line, Predicted Matrix Molecules in Conditioned Medium
| Proteoglycans | Day 0 | Day 3 | Day 10 | Day 14 |
|---|---|---|---|---|
| Aggrecan | –1 | – | +/−2 | ↑ |
| Versican | ↑↑ | ↑↑ | ↑ | ↑ |
| Decorin | ↑↑ | ↑↑↑↑ | ↑↑↑ | ↑↑↑ |
| lumican | ↑↑ | ↑↑↑ | ↑↑↑ | ↑↑↑ |
| Collagens | ||||
| Collagen I | ↑↑↑ | ↑↑↑ | ↑↑↑ | ++++ |
| Collagen II | – | – | ↑ | ↑↑ |
| Collagen IX | – | – | ↑ | ↑↑ |
| Collagen X | ↑ | + | ↑↑ | ++++ |
| Collagen XI | ↑ | + | ↑↑ | ↑↑↑ |
| Other Matrix | ||||
| Fibronectin | ↑ | ↑↑ | ↑ | ↑ |
| Tenascin-c | ↑↑ | ↑↑ | ↑↑ | ↑↑ |
| Comp | ↑ | ↑↑ | ↑↑↑ | ↑↑↑↑ |
| Dermatopontin | – | ↑↑ | ↑↑ | ↑↑↑ |
not present;
questionable. Hypothetical analyses of conditioned medium. This was based upon microarray data16 for this study.
In short, chondrogenesis initiated from hMSCs follow a pattern of progression that has been observed in other studies7,38. In this lab, a biphasic response to FGF-9 and FGF-18 was observed at early time-points (day 7 or earlier) than at later time-points15. In a similar manner Bradley and Drissi37 observed differential responses to Wnt-5a when provided at early and later time-points. In both situations, the appearance of type X collagen was suppressed. Under normal conditions, type X collagen expression, which denotes hypertrophy, normally appears in aggregate cultures at or slightly before day 14 of culture. This indicates that the chondrocytes at this time-point are physiological different from their early precursors. This also emphasizes the point that aggregate cultures do not fully replicate the fabrication sequence necessary for the formation of articular cartilage.
Supplementary Material
Acknowledgments
We wish to thank Drs. Michael West, Hal Sternberg, and Ivan Labat for performing the microarray analyses. We also wish to thank Amad Awadallah for histological processing of aggregate cultures. Dr. Donald Lennon and Margie Harris obtained hMSCs and established primary cultures of cells used in these studies. Dr. Jean Welter provided expertise in reading the manuscript. This work was supported in part by the L. David and E. Virginia Baldwin Fund and also by NIH/NIBIB grants 1RO1EB020367 and 1P41EB021911.
Footnotes
Contribution Statement: JM Sorrell performed data analyses and was the principal author, RA Somoza was responsible for aggregate culture and RNA extraction for microarray analyses, AI Caplan provided oversight and direction.
This article has been accepted for publication and undergone full peer review but has not been through the copyediting, typesetting, pagination and proofreading process, which may lead to differences between this version and the Version of Record. Please cite this article as doi: [10.1002/jor.23820]
Additional Supporting Information may be found in the online version of this article.
Conflicts of Interests
The authors have no conflicts of interest to disclose.
References
- 1.Hall BK, Miyake T. All for one and one for all: condensations and the initiation of skeletal development. BioEssays. 2000;22:138–147. doi: 10.1002/(SICI)1521-1878(200002)22:2<138::AID-BIES5>3.0.CO;2-4. [DOI] [PubMed] [Google Scholar]
- 2.Knudson CB, Knudson W. Cartilage proteoglycans. Semin Cell Dev Biol. 2001;12:69–78. doi: 10.1006/scdb.2000.0243. [DOI] [PubMed] [Google Scholar]
- 3.Melrose J, Shu C, Whitelock JM, Lord MS. The cartilage extracellular matrix as a transient developmental scaffold for growth plate maturation. Matrix Biol. 2016;(52–54):363–383. doi: 10.1016/j.matbio.2016.01.008. [DOI] [PubMed] [Google Scholar]
- 4.Brown DS, Eames BF. Emerging tools to study proteoglycan function during skeletal development. Meth Cell Biol. 2016;134:485–530. doi: 10.1016/bs.mcb.2016.03.001. [DOI] [PubMed] [Google Scholar]
- 5.Behonick DJ, Werb Z. A bit of give and take: the relationship between the extracellular matrix and the developing chondrocyte. Mech Dev. 2003;120:1327–1336. doi: 10.1016/j.mod.2003.05.002. [DOI] [PMC free article] [PubMed] [Google Scholar]
- 6.Singh P, Schwarzbauer JE. Fibronectin matrix assembly is essential for cell condensation during chondrogenesis. JCell Sci. 2014;127:4420–4428. doi: 10.1242/jcs.150276. [DOI] [PMC free article] [PubMed] [Google Scholar]
- 7.Seklya I, Vuoristo JT, Larson BL, Prockop DJ. In vitro cartilage formation by human adult stem cells from bone marrow stroma defines the sequence of cellular and molecular events during chondrogenesis. Proc Natl Acad Sci USA. 2002;99:4397–4402. doi: 10.1073/pnas.052716199. [DOI] [PMC free article] [PubMed] [Google Scholar]
- 8.Johnstone B, Alini M, Cucchiarini M, Dodge GR, Eglin D, Fuilak F, Madry H, Mata A, Mauck RL, Semino CE, Stoddart MJ. Tissue engineering for articular cartilage repair – the state of the art. Eur Cell Mater. 2013;25:248–267. doi: 10.22203/ecm.v025a18. [DOI] [PubMed] [Google Scholar]
- 9.Murdoch AD, Hardingham TE, Eyre DR, Fernandes RJ. The development of a mature collagen network in cartilage from human bone marrow stem cells in Transwell culture. Matrix Biol. 2016;50:16–26. doi: 10.1016/j.matbio.2015.10.003. [DOI] [PMC free article] [PubMed] [Google Scholar]
- 10.Yoo JU, Barthel TS, Nishimura K, Solchaga L, Caplan AI, Goldberg VM, Johnstone B. The chondrogenic potential of human bone-marrow-derived mesenchymal progenitor cells. J Bone Joint Surg-A. 1998;80A:1745–1757. doi: 10.2106/00004623-199812000-00004. [DOI] [PubMed] [Google Scholar]
- 11.Solchaga LA, Penick K, Goldberg VM, Caplan AI, Welter JF. Fibroblast growth factor-2 enhances proliferation and delays loss of chondrogenic potential in human adult bone- marrow-derived mesenchymal stem cells. Tissue Engr Part A. 2010;16:1009–1019. doi: 10.1089/ten.tea.2009.0100. [DOI] [PMC free article] [PubMed] [Google Scholar]
- 12.Bager CL, Gudmann N, Willumsen N, Leeming DJ, Karsdal MA, Bay-Jensen AC, Høgdall E, Balslev I, He Y. Quantification of fibronectin as a method to assess ex vivo extracellular matrix remodeling. Biochem Biophys Res Comm. 2016;478:586–591. doi: 10.1016/j.bbrc.2016.07.108. [DOI] [PubMed] [Google Scholar]
- 13.Mansour JM, Lee Z, Welter JM. Nondestructive techniques to evaluate the characteristics and development of engineered cartilage. Ann Biomed Engr. 2016;44:733–74. doi: 10.1007/s10439-015-1535-9. [DOI] [PMC free article] [PubMed] [Google Scholar]
- 14.Lennon DP, Caplan AI. Isolation of human marrow-derived mesenchymal stem cells. Exp Hematol. 2006;34:1604–1605. doi: 10.1016/j.exphem.2006.07.014. [DOI] [PubMed] [Google Scholar]
- 15.Correa D, Somoza RA, Lin P, Greenberg S, Rom E, Duesler L, Welter JF, Yayon A, Caplan AI. Sequential exposure to fibroblast growth factors (FGF) 2, 9, and 18 enhances hMSC chondrogenic differentiation. Osteoarthr Cartilage. 2015;23:443–453. doi: 10.1016/j.joca.2014.11.013. [DOI] [PMC free article] [PubMed] [Google Scholar]
- 16.Somoza RA, Correa D, Labat I, Sternberg H, Forrest ME, Khalil AK, West MD, Tesar P, Caplan AI. Transcriptome-wide analyses of human neonatal articular cartilage and human mesenchymal stem cells (MSCs)-derived cartilage provide a new molecular target for evaluating engineered cartilage. Tissue Engr Part A. 2017 doi: 10.1089/ten.tea.2016.0559. [DOI] [PMC free article] [PubMed] [Google Scholar]
- 17.Sorrell JM, Mahmoodian F, Caterson B. Immunochemical characterization and ultrastructural localization of chondroitin sulfates and keratan sulfates in embryonic chick bone marrow. Cell Tis Res. 1988;252:523–531. doi: 10.1007/BF00216639. [DOI] [PubMed] [Google Scholar]
- 18.Sorrell JM, Carrino DA, Baber BA, Asselineau DA, Caplan AI. Monoclonal antibody PG-4 recognizes a glycosaminoglycan epitope found on both dermatan sulfate and chondroitin sulfate proteoglycans in human skin. Histochem J. 1999;31:549–558. doi: 10.1023/a:1003896124595. [DOI] [PubMed] [Google Scholar]
- 19.Barry F, Boynton R, Murphy M, Zaia J. The SH-3 and SH-4 antibodies recognize distinct epitopes on CD73 from human mesenchymal stem cells. Biochem Biophys Res Commun. 2001;289:519–524. doi: 10.1006/bbrc.2001.6013. [DOI] [PubMed] [Google Scholar]
- 20.Carrino DA, Arias JL, Caplan AI. A spectrophotometric modification of a sensitive densitometric safranin-O assay for glycosaminoglycans. Biochem Int. 1991;24:485–495. [PubMed] [Google Scholar]
- 21.Deepa SS, Yamada S, Zako M, Goldberger O, Sugahara K. Chondroitin sulfate chains on syndecan-1 and syndecan-4 from normal murine mammary gland epithelial cells are structurally and functionally distinct and cooperate with heparan sulfate chains to bind growth factors. A novel function to control binding of midkine, pleiotrophin, and basic fibroblast growth factor. J Biol Chem. 2004;279:37368–37376. doi: 10.1074/jbc.M403031200. [DOI] [PubMed] [Google Scholar]
- 22.Pomin VH. Keratan sulfate: an up-to-date review. Int J Biol Macromol. 2015;72:282–289. doi: 10.1016/j.ijbiomac.2014.08.029. [DOI] [PubMed] [Google Scholar]
- 23.Melching LI, Roughley PJ. Modulation of keratan sulfate synthesis on lumican by the action of cytokines on human articular chondrocytes. Matrix Biol. 1999;18:3810390. doi: 10.1016/s0945-053x(99)00033-5. [DOI] [PubMed] [Google Scholar]
- 24.Antonsson P, Heinegard D, Oldberg B. Posttranslational modifications of fibromodulin. J Biol Chem. 1991;266:16859–16661. [PubMed] [Google Scholar]
- 25.Funderburgh JL. Keratan sulfate: structure, biosynthesis, and function. Glycobiology. 2000;10:951–958. doi: 10.1093/glycob/10.10.951. [DOI] [PubMed] [Google Scholar]
- 26.Leung AWY, Backstrom I, Bally MB. Sulfonation, an underexploited area: from skeletal development to infectious diseases and cancer. Oncotarget, Advance Publications; 2016. [DOI] [PMC free article] [PubMed] [Google Scholar]
- 27.Cortes M, Baria AT, Schwartz NB. Sulfation of chondroitin sulfate proteoglycans is necessary for proper Indian hedgehog signaling in the developing growth plate. Development. 2009;136:1697–1706. doi: 10.1242/dev.030742. [DOI] [PMC free article] [PubMed] [Google Scholar]
- 28.Chavez RD, Coricor G, Perez J, Seo H-S, Serra R. SOX9 protein is stabilized by TGF-β and regulates PAPSS2 mRNA expression in chondrocytes. Osteoarthritis Cartilage. 2017;25:332e340. doi: 10.1016/j.joca.2016.10.007. [DOI] [PMC free article] [PubMed] [Google Scholar]
- 29.Kusche-Gullberg M, Kjellén L. Sulfotransferases in glycosaminoglycan biosynthesis. Curr Opin Struct Biol. 2003;13:605–611. doi: 10.1016/j.sbi.2003.08.002. [DOI] [PubMed] [Google Scholar]
- 30.Thiele H, Sakano M, Kitagawa H, Sugahara K, Rajab A, Höhne W, Ritter H, Leschik G, Nürnberg P, Mundlos S. Loss of chondroitin 6-O-sulfotransferase-1 function results in severe human chondrodysplasia with progressive spinal involvement. Proc Natl Acad Sci USA. 2004;101:10155–10160. doi: 10.1073/pnas.0400334101. [DOI] [PMC free article] [PubMed] [Google Scholar]
- 31.Langford R, Hurrion E, Dawson PA. Genetics and pathophysiology of mammalian sulfate biology. J Genet Genomics. 2017;44:7–20. doi: 10.1016/j.jgg.2016.08.001. [DOI] [PubMed] [Google Scholar]
- 32.Haila S, Hästbacka J, Böhling T, Karjalainen-Lindsberg M-L, Kere J, Saarialho-Kere U. SLC26A2 (diastrophic dysplasia sulfate transporter) is expressed in developing and mature cartilage but also in other tissues and cell types. J Histochem Cytochem. 2001;49:973–982. doi: 10.1177/002215540104900805. [DOI] [PubMed] [Google Scholar]
- 33.Park M, Ohana E, Choi SY, Lee M-S, Park JH, Muallem S. Multiple roles of the SO42-/Cl-/OH- exchanger protein Slc26a2 in chondrocyte functions. J Biol Chem. 2014;289:1993–2001. doi: 10.1074/jbc.M113.503466. [DOI] [PMC free article] [PubMed] [Google Scholar]
- 34.Kadler KE, Hill A, Canty-Laird EG. Collagen fibrillogenesis: fibronectin, integrins, and minor collagens as organizers and nucleators. Curr Opin Cell Biol. 2008;20:495–501. doi: 10.1016/j.ceb.2008.06.008. [DOI] [PMC free article] [PubMed] [Google Scholar]
- 35.Luo Y, Sinkeviciute D, He Y, Karsdal M, Henrotin Y, Mobasheri A, Önnerfjord P, Bay-Jensen A. The minor collagens in articular cartilage. Protein Cell. 2017 doi: 10.1007/s13238-017-0377-7. [DOI] [PMC free article] [PubMed] [Google Scholar]
- 36.Wilusz RE, Sanchez-Adams J, Guilak F. The structure and function of the pericellular matrix of articular cartilage. Matrix Biol. 2014;39:25–32. doi: 10.1016/j.matbio.2014.08.009. [DOI] [PMC free article] [PubMed] [Google Scholar]
- 37.Mackie EJ, Thesleff I, Chiquet-Ehrismarm Tenascin is associate with chondrogenic and osteogenic differentiation in vivo and promotes chondrogenesis in vitro. J Cell Biol. 1987;105:2569–2579. doi: 10.1083/jcb.105.6.2569. [DOI] [PMC free article] [PubMed] [Google Scholar]
- 38.Bradley EW, Drissi MH. WNT5A Regulates Chondrocyte Differentiation through Differential Use of the CaN/NFAT and IKK/NF B Pathways. Mol Endocrinol. 2010;24:1581–1593. doi: 10.1210/me.2010-0037. [DOI] [PMC free article] [PubMed] [Google Scholar]
- 39.Correa D, Somoza RA, Caplan AI. Non‐destructive/non‐ invasive imaging evaluation of cellulardifferentiation progression during in vitro MSC‐derived chondrogenesis. Tissue Engr Part A. 2017 doi: 10.1089/ten.tea.2017.0125. [DOI] [PMC free article] [PubMed] [Google Scholar]
- 40.Nuka S, Zhouy W, Henry SP, Gendron CM, Schultz JB, Shinomura T, Johnson J, Wang Y, Keene DR, Ramirez-Solis R, Behringer RR, Young MF, Höök M. Phenotypic characterization of epiphycan-deficient and epiphycan/biglycan double-deficient mice. Osteoarthritis Cartilage. 2010;18:88–96. doi: 10.1016/j.joca.2009.11.006. [DOI] [PMC free article] [PubMed] [Google Scholar]
- 41.Stelzer C, Brimmer A, Hermanns P, Zabel B, Dietz UH. Expression profile of Papss2 (3′-phosphoadenosine 5′-phosphosulfate synthase 2) during cartilage formation and skeletal development in the mouse embryo. Dev Dyn. 2007;236:1313–1318. doi: 10.1002/dvdy.21137. [DOI] [PubMed] [Google Scholar]
- 42.Schwartz NB, Domowicz M. Chondrodysplasias due to proteoglycan defects. Glycobiology. 2002;12:57R–68R. doi: 10.1093/glycob/12.4.57r. [DOI] [PubMed] [Google Scholar]
- 43.Nakagawa Y, Muneta T, Otabe K, Ozeki N, Mizumo M, Undo M, Saito R, Yanagisawa K, Ichinose S, Koga H, Tsuji K, Sekiya I. Cartilage derived from bone marrow mesenchymal stem cells expresses lubricin in vitro and in vivo. PlosOne. 2016 doi: 10.1371/journal.pone.0148777. [DOI] [PMC free article] [PubMed] [Google Scholar]
- 44.Gasimili L, Hickey AM, Yang B, Li G, dela Rosa M, Nairn AV, Kulik MJ, Dordick JS, Moremen KW, Dalton S, Linhardt RJ. Changes in glycosaminoglycan structure on differentiation of human embryonic stem cells towards mesoderm and endoderm lineages. Biochim Biophys Acta. 2014;1840:1993–2003. doi: 10.1016/j.bbagen.2014.01.007. [DOI] [PMC free article] [PubMed] [Google Scholar]
- 45.Dowthwaite GP, Bishop JC, Redman SN, Khan IM, Rooney P, Evans DJR, Haughton L, Bayram Z, Boyer S, Thomson B, Wolfe MS, Archer CW. The surface of articular cartilage contains a progenitor cell population. J Cell Sci. 2004;117:889–897. doi: 10.1242/jcs.00912. [DOI] [PubMed] [Google Scholar]
- 46.Hayes AJ, Tudor D, Nowell MA, Caterson B, Hughes CE. Chondroitin sulfate sulfation motifs as putative biomarkers for isolation of articular cartilage progenitor cells. J Histochem Cytochem. 2008;56:125–138. doi: 10.1369/jhc.7A7320.2007. [DOI] [PMC free article] [PubMed] [Google Scholar]
- 47.Martinez C, Hofmann TJ, Marino R, Dominici M, Horwitz EM. Human bone marrow mesenchymal stromal cells express the neural ganglioside GD2: a novel surface marker for the identification of MSCs. Blood. 2007;109:4245–4248. doi: 10.1182/blood-2006-08-039347. [DOI] [PMC free article] [PubMed] [Google Scholar]
- 48.Matsumoto K, Kamiya N, Suwan K, Atsumi F, Shimizu K, Shinomura T, Yamada Y, Kimata K, Watanabe H. Identification and characterization of versican/PG-M aggregates in cartilage. J Biol Chem. 2006;281:18257–18263. doi: 10.1074/jbc.M510330200. [DOI] [PubMed] [Google Scholar]
- 49.Sztrolovics R, Grover J, Cs-Szabo G, Shi S-L, Zhang Y, Mort JS, Roughley PJ. The characterization of versican and its message in human articular cartilage and intervertebral disc. J Orthop Res. 2002;20:257–266. doi: 10.1016/S0736-0266(01)00110-3. [DOI] [PubMed] [Google Scholar]
Associated Data
This section collects any data citations, data availability statements, or supplementary materials included in this article.