Abstract
Monoacylglycerol lipase (MAGL) is a main regulator of the endocannabinoid system within the central nervous system (CNS). Recently, [11C]SAR127303 was developed as a promising radioligand for MAGL imaging. In this study, we aimed to quantify regional MAGL concentrations in the rat brain using positron emission tomography (PET) with [11C]SAR127303. An irreversible two-tissue compartment model (2-TCMi, k4 = 0) analysis was conducted to estimate quantitative parameters (k3, Ki2-TCMi, and λk3). These parameters were successfully obtained with high identifiability (< 10 %COV) for the following regions ranked in order from highest to lowest: cingulate cortex > striatum > hippocampus > thalamus > cerebellum > hypothalamus ≈ pons. In vitro autoradiographs using [11C]SAR127303 showed a heterogeneous distribution of radioactivity, as seen in the PET images. The Ki2-TCMi and λk3 values correlated relatively highly with in vitro binding (r > 0.4, P < 0.005). The Ki2-TCMi values showed high correlation and low underestimation (< 10%) compared with the slope of a Patlak plot analysis with linear regression (KiPatlak). In conclusion, we successfully estimated regional net uptake value of [11C]SAR127303 reflecting MAGL concentrations in rat brain regions for the first time.
Keywords: monoacylglycerol lipase, net influx constant Ki, Patlak plot, positron emission tomography, two-tissue compartment model
Introduction
The endocannabinoid (eCB) system is a well-known neurotransmission network within the central and peripheral nervous system. Its functions are mainly regulated by two-types of G protein-coupled cannabinoid receptors, CB1 and CB2 (Woodhams et al., 2017). These receptors are stimulated by binding to endocannabinoids, such as 2-arachidoneylglycerol (2-AG) and anandamide (AEA). These endocannabinoids are produced on demand through stimulus-dependent cleavage of phospholipid precursors; they can modulate multiple physiological processes including pain, inflammation, appetite, memory, and emotion, and are terminated by enzymatic hydrolysis (Di Marzo, 2009). Among the endocannabinoids, 2-AG is generated by activation of phospholipase C and diacylglycerol lipase, which are linked with activation of Gq protein-coupled receptors such as group I metabotropic glutamate receptors, and are inactivated by monoacylglycerol lipase (MAGL) (Labar et al., 2010). Moreover, the concentration of 2-AG in the brain is very substantially higher than that of AEA. Recent emerging evidence indicates that 2-AG is an important signaling mediator, maintaining brain homeostasis by exerting its anti-inflammatory and neuroprotective effects in response to harmful insults via CB1/2 receptor-dependent and/or receptor-independent mechanisms (Xu and Chen, 2015). Against this background, the monitoring of MAGL as a modulator of 2-AG appears to be an important subject of study with regard to resolving disturbances in brain homeostasis.
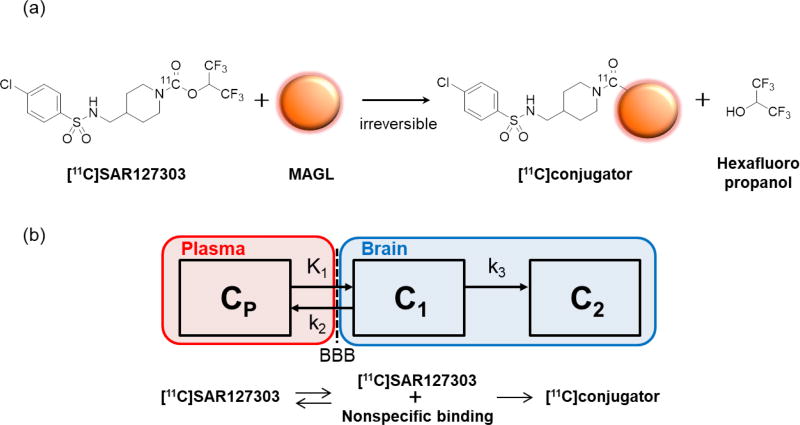
Positron emission tomography (PET) is a well-known advanced molecular imaging technique that uses pharmaceuticals labelled with positron-emitting nuclides (e.g., 11C, 18F, and 15O); it enables in vivo molecular information to be obtained via qualitative visualization and quantitative measurement of nuclide uptake. In vivo monitoring of MAGL with PET would enable investigations of the involvement of the eCB system in central nervous system (CNS) disorders. The first radioligands developed for MAGL imaging were reported in 2014 (Hicks et al., 2014). However, there were no useful PET ligands for MAGL imaging available at that time. Recently, several radioligands for MAGL have been developed (Wang et al., 2016a,b; Ahamed et al., 2017; Chen et al., 2018). Of these, [11C]SAR127303 (LogD = 3.69) showed high heterogeneous brain uptakes of radioactivity in PET studies using rats, which were significantly reduced by pretreatment with KML29, a potent inhibitor of MAGL (Wang et al., 2016b). These results strongly suggest that [11C]SAR127303 displays specific and selective binding to MAGL. Moreover, a high brain uptake of [11C]SAR127303 was also observed in a PET assessment using a nonhuman primate. The characteristics of the kinetics of [11C]SAR127303 in rodent and nonhuman primate brains indicate irreversible binding to MAGL (Figure 1a) (Wang et al., 2016b). In this study, we aimed to estimate regional MAGL concentrations using quantitative PET analysis with [11C]SAR127303 and subsequently making comparisons with in vitro binding of [11C]SAR127303 on autoradiographs.
Figure 1.
Mechanism of action for binding of [11C]SAR127303 to monoacylglycerol lipase (MAGL) (a), and the irreversible two-tissue compartment model used in this study (b).
Materials and methods
General
All experiments were approved by the committee of the National Institutes for Quantum and Radiological Science and Technology (QST).
[11C]SAR127303 was synthesized from a piperidine precursor with [11C]COCl2 in the presence of 1,2,2,6,6-pentamethylpiperidine, followed by treatment with 1,1,1,3,3,3-hexafluoro-2-propanol, as described previously (Wang et al., 2016a,b). At the end of synthesis, 0.47 ± 0.33 GBq (n = 7) of [11C]SAR12703 was obtained with > 99% radiochemical purity and 89.4 ± 58.9 GBq/µmol molar activity; this was suitable for the animal experiments.
Animals
Male Sprague Dawley (SD) rats (Japan SLC, Shizuoka, Japan) were kept in a temperature-controlled environment with a 12-h light/dark cycle and were fed on a standard diet (MB-1/Funabashi Farm, Chiba, Japan). Animal experiments were performed according to the recommendations of the Committee for the Care and Use of Laboratory Animals in QST and the ARRIVE guidelines (http://www.nc3rs.org/ARRIVE).
PET procedure
To develop an optimal quantitative method, brain PET examinations with [11C]SAR127303 were performed on SD rats (n = 7, male, 8–10 weeks old, 330 ± 45 g). Prior to PET scanning, each rat had a polyethylene catheter (FR2/Imamura, Tokyo, Japan) inserted into the left femoral artery for blood sampling and a 24-gauge catheter (Terumo Medical Products, Tokyo, Japan) inserted into the tail vein for a bolus injection, with the catheter insertions being performed under anesthesia (1.5%–2% isoflurane in air). Subsequently, rats were placed in a small-animal PET scanner (Inveon/Siemens, Knoxville TN, USA) and injected with a bolus of [11C]SAR127303 (37–50 MBq, 0.5–1.0 pmol in 1.0 mL saline) at a rate of 0.5 mL/min using a syringe pump (PHD 2000/Harvard Apparatus, MA, USA) via the tail vein catheter. Dynamic emission scans were acquired in a three-dimensional list mode for 60 min (10 s × 12 frames, 20 s × 3 frames, 30 s × 3 frames, 1 min × 3 frames, 2.5 min × 3 frames, and 5 min × 8 frames). PET dynamic images were reconstructed with filtered back projection using a Hanning filter with a Nyquist cut-off of 0.5 cycle/pixel.
Arterial blood samples (50–400 µL, total 1.8 mL) were collected at 20, 40, 60, 80, 100, 110, 120, 130, 140, 160 s, and 3, 4, 5, 10, 15, 30, 45, and 60 min after the injection. The radioactivity in the whole blood and plasma was counted using a 1480 Wizard autogamma scintillation counter (Perkin-Elmer, Waltham, MA, USA). Radioactivity was corrected for decay.
Metabolite analysis
Plasma samples (50–200 µL) separated at selected time points (1, 5, 15, 30, 45, and 60 min) were spiked with 20% (v/v) of a 50% aqueous acetic acid solution. The mixture was collected in a test tube containing an equivalent volume of acetonitrile (MeCN) and then vortexed for 15 s followed by centrifugation at 20 000 g for 2 min for deproteinization. An aliquot of the supernatant was injected into a radio-high-performance liquid chromatography (HPLC) system (Shimadzu, Kyoto, Japan) equipped with a radioactivity detector (Takei et al., 2001), and analyzed using a Capcell Pack C18 column (4.6 mm i.d. × 250 mm; Shiseido, Tokyo, Japan) with MeCN/H2O/trifluoroacetic acid (7/3/0.01, v/v/v) at 1.5 mL/min. The percentage of [11C]SAR127303 (retention time = 8.7 min) to total radioactivity (corrected for decay) on the HPLC chromatogram was calculated as % = (peak area of [11C]SAR127303/total peak area) × 100. To estimate deposit of unmetabolized [11C]SAR127303 in plasma protein pellet, [11C]SAR127303 (1 MBq, 10 µL) was incubated with plasma sample (100 µL) for 5 min at room temperature, vortexed, and deproteinnized as described above. After centrifuge, the radioactivities in the supernatant and plasma pellets were counted using a 1480 Wizard autogamma scintillation counter. A metabolite-corrected plasma curve was generated from the product of the plasma activity and the unchanged form of the [11C]SAR127303 fraction.
Data analysis
Summed PET images acquired between 0 and 60 min after the injection of [11C]SAR127303 were produced using PMOD software (version 3.4, PMOD Technologies, Zurich, Switzerland). Volumes of interest (VOIs) were manually drawn on the cingulate cortex, striatum (caudate/putamen), hippocampus, thalamus, hypothalamus, pons, and cerebellum, by reference to MRI templates of SD rat brain (Yamasaki et al., 2016). The respective tissue time-activity curves (tTACs) for each VOI were then derived from the dynamic PET images. The radioactivity was decay corrected to the injection time and expressed as a standardized uptake value (SUV), which was normalized to the injected radioactivity and body weight.
| (1) |
Kinetic analysis
Kinetic analyses with arterial blood sampling were performed using a one-tissue compartment model (1-TCM), an irreversible two-tissue compartment model (2-TCMi) (Figure 1B) (Rusijan et al., 2013) and Patlak graphical analysis (Patlak plot) (Patlak et al., 1983) using the metabolite-corrected plasma curve as an input function. In the 2-TCMi model, three rate constants (K1–k3) were estimated by nonlinear-least-squares (NLS) fitting and the Ki and λk3 values (Rusijan et al., 2013) for each region were calculated:
| (2) |
| (3) |
The blood volume fraction (vB) in the rat brain was fixed at 2% and time delay (5.0 ± 2.1 s) in tTAC was automatically estimated from time delay of TAC in the whole brain from the time course of the input function using PMOD software. In the Patlak plot, the Ki value of each region was estimated as the slope of a regression line of points between 15 and 60 min:
| (4) |
where CT and CP express radioactive concentrations in tissue and plasma respectively. The slope and intercept must be interpreted according to the underlying compartment model. For the irreversible radioligand mentioned, the slope equals Ki and represents the influx, while the intercept V is combination of vB and the reversible compartment (C1) distribution volume.
In vitro autoradiography
Sagittal brain sections (20 µm) were prepared from three rats (male, 8 weeks old) different from PET assessments. Briefly, rats were killed by cervical dislocation under anesthesia (3% isoflurane in air) and their brains were quickly removed, frozen in crushed dry ice, and sliced into sections using a cryostat (HM560; Carl Zeiss, Oberkochen, Germany). The sections from all rats were preincubated for 10 min in 20 mM Tris-HCl buffer (pH 8.0) containing 1 mM EDTA and 0.01% Triton X-100 at room temperature. After preincubation, the sections were incubated for 30 min at room temperature in fresh buffer containing [11C]SAR127303 (7.6 MBq, 0.1 nM). After incubation, brain sections were washed (3 × 2 min) with cold buffer, immersed in cold distilled water, and then dried with cold air. The sections were then placed in contact with imaging plates (BAS-MS2025, FUJIFILM, Tokyo, Japan) for 60 min. Autoradiograms were obtained and the photo-stimulated luminescence (PSL) values of the ROIs were measured using a Bio-Imaging Analyzer System (BAS5000, FUJIFILM).
Statistical methods
Goodness of fit was evaluated using the Akaike Information Criterion (AIC) (Akaike., 1974) and the Model Selection Criterion (MSC) (Handbook MS, 1995).Values are given as mean ± standard deviation. The percentage of coefficients of variation (%COV) was estimated from the diagonal of the covariance matrix of the fitting. All data analyses were performed using GraphPad Prism v5.0 (GraphPad Software, La Jolla, CA, USA).
Results
Plasma input function
The deposit of unmetabolized [11C]SAR127303 in plasma protein pellet was 3.6 ± 0.6% (n = 3) through the metabolite analysis. Therefore, it was considered that there was no risk underestimating the % metabolism.
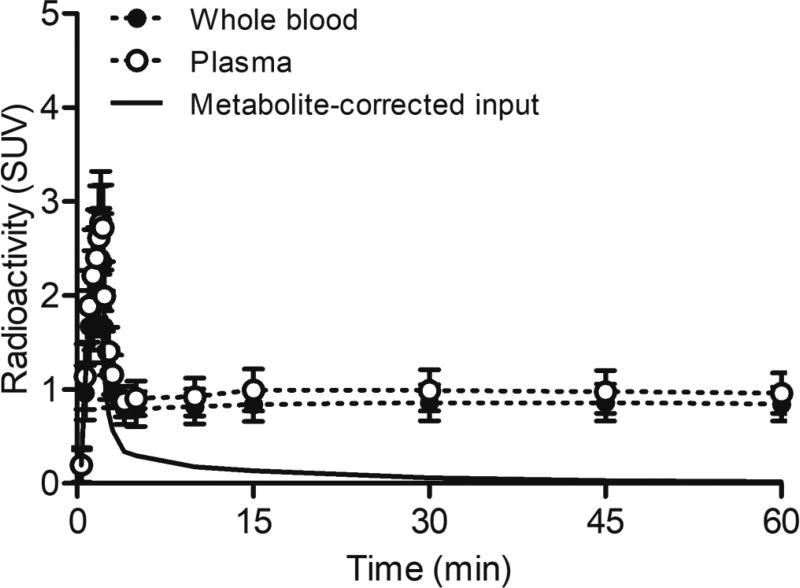
Figure 2 shows time-curves of radioactivity for the whole blood, plasma, and metabolite-corrected plasma input function. [11C]SAR127303 was quickly metabolized to two polar metabolites (Supplementary Figure S1). The time course for the unchanged form of [11C]SAR127303 was 89.2% ± 9.4%, 30.9% ± 3.9%, 14.0% ± 6.1%, 7.2% ± 5.6%, 3.3% ± 1.5%, and 1.4% ± 0.6% at 1, 5, 15, 30, 45, and 60 min post injection respectively. The averaged metabolite-corrected input curve of [11C]SAR127303 exhibited an SUV of 1.8 ± 0.4, peaking at 2 min post injection and quickly decreasing afterwards. At 30 min after the injection, the input curve had an SUV of less than 0.1 and then gradually decreased until the scan finished. At the end of the PET scan, the unchanged [11C]SAR127303 remaining in the plasma had an SUV of 0.02 ± 0.02.
Figure 2.
Time-curves of radioactivity in the whole blood, plasma, and metabolite-corrected plasma input function. Radioactivity is expressed as SUV.
Distribution of radioactivity across brain regions
After the [11C]SAR127303 injection, all of the rats showed uptake of radioactivity in the brain. High uptake was observed in the cingulate cortex, striatum, hippocampus, cerebellum, and thalamus, whereas radioactive uptake in the hypothalamus and pons/medulla was low (these regions are ranked in order of high to low uptake of radioactivity according to the TACs; Supplementary Figure S2). As expected from the known distribution of MAGL in rat brain (Dinh et al., 2002), the distribution of radioactivity was widespread and fairly uniform within the cingulate cortex, hippocampus, and cerebellum.
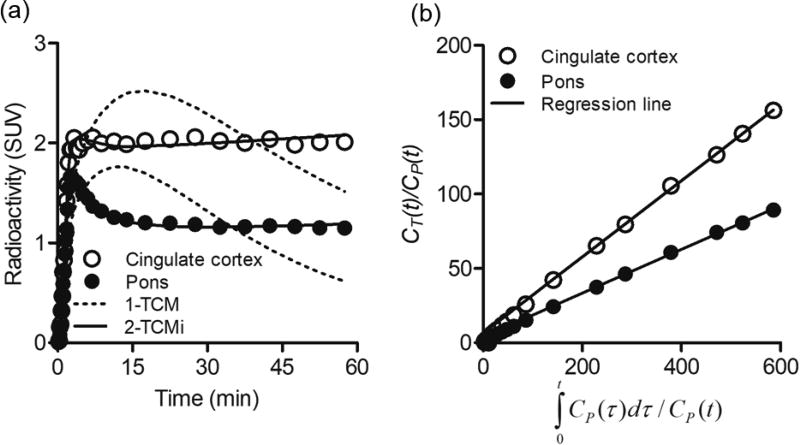
In the cingulate cortex with the highest radioactive uptake, the radioactivity rapidly penetrated into the brain, subsequently showed a gentle decline until 5–15 min, and was then retained until the end of the scan. On the other hand, radioactivity in the pons with the lowest radioactive uptake showed a slow decrease until 30 min after rapid penetration into the brain, which was a constant until the end of the scan (Figure 3). Additionally, these kinetics strongly supported that two polar metabolites of [11C]SAR127303 in the plasma (Supplementary Figure S1) could not enter the brain.
Figure 3.
Representative time-activity curves with compartment model fittings (a) and Patlak plot (b) in the cingulate cortex (open circles) and pons (solid circles). Radioactivity is expressed as SUV.
Kinetic analysis
Figure 3 shows representative NLS fitting curves based on 1-TCM (K1 = 0.53 mL/cm3/min, k2 = 0.02 /min for the cingulate cortex), 2-TCMi (K1 = 0.83 mL/cm3/min, k2 = 0.20 /min, and 0.10 /min for the cingulate cortex) (a), and a Patlak plot with linear regression (b). The 1-TCM was obviously insufficient to fit the TACs (Figure 3a). Moreover, respective the averaged AIC and MSC scores for goodness of fit for 1-TCM vs. 2-TCMi were 95.3 vs. −18.4 and 1.6 vs. 5.1 for the cingulate cortex and 121.3 vs. −47.1 and 0.8 vs. 5.9 for the pons. These results supported that 2-TCMi fits in PET with [11C]SAR127303 were better than 1-TCM.
Table 1 shows the results of the full kinetic parameters estimated by 2-TCMi. The three direct parameters (K1, k2, and k3) could be clearly estimated in all brain regions, with a 1.2–1.8 %COV for K1, a 3.5–7.4 %COV for k2, and a 3.4–6.7 %COV for k3. As the three parameters (K1–k3) were highly distinguishable, the composite parameters (K1/k2, Ki2-TCMi, and λk3) were also well defined, with K1/k2 having a 2.5–5.9 %COV, Ki2-TCMi a 4.5–8.7 %COV, and λk3 a 4.2–9.0 %COV. The ranked order of the brain regions according to the parameters (k3, Ki2-TCMi, and λk3) reflecting MAGL concentrations was: cingulate cortex > striatum > hippocampus > thalamus > cerebellum > hypothalamus > pons. These results showed high correlation (r > 0.999) with the KiPatlak values, which were obtained with high identifiability by linear regression (0.6–1.3 %COV).
Table 1.
Full kinetic parameters of PET with [11C]SAR127303.
| Region | 2-TCMi | Patlak plot | ||||||
|---|---|---|---|---|---|---|---|---|
|
|
|
|||||||
|
K1 (mL/cm3/min) |
k2 (/min) | k3(/min) | K1/k2(mL/cm3) |
Ki (mL/cm3/min) |
λk3 (mL/cm3/min) |
Slope (Ki) (mL/cm3/min) |
Intercept (mL/cm3) |
|
| Cingulate cortex | 0.68 ± 0.15 | 0.12 ± 0.04 | 0.08 ± 0.04 | 5.88 ± 2.02 | 0.26 ± 0.09 | 0.43 ± 0.19 | 0.24 ± 0.07 | 6.27 ± 3.39 |
| (1.8 ± 0.4) | (7.4 ± 2.3) | (6.7 ± 1.7) | (5.9 ± 2.0) | (8.7 ± 2.1) | (9.0 ± 2.5) | (1.1 ± 0.6) | (17.8 ± 18.4) | |
| Striatum | 0.67 ± 0.15 | 0.13 ± 0.04 | 0.08 ± 0.03 | 4.62 ± 1.38 | 0.24 ± 0.08 | 0.40 ± 0.16 | 0.23 ± 0.06 | 6.53 ± 3.94 |
| (1.4 ± 0.3) | (5.4 ± 1.7) | (4.9 ± 1.3) | (4.3 ± 1.4) | (6.4 ± 1.7) | (6.5 ± 1.9) | (0.8 ± 0.7) | (9.7 ± 7.5) | |
| Hippocampus | 0.62 ± 0.14 | 0.14 ± 0.04 | 0.08 ± 0.03 | 4.40 ± 1.21 | 0.22 ± 0.07 | 0.35 ± 0.14 | 0.20 ± 0.06 | 5.68 ± 3.86 |
| (1.5 ± 0.3) | (5.6 ± 1.7) | (5.0 ± 1.3) | (4.4 ± 1.4) | (6.6 ± 1.7) | (6.7 ± 1.9) | (0.8 ± 0.8) | (8.2 ± 6.0) | |
| Thalamus | 0.68 ± 0.15 | 0.16 ± 0.04 | 0.07 ± 0.03 | 3.19 ± 0.77 | 0.21 ± 0.07 | 0.31 ± 0.12 | 0.19 ± 0.05 | 5.92 ± 3.82 |
| (1.4 ± 0.3) | (4.6 ± 1.3) | (4.2 ± 1.1) | (3.5 ± 1.1) | (5.6 ± 1.4) | (5.5 ± 1.5) | (1.1 ± 1.3) | (8.8 ± 6.9) | |
| Hypothalamus | 0.61 ± 0.15 | 0.20 ± 0.05 | 0.07 ± 0.02 | 3.28 ± 0.76 | 0.15 ± 0.05 | 0.21 ± 0.07 | 0.14 ± 0.04 | 4.28 ± 2.19 |
| (1.7 ± 0.4) | (5.0 ± 1.4) | (4.7 ± 1.1) | (3.7 ± 1.0) | (6.4 ± 1.4) | (6.0 ± 1.4) | (1.3 ± 1.0) | (14.5 ± 12.3) | |
| Pons | 0.66 ± 0.17 | 0.20 ± 0.05 | 0.06 ± 0.02 | 4.43 ± 1.16 | 0.15 ± 0.05 | 0.20 ± 0.07 | 0.14 ± 0.04 | 4.35 ± 2.33 |
| (1.2 ± 0.2) | (3.5 ± 0.9) | (3.4 ± 0.8) | (2.5 ± 0.7) | (4.5 ± 1.1) | (4.2 ± 1.1) | (0.8 ± 0.5) | (7.9 ± 4.8) | |
| Cerebellum | 0.71 ± 0.18 | 0.18 ± 0.04 | 0.07 ± 0.03 | 4.10 ± 1.11 | 0.20 ± 0.07 | 0.29 ± 0.11 | 0.19 ± 0.06 | 5.39 ± 2.80 |
| (1.4 ± 0.3) | (4.5 ± 1.2) | (4.1 ± 1.0) | (3.4 ± 1.0) | (5.6 ± 1.3) | (5.3 ± 1.4) | (0.6 ± 0.6) | (7.3 ± 5.7) | |
Values in parentheses are percentages of coefficient of variation (%COV). Data are represented as mean ± s.d. (n = 7).
In vitro autoradiography
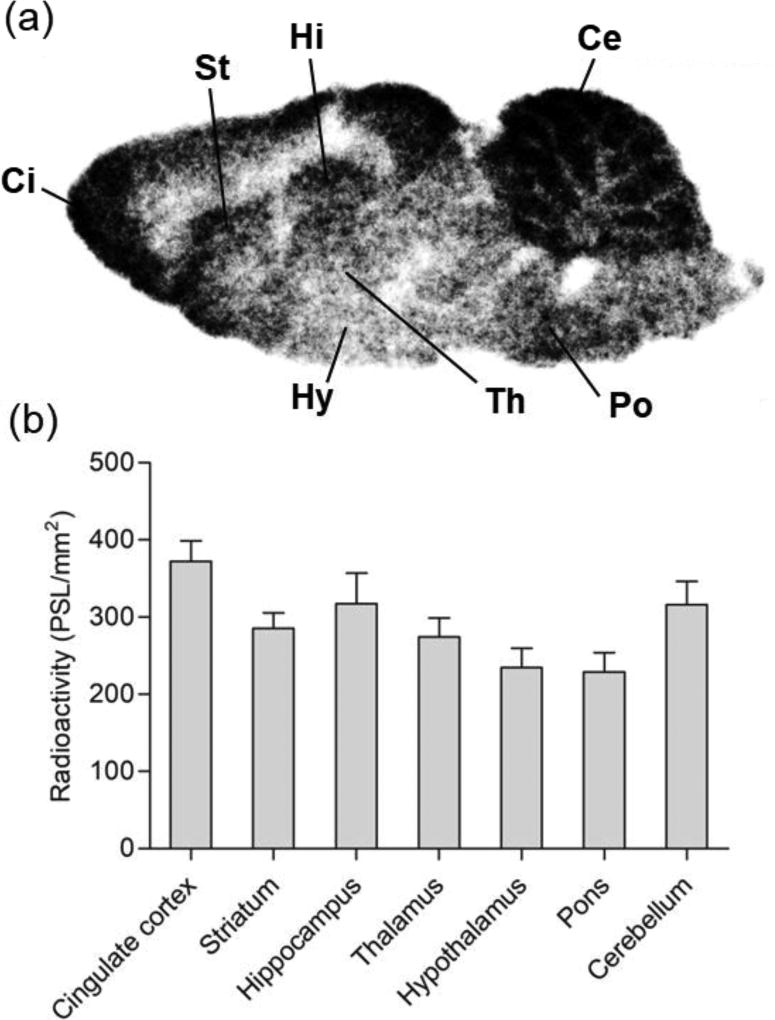
To investigate in vitro binding of [11C]SAR127303 to MAGL, we performed in vitro autoradiography using sagittal brain sections from three rats. Figure 4 shows the representative autoradiogram (Figure 4a) of [11C]SAR127303 and the concentration of radioactivity (PSL/mm2) in the different brain regions (Figure 4b). The distribution pattern of radioactivity was heterogeneous, with the highest radioactivity concentration occurring in the cingulate cortex. Moderate concentrations of radioactivity were seen in the hippocampus and cerebellum, but only weak signals were detected in the striatum and thalamus. Slight binding of [11C]SAR127303 was observed in the hypothalamus and pons. These distribution patterns of [11C]SAR127303 closely corresponded with the biological localization of MAGL (Dinh et al., 2002).
Figure 4.
Representative in vitro autoradiograph (a) and quantitative values in the different brain regions (b). Regions of interest were drawn as follows: Ci, cingulate cortex; St, striatum; Hi, hippocampus; Th, thalamus; Hy, hypothalamus; Ce, cerebellum; Po, pons. Radioactivity is expressed as PSL/mm2.
Correlation between kinetic parameters and in vitro binding of [11C]SAR127303
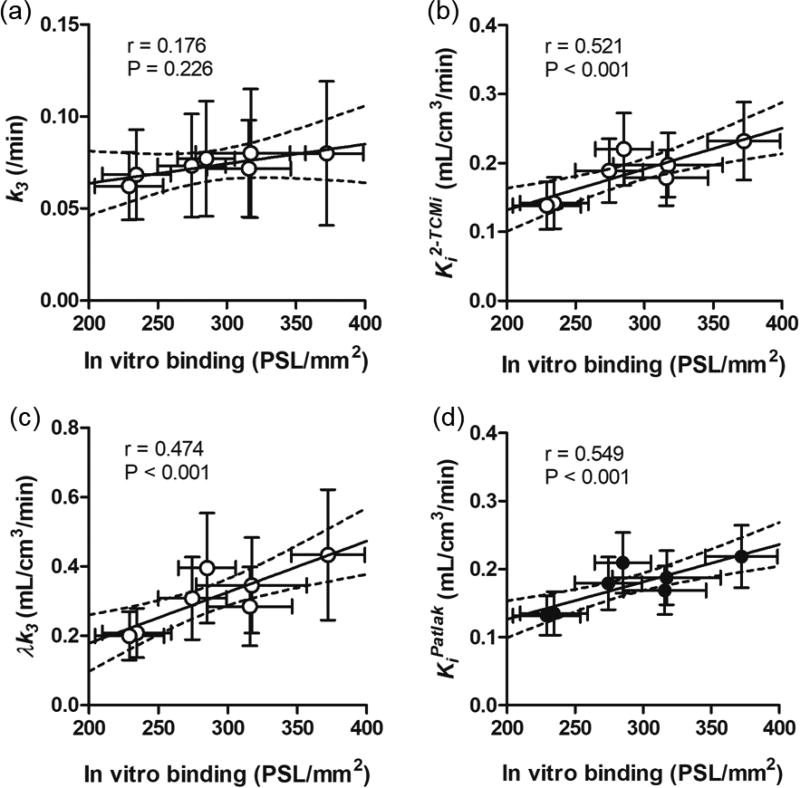
Figure 5 shows scatter plots of the kinetic parameters (k3, Ki2-TCMi, λk3, and KiPatlak) and the in vitro binding of the autoradiograms using [11C]SAR127303. Of the parameters based on 2-TCMi, Ki2-TCMi and λk3 indicated relatively high correlations with in vitro binding of [11C]SAR127303, with correlation coefficients (r) of 0.521 (P < 0.001) and 0.474 (P < 0.001) respectively. Conversely, the direct parameter k3 reflecting MAGL concentration exhibited a poor correlation with in vitro binding of [11C]SAR127303, with an r of 0.176 (P = 0.226). However, the KiPatlak values acquired from the linear regression indicated the highest correlation (r = 0.549, P < 0.001) with in vitro binding.
Figure 5.
Correlations between kinetic parameters from the PET studies and in vitro binding on autoradiograms. (a): k3 vs. in vitro binding; (b): Ki2-TCMi vs. in vitro binding; (c): λk3 vs. in vitro binding; (d): KiPatlak vs. in vitro binding. The regression lines in each graph show the 95% confidence intervals (dotted lines). Respective correlation coefficients (r) and P values are shown adjacent to each scatter plot.
Parametric PET images based on net uptake value
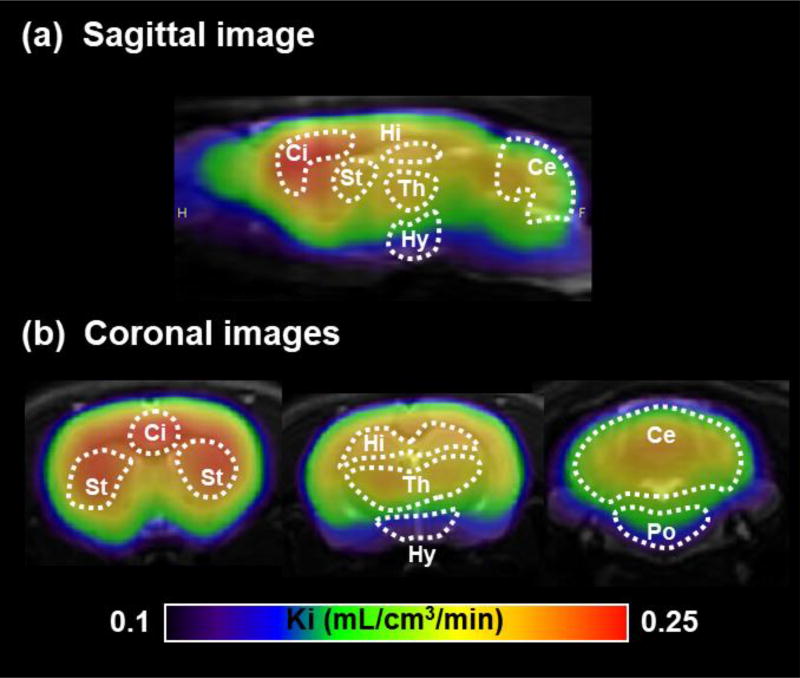
Figure 6 shows representative parametric PET/MRI images based on KiPatlak. In the Ki-based images, the strongest signal was observed in the cingulate cortex. Relatively strong signals were also detected in the striatum, hippocampus, thalamus, and cerebellum, while low signals were found in the hypothalamus and pons. This distribution pattern of Ki-based signals corresponded strongly with the distribution pattern of in vitro binding of [11C]SAR127303, which suggests that Ki-based parametric images could reflect the availability of MAGL for [11C]SAR127303.
Figure 6.
Averaged (n = 7) parametric PET/MRI images based on Ki value. The sagittal slice (a) was located 1 mm lateral to the bregma and coronal slices (b) were located 0, −3, and −12 mm from the bregma. Ci, cingulate cortex; St, striatum; Hi, hippocampus; Th, thalamus; Hy, hypothalamus; Ce, cerebellum; Po, pons.
Discussion
The current study presents the first quantitative visualization of net uptake value for regional MAGL in the rat brain using PET with [11C]SAR127303.
SAR127303 is known as a ‘suicide’ enzyme inhibitor that covalently labels the enzyme MAGL; it was designed to produce irreversible acylation of serine hydrolase (Figure 1a) (Griebel et al., 2015). It was anticipated that the compartment model should include an irreversible trapping compartment (Figure 1b). Although the goodness-of-fit (AIC and MSC) of 2-TCM (the compartment model for a reversible ligand) was superior to that of 2-TCMi (data not shown), the rate constant k4 in 2-TCM was very small (< 0.01/min) with poor identifiability (> 25%COV). The best result of the goodness-of-fit was determined in 3-TCMi isolating free and nonspecific binding (data not shown). However, identifiability of individual rate constants in 3-TCMi was very low due to more complex kinetic model. Therefore, we consider that 2-TCMi would be a reasonable compartment model for quantitative PET analysis using [11C]SAR127303.
In general, the blood flow or transport rate across the plasma membrane may limit the net amount of an irreversible radioligand of tracer uptake. When the irreversible trapping rate is too high (k3 >> k2), the limitation effect depends on the delivery of tracer to tissue (K1), and therefore, sensitivity to changes in net uptake value may be poor. Previous reports have suggested that the range of the suitable ratios for k3/k2 is within a single order of magnitude, with the optimal ratio for determining k3 typically to be between 0.1 and 1.0 (Ohya et al., 2011; Koeppe et al., 1999). Values of k3 that were either greater than k2 or less than 0.05 times k2 have provided poor results (Koeppe et al., 1991, 1996). In our study, the ratios of k3/k2 in each brain region were 0.3–0.7, which were adequate for determination of k3. The irreversible compartment model (2-TCMi) provides three parameters based on k3 to measure changes in MAGL concentration (Bmax). In this study, direct k3, Ki2-TCMi, and λk3 were clearly identifiable (Table 1). Additionally, the ranked-order values of these parameters strongly corresponded with the order of radioactive accumulation on the in vitro autoradiographs, which in turn correlated with the previous immunoactive distribution of MAGL (Figure 4). However, the direct k3 values were relatively low (< 0.1 /min) and showed high individual variations, despite the high identifiability. Thereby, the correlation between the direct k3 values and in vitro binding of [11C]SAR127303 was poor (Figure 5a). These results suggested that direct k3 as absolute value would be unreasonable parameter due to too high sensitivity to individual variations of MAGL concentrations, which was also supported by high correlation (r = 0.553, P < 0.001) of the relative k3 values (the ratio to k3 of whole brain) with in vitro binding of [11C]SAR127303 (see in Supplementary Figure S3). In contrast, Ki and λk3 values including K1 and k2 could more stably estimate MAGL concentration in this study, because effects of individual variations in kinetic parameters would be kept to the minimum (Figures 5b and 5c).
On the basis of equation 4, the Ki values show a nonlinear response to the k3/k2 ratios. When the ratio of k3/k2 is over 10, the Ki value is close to the K1 value. To the contrary, when the k3/k2 ratio is less than 0.1, the Ki value is close to zero (Supplementary Figure S4a). However, the λk3 value depends linearly on the ratio of k3/k2, because it contains the ratio of K1/k2, and also the ratio of the correlated parameters k2 and k3 (Supplementary Figure S4a). Thus, the λk3 value has been proposed as a parameter for quantification of irreversible radioligands (Dewey et al., 1991; Logan et al., 1991; Rusjan et al., 2013). However, in this study, the correlation of λk3 values with in vitro binding of [11C]SAR127303 was inferior to that of the Ki2-TCMi values (Figure 5). This may have been caused by high variation in the k3/k2 ratio, because the variation in λk3 is larger than that of Ki (Supplementary Figure S4). Therefore, in the case of [11C]SAR127303, the Ki value is a superior index to the λk3 value for estimating MAGL concentration.
Ki values were also acquired by Patlak plot. In the present study, KiPatlak values correlated highly with Ki2-TCMi values, while presenting a small underestimation (< 10%). In general, violation of the assumptions of the Patlak plot could induce a large underestimation of the Ki value. In the case of [11C]SAR127303, a plateau in the ratio of the non-displaceable compartment to the plasma was quickly achieved (t* ≤ 10 min; Figure 3b). Therefore, the KiPatlak values in this study were acquired using a simpler method with higher identifiability than the Ki2-TCMi value (Table 1). Moreover, the parametric PET images based on KiPatlak values allowed successful visualization of the regional net uptake value corresponding with the in vitro binding of [11C]SAR127303 with MAGL (Figure 6). Thus, this in vivo quantitative technique for visualizing net uptake value for MAGL concentration using [11C]SAR127303 PET should facilitate the further understanding of several disorders involving MAGL.
In general, the Patlak plot is widely used to estimate the available dose of PET tracer, such as [18F]FDG, [11C]methionine, and [18F]FET, in the tumor. Moreover, several reports using these PET tracers showed high correlation between the KiPatlak value and SUV value (Lindholm et al., 1993; Bolcaen et al., 2016). Similarly, the KiPatlak value and SUV value in this study showed high correlation (r > 0.9) in an individual rat. However, the absolute value of SUV showed no relationship with KiPatlak value (Supplementary Figure S5a). These results suggested that SUV value not reflect net uptake value of [11C]SAR127303, but displayed the order of regional concentrations of MAGL. The ratio of SUV (SUVR) showed relatively high correlation (r = 0.567) to KiPatlak value (Supplementary Figure S5b), which might indicate potential usefulness as noninvasive quantitative index for MAGL concentrations.
In conclusion, we demonstrated quantification of net uptake value for brain MAGL concentration using PET with [11C]SAR127303. The kinetic parameters (k3, Ki, and λk3) were obtained from an irreversible compartment model with high identifiability, and corresponded with the in vitro distribution of MAGL in the rat brain. Of these parameters, the Ki value showed the highest association with the in vitro binding of [11C]SAR127303. In addition, the Ki value based on a simple method (Patlak plot) exhibited a small underestimation but superior identifiability when compared with the Ki value based on 2-TCMi. By using the KiPatlak value, we succeeded in achieving the first demonstration of in vivo mapping for MAGL concentrations in the healthy rat brain using PET.
Supplementary Material
Acknowledgments
We thank the staff of the National Institute of Radiological Sciences for their support with cyclotron operation, radioisotope production, radiosynthesis, and animal experiments. We thank Karl Embleton, PhD, from Edanz Group (www.edanzediting.com/ac) for editing a draft of this manuscript.
Funding
This study was supported by the Grants-in-Aid for Scientific Research [Basic Research C: 17K10461] from the Ministry of Education, Culture, Sports, Science and Technology of the Japanese Government.
Footnotes
Declaration of conflicting interests
The author(s) declare no potential conflicts of interest with respect to the research, authorship, and/or publication of this article.
Supplementary material for this paper can be found at https://doi.org/10.1016/j.neuroimage.2018.05.015.
References
- 1.Akaike H. A new look at the statistical model identification. IEEE. Trans. Auto. Cont. 1974;19:8. [Google Scholar]
- 2.Ahamad M, Attili B, van Veghel D, Ooms M, Berben P, Celen S, Koole M, Declercq L, Savinainen JR, Laitinen JT, Verbruggen A, Bormans G. Synthesis and preclinical evaluation of [11C]MA-PB-1 for in vivo imaging of brain monoacylglycerol lipase (MAGL) Eur. J. Med. Chem. 2017;136:104–113. doi: 10.1016/j.ejmech.2017.04.066. [DOI] [PubMed] [Google Scholar]
- 3.Bolcaen J, Lybaert K, Moerman L, Descamps B, Deblaere K, Boterberg T, Kalala JP, Van den Broecke C, De Vos F, Vanhove C, Goethals I. Kinetic modeling and graphical analysis of 18F-fluoromethylcholine (FCho), 18F-fluoroethyltyrosine (FET) and 18F-fluorodeoxyglucose (FDG) PET for the fiscrimination between high-grade glioma and radiation necrosis in rats., 2016. PLoS One. 11(8):e0161845. doi: 10.1371/journal.pone.0161845. [DOI] [PMC free article] [PubMed] [Google Scholar]
- 4.Cheng R, Mori W, Ma L, Alhouayek M, Hatori A, Zhang Y, Ogasawara D, Yuan G, Chen Z, Zhang X, Shi H, Yamasaki T, Xie L, Kumata K, Fujinaga M, Nagai Y, Minamimoto T, Svensson M, Wang L, Du Y, Ondrechen MJ, Vasdev N, Cravatt BF, Fowler C, Zhang MR, Liang SH. In vitro and in vivo evaluation of 11C-labeled azetidine-carboxylates for imaging monoacylglycerol lipase by PET imaging studies. J. Med. Chem. 2018 doi: 10.1021/acs.jmedchem.7b01400. [DOI] [PMC free article] [PubMed] [Google Scholar]
- 5.Dewey SL, Logan J, Wolf AP, Brodie JD, Angrist B, Fowler JS, Volkow ND. Amphetamine induced decreases in (18F)-N-methylspiroperidol binding in the baboon brain using positron emission tomography (PET) Synapse. 1991;7:324–327. doi: 10.1002/syn.890070409. [DOI] [PubMed] [Google Scholar]
- 6.Di Marzo V. The endocannabinoid system: Its general strategy of action, tools for its pharmacological manipulation and potential therapeutic exploitation. Pharmacol. Res. 2009;60:77–84. doi: 10.1016/j.phrs.2009.02.010. [DOI] [PubMed] [Google Scholar]
- 7.Dinh TP, Carpenter D, Leslie FM, Freund TF, Katona I, Sensi SL, Kathuria S, Piomelli D. Brain monoglyceride lipase participating in endocannabinoid inactivation. Proc. Natl. Acad. Sci. U S A. 2002;99:10819–10824. doi: 10.1073/pnas.152334899. [DOI] [PMC free article] [PubMed] [Google Scholar]
- 8.Griebel G, Pichat P, Beeske S, Leroy T, Redon N, Jacquet A, Françon D, Bert L, Even L, Lopez-Grancha M, Tolstykh T, Sun F, Yu Q, Brittain S, Arlt H, He T, Zhang B, Wiederschain D, Bertrand T, Houtmann J, Rak A, Vallée F, Michot N, Augé F, Menet V, Bergis OE, George P, Avenet P, Mikol V, Didier M, Escoubet J. Selective blockade of the hydrolysis of the endocannabinoid 2-arachidonoylglycerol impairs learning and memory performance while producing antinociceptive activity in rodents. Sci. Rep. 2015;5:7642. doi: 10.1038/srep07642. [DOI] [PMC free article] [PubMed] [Google Scholar]
- 9.Handbook MS. rev., 1995. 7EEF. MicroMath, Inc; Salt Lake City: p. 467. [Google Scholar]
- 10.Hicks JW, Parkes J, Tong JC, Houle S, Vasdev N, Wilson AA. Radiosynthesis and ex vivo evaluation of [C-11-carbonyl]carbamate- and urea-based monoacylglycerol lipase inhibitors. Nucl. Med. Biol. 2014;41:688–694. doi: 10.1016/j.nucmedbio.2014.05.001. [DOI] [PMC free article] [PubMed] [Google Scholar]
- 11.Koeppe RA, Frey KA, Snyder SE, Meyer P, Kilbourn MR, Kuhl DE. Kinetic modeling of N-[11C]methylpiperidin-4-yl propionate: alternatives for analysis of an irreversible positron emission tomography trace for measurement of acetylcholinesterase activity in human brain. J. Cereb. Blood. Flow. Metab. 1999;19:1150–1163. doi: 10.1097/00004647-199910000-00012. [DOI] [PubMed] [Google Scholar]
- 12.Koeppe RA, Frey KA, Vander Borght TM, Karlamangla A, Jewett DM, Lee LC, Kilbourn MR, Kuhl DE. Kinetic evaluation of [11C]dihydrotetrabenazine by dynamic PET: measurement of vesicular monoamine transporter. J. Cereb. Blood. Flow. Metab. 1996;16:1288–1299. doi: 10.1097/00004647-199611000-00025. [DOI] [PubMed] [Google Scholar]
- 13.Koeppe RA, Holthoff VA, Frey KA, Kilbourn MR, Kuhl DE. Compartmental analysis of [11C]flumazenil kinetics for the estimation of ligand transport rate and receptor distribution using positron emission tomography. J. Cereb. Blood. Flow. Metab. 1991;11:735–744. doi: 10.1038/jcbfm.1991.130. [DOI] [PubMed] [Google Scholar]
- 14.Labar G, Wouters J, Lambert DM. A Review on the Monoacylglycerol Lipase: At the Interface Between Fat and Endocannabinoid Signalling. Curr. Med. Chem. 2010;17:2588–2607. doi: 10.2174/092986710791859414. [DOI] [PubMed] [Google Scholar]
- 15.Lindholm P, Leskinen-Kallio S, Minn H, Bergman J, Haaparanta M, Lehikoinen P, Någren K, Ruotsalainen U, Teräs M, Joensuu H. Comparison of fluorine-18-fluorodeoxyglucose and carbon-11-methionine in head and neck cancer. J. Nucl. Med. 1993;34:1711–1716. [PubMed] [Google Scholar]
- 16.Logan J, Dewey SL, Wolf AP, Fowler JS, Brodie JD, Angrist B, Volkow ND, Gatley SJ. Effects of endogenous dopamine on measures of [18F]N-methylspiroperidol binding in the basal ganglia: comparison of simulations and experimental results from PET studies in baboons. Synapse. 1991;9:195–207. doi: 10.1002/syn.890090306. [DOI] [PubMed] [Google Scholar]
- 17.Ohya T, Okamura T, Nagai Y, Fukushi K, Irie T, Suhara T, Zhang MR, Fukumura T, Kikuchi T. Effect of radiolabeled metabolite elimination from the brain on the accuracy of cerebral enzyme activity estimation using positron emission tomography with substrate tracers. Neuroimage. 2011;56:1105–1110. doi: 10.1016/j.neuroimage.2011.02.030. [DOI] [PubMed] [Google Scholar]
- 18.Patlak CS, Blasberg RG, Fenstermacher JD. Graphical evaluation of blood-to-brain transfer constants from multiple-time uptake data. J. Cereb. Blood. Flow. Metab. 1983;3:1–7. doi: 10.1038/jcbfm.1983.1. [DOI] [PubMed] [Google Scholar]
- 19.Rusjan PM, Wilson AA, Mizrahi R, Boileau I, Chavez SE, Lobaugh NJ, Kish SJ, Houle S, Tong J. Mapping human brain fatty acid amide hydrolase activity with PET. J. Cereb. Blood. Flow. Metab. 2013;33:407–414. doi: 10.1038/jcbfm.2012.180. [DOI] [PMC free article] [PubMed] [Google Scholar]
- 20.Takei M, Kida T, Suzuki K. Sensitive measurement of positron emitters eluted from HPLC. Appl. Radiat. Isot. 2001;55:229–234. doi: 10.1016/s0969-8043(00)00392-4. [DOI] [PubMed] [Google Scholar]
- 21.Wang C, Placzek MS, Van de Bittner GC, Schroeder FA, Hooker JM. A novel radiotracer for imaging monoacylglycerol lipase in the brain using positron emission tomography. ACS. Chem. Neurosci. 2016a;7:484–489. doi: 10.1021/acschemneuro.5b00293. [DOI] [PubMed] [Google Scholar]
- 22.Wang L, Mori W, Cheng R, Yui JJ, Hatori A, Ma LL, Zhang Y, Rotstein BH, Fujinaga M, Shimoda Y, Yamasaki T, Xie L, Nagai Y, Minamimoto T, Higuchi M, Vasdev N, Zhang MR, Liang SH. Synthesis and preclinical evaluation of sulfonamido-based [C-11-carbonylcarbamates and ureas for imaging monoacylglycerol lipase. Theranostics. 2016b;6:1145–1159. doi: 10.7150/thno.15257. [DOI] [PMC free article] [PubMed] [Google Scholar]
- 23.Woodhams SG, Chapman V, Finn DP, Hohmann AG, Neugebauer V. The cannabinoid system and pain. Neuropharmacology. 2017;124:105–120. doi: 10.1016/j.neuropharm.2017.06.015. [DOI] [PMC free article] [PubMed] [Google Scholar]
- 24.Xu JY, Chen C. Endocannabinoids in synaptic plasticity and neuroprotection. Neuroscientist. 2015;21:152–168. doi: 10.1177/1073858414524632. [DOI] [PMC free article] [PubMed] [Google Scholar]
- 25.Yamasaki T, Fujinaga M, Kawamura K, Furutsuka K, Nengaki N, Shimoda Y, Shiomi S, Takei M, Hashimoto H, Yui J, Wakizaka H, Hatori A, Xie L, Kumata K, Zhang MR. Dynamic changes in striatal mGluR1 but not mGluR5 during pathological progression of Parkinson's disease in human alpha-synuclein A53T transgenic rats: a multi-PET imaging study. J. Neurosci. 2016;36:375–384. doi: 10.1523/JNEUROSCI.2289-15.2016. [DOI] [PMC free article] [PubMed] [Google Scholar]
Associated Data
This section collects any data citations, data availability statements, or supplementary materials included in this article.


