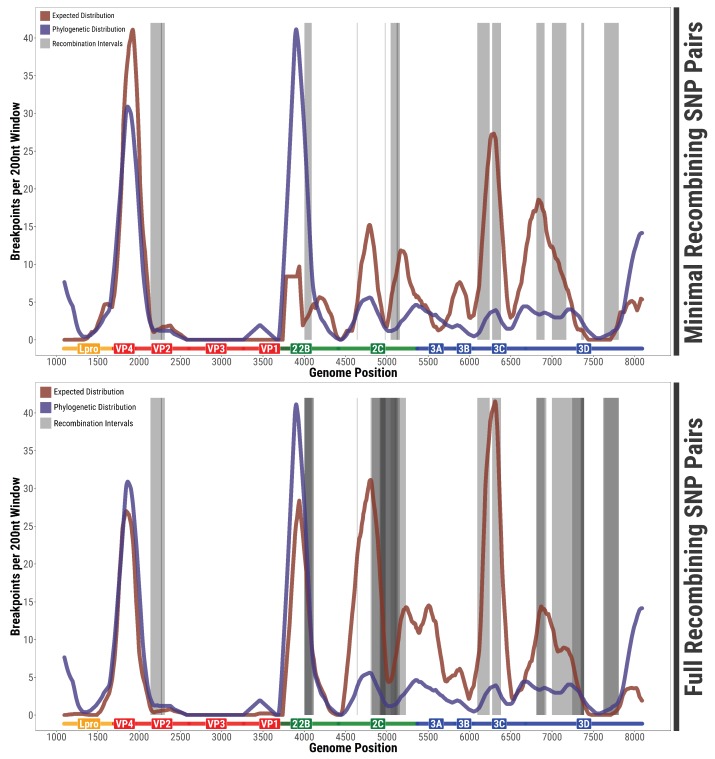
Figure 4.
Comparison of within-host and phylogenetic recombination signal: (Top) Location of intervals between minimal recombining SNP pairs (grey) and expected distribution of recombination events corrected for the SNP distribution (red) along the FMDV genome. The expected distribution is based on the number of phylogenetic breakpoints inferred by RDP4 over a 200-bp window (blue) corrected for the probability of detecting a recombination events depending on the genomic location. (Bottom) Same plot for all recombining SNP pairs and the corresponding expected distribution.

