Abstract
While in-vivo studies clearly demonstrate that supra-annular Valve-in-Valve (ViV) implantation provides the highest probability for optimal post-ViV pressure gradients (PG), there is still no physical insight into explaining anomalies where some supra-annular ViV implantations yield high pressure gradients while some sub-annular implantations yield low pressure gradients. The aim of this study is to explain how severe tissue ingrowth and calcification (TIC) in a surgical aortic valve (SAV) can be one physical mechanism leading to anomalous ViV performance characteristic. The ViV hemodynamic performance was evaluated as a function of axial positioning −9.8, −6.2, 0, and +6mm in SAVs with and without TIC. Effective orifice area (EOA) and PG were compared. Leaflet high-speed imaging and particle image velocimetry were performed to elucidate flutter and forward jet characteristics. ViV without TIC showed significantly lower PG and greater EOA (p<0.01). EOA and PG improve with supra-annular deployment (p<0.01) while for ViV with TIC, EOA and PG worsen as the deployment varies from −9.8mm to 0mm (p<0.01) only to recover at +6mm (p<0.01). Separated jet flow at the TIC site, and consequently induced stronger TAV leaflet fluttering highlight the dynamic compromising nature of TIC on jet width and performance reduction. We conclude that the inflow TIC greatly influence ViV performance due to dynamic effects that results in a real anomalous performance characteristic different than that seen in most ViV in-vivo. Further in-vivo studies are needed to evaluate ViV outcomes in the presence of severe TIC in SAVs.
Keywords: Valve-in-valve, transcatheter aortic valve, bioprosthetic surgical aortic valve, ViV, tissue ingrowth, Calcification
Introduction
Bioprosthetic heart valves (BPV) degenerate within 10–20 years approximately which necessitates a replacement surgery8, 13, 26, 28. Redo cardiac surgeries for degenerated BPVs are often associated with severe complications particularly for elderly patients28. Valve-in-valve (ViV) represents a relatively new therapy that substitutes the redo surgeries19. It consists of implanting a transcatheter aortic valve (TAV) in the degenerated bioprosthetic surgical aortic valve (SAV). Unfortunately, the procedure is frequently accompanied by high pressure gradients (PG) and low effective orifice areas (EOA) as clinical trials and in-vitro data show11, 23.
In an in-vitro study done by Azadani et al1, the mean gradient obtained by implanting a TAV was 9.2±6.3mmHg in a 23mm Carpentier-Edwards Perimount (Edwards Lifesciences, Irvine, CA). A similar in-vitro study by Walther et al27 showed that post-deployment pressure gradients across the Sapien (Edwards Lifesciences, Irvine, CA) and cloth TAV (Model 9000MIS) ViV ranged from 2.8±0.3 to 8.7±0.5mmHg after deploying a 23 and a 26mm Edwards SAPIEN and cloth TAV in Carpentier-Edwards Perimount (2700 or 2800) and Magna bioprostheses of 23mm and 25mm sizes (Edwards Lifesciences, Irvine, CA). On the other hand, clinical data from the global Valve-in-Valve International Data Registry (VIVID) show that mean gradients higher than 20mmHg were common after ViV procedures depending on the axial deployment of the TAV with respect to the SAV, at the time of the ViV and after one year. Elevated post-ViV pressure gradients exceeding 20mmHg with Medtronic Corevalve or Evolut (Medtronic Inc, Minneapolis, MN) at these time points were sometimes occuring9, 10, 25.
Recent in-vivo and in-vitro studies by Simonato et al have highlighted the importance of axial positioning of the TAV with respect to the SAV in ViV in the context of minimizing the chance of elevated pressure gradients23, 24. The occurrence of elevated post-ViV gradients was significantly lower in the high axial position implantation group. This finding was also confirmed by studies by other in-vitro studies2, 15, 17. For sub-annular depth intervals ranging between −10mm and −5mm with a Medtronic Evolut TAV ViV, the occurrence rates for elevated mean gradients were found to be 33.7% compared to 15% for supra-annular deployment ranges24.
Despite having lower incidence of high average pressure gradients for supra-annular axial positions, in-vivo data still show that a few cases of high implants are accompanied by high gradients and some cases of low implants are accompanied by low or acceptable gradients9, 10, 25. However, in-vitro data composed of ViV in pristine surgical valves, despite their diversity, showed a consistent monotonic decrease in pressure gradients with supra-annular axial deployments without any exception. Multi-variate analysis in the in-vivo database clearly showed no correlation with respect to size of the valve or other parameters24.
These observations yield to shifting the attention from the actual ViV mechanism to a part overlooked by previous in-vitro studies that is the potential relevance of the presence of tissue ingrowth and calcification (TIC) on the SAV itself. This is because in-vitro assessment performed to date used bioprosthetic valves without TIC. When TIC develops on bioprosthetic valves, calcific deposits are often located within the leaflet tissue specifically in areas of high leaflet stress like the commissural and attachment points14, 21. In addition to calcification, pannus formation is another main cause of SAV degeneration14, 21. Tissue growth is well known to greatly alter the inflow tract of the valve in addition to the leaflets’ quality which may influence the hemodynamics associated 5, 22, 29. Pannus or tissue overgrowth can compromise the actual aortic valve area by more than 50%. In another study, the formation of pannus increased the peak pressure gradients up to 53.1±38.4 mmHg6 The objective of this study is to examine how severe tissue ingrowth and calcification in a surgical aortic valve can be one physical mechanism leading to anomalous valve-in-valve performance characteristic, with non-monotonic dependence of pressure gradient with respect to implant height.
Methodology
In order to assess the effects of the SAV’s severe TIC on transcatheter ViV hemodynamic performance, we performed in-vitro studies that involved deploying a TAV in different axial positions with respect to a SAV with and without severe TIC.
Valve selection and deployment
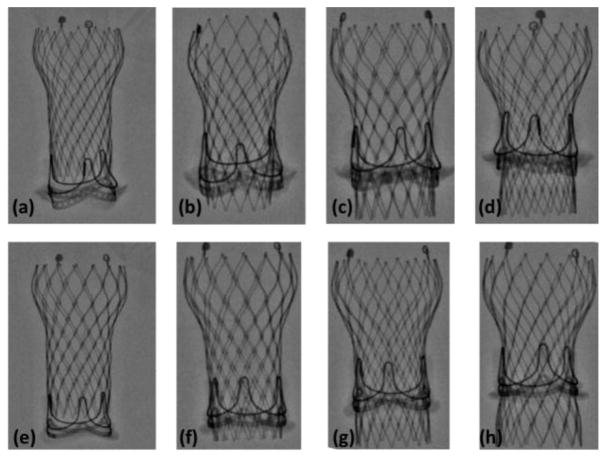
A 23mm Medtronic Evolut TAV was deployed in a severely calcified 23mm Carpentier-Edwards Perimount surgical aortic valve (SAV) explanted from a patient who underwent a redo surgery (Fig. 1). Calcification was distributed on the leaflets of the SAV from the aortic and the ventricular sides mainly. The total volume of calcification was measured to be 0.1224cm3. The maximum protrusion of calcification chunks into the lumen was measured to be 0.2cm and the lowest 0.04cm. Pannus was distributed on the ventricular side and the lateral sides of the SAV. The total volume of pannus and inflow tissue ingrowth was measured to be 1.94cm3. The maximum protrusion of the TIC into the lumen was measured to be 0.53cm and the lowest was 0.06cm. In parallel, the same 23mm Medtronic Evolut TAV was also implanted in a 23mm Carpentier-Edwards Perimount. The orientation of both TAVs with respect to the SAVs is the same with the commissures aligned. Table 1 shows the hemodynamic data pre-ViV of the SAVs with and without TIC. The Evolut TAV size was chosen based on the instructions of the ViV app that recommend the implantation of a 23mm Medtronic Evolut in a 23mm Carpentier-Edwards Perimount3, 4. In this study, the 23mm Evolut was implanted in 4 different axial positions with respect to both SAVs: −9.8, −6.2, 0 and +6mm which spans the full possible clinical range for implantations and is consistent with previous in-vitro studies18, 23. The negative axial positions denote a sub-annular deployment and the positive, a supra-annular deployment relative to the lowest visible margin of SAV stent. Fig. 2 shows the different axial positions as seen by x-ray imaging.
Figure 1.
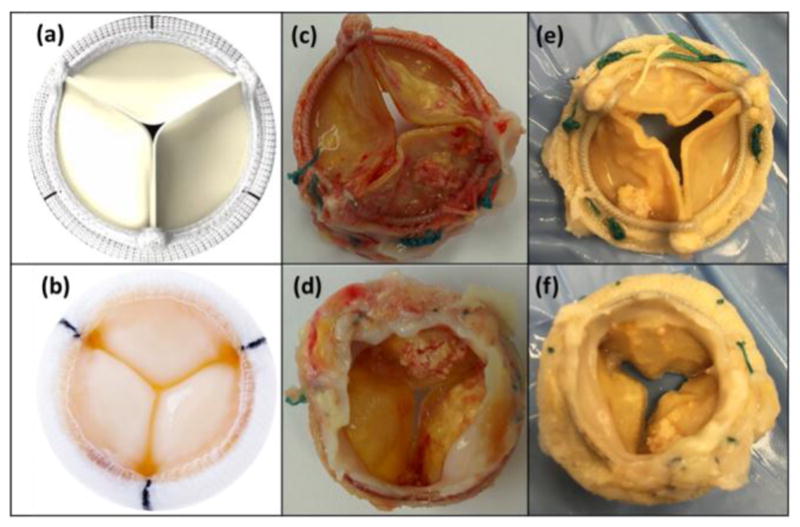
SAV without TIC from (a) the aortic side and (b) the ventricular side and SAV with TIC from (c,e) the aortic side (d,f) and the ventricular side.
Table 1.
Summary of pre-ViV hemodynamic data of the SAV with TIC and SAV without TIC.
| SAV with TIC (23mm) | SAV without TIC (23mm) | |
|---|---|---|
| Peak Gradient (mmHg) | 78.23±1.97 | 18.09±0.27 |
| Mean Gradient (mmHg) | 33.41±0.51 | 5.29±0.10 |
| Cardiac Output (L/min) | 5.0 | 5.0 |
| EOA (cm2) | 0.90±0.03 | 1.75±0.08 |
EOA denotes Effective Orifice Area; SAV denotes Surgical Aortic Valve; TIC denotes Tissue Ingrowth and Calcification and ViV denotes Valve-in-Valve.
Figure 2.
Schematic representation of axial deployment depths as seen by x-ray. Top row represents the (a) +6mm, (b) 0mm, (c) −6.2mm and (d) −9.8mm of the ViV with TIC. Bottom row represents the (e) +6mm, (f) 0mm, (g) −6.2mm and (h) −9.8mm of the ViV without.
Hemodynamic assessment
PGs and EOAs were evaluated under pulsatile flow conditions ensured by a left heart simulator yielding physiological flow and pressure curves12, 16. The desired outputs can be summarized as establishing a systolic to diastolic pressure of 120/80mmHg with a mean arterial pressure of 100mmHg, a 1 beat per second heart rate, a systolic duration of 33% and a root mean square aortic valve flow maintained at 323.2 ml/s to yield flow independent comparison between PGs. The working fluid in this study is a mixture of water-glycerine (99% pure glycerine) with a density of 1080 Kg/m3 and a kinematic viscosity of 3.5 cSt similar to blood properties. Sixty consecutive cardiac cycles of aortic pressure, ventricular pressure and flow rate data were recorded at a sampling rate of 100 Hz. The experimental setup is described in full details in Moore et al, Hatoum et al and Forleo et al 12, 16, 20. Tables 2a and 2b showed no significant geometric differences in the expansion of the CoreValve between our experiments temperature conditions and in-vivo conditions.
Table 2a.
Inflow orifice areas of the CoreValve defined in Fig. 3a at experimental room temperature and at 37°C.
| Axial Positions (mm) | IOA (cm2) | STD | ||
|---|---|---|---|---|
| Calcified SAV ViV | 37°C | +6 | 3.3 | 0.15 |
| 0 | 2.2 | 0.12 | ||
| −6.2 | 1.6 | 0.02 | ||
| −9.8 | 1.4 | 0.06 | ||
| Room Temperature | +6 | 3.3 | 0.11 | |
| 0 | 2.2 | 0.07 | ||
| −6.2 | 1.6 | 0.09 | ||
| −9.8 | 1.5 | 0.08 | ||
| Non-Calcified SAV ViV | 37°C | +6 | 3.2 | 0.09 |
| 0 | 2.0 | 0.07 | ||
| −6.2 | 1.7 | 0.08 | ||
| −9.8 | 1.6 | 0.04 | ||
| Room Temperature | +6 | 3.1 | 0.22 | |
| 0 | 2.0 | 0.09 | ||
| −6.2 | 1.7 | 0.06 | ||
| −9.8 | 1.5 | 0.08 |
Table 2b.
Triangular areas joining the commissures of the CoreValve and defined in Fig. 3b at experimental room temperature and at 37°C.
| Axial Positions (mm) | Triangular Area (cm2) | STD | ||
|---|---|---|---|---|
| Calcified SAV ViV | 37°C | +6 | 2.5 | 0.02 |
| 0 | 2.3 | 0.04 | ||
| −6.2 | 2.2 | 0.02 | ||
| −9.8 | 2.0 | 0.02 | ||
| Room Temperature | +6 | 2.5 | 0.03 | |
| 0 | 2.3 | 0.03 | ||
| −6.2 | 2.3 | 0.04 | ||
| −9.8 | 2.0 | 0.01 | ||
| Non-Calcified SAV ViV Room | 37°C | +6 | 2.4 | 0.04 |
| 0 | 2.2 | 0.04 | ||
| −6.2 | 2.2 | 0.04 | ||
| −9.8 | 2.0 | 0.02 | ||
| Temperature | +6 | 2.4 | 0.03 | |
| 0 | 2.3 | 0.02 | ||
| −6.2 | 2.2 | 0.01 | ||
| −9.8 | 2.1 | 0.03 |
The mean transvalvular pressure gradient (PG) is defined as the average of positive pressure difference between the ventricular and aortic pressure curves during forward flow. To assess residual stenosis and the improvement that the ViV provides, the effective orifice area (EOA) is an important parameter to evaluate. EOA was computed using the Gorlin’s equation:
| (1) |
Where Q represents the root mean square aortic valve flow over the same averaging interval of the PG. Vorticity dynamics were also evaluated in this study. Vorticity is the curl of the velocity field and therefore captures rotational components of the blood flow shearing7, 20, 30. Regions of high vorticity along the axis perpendicular to the plane indicate both in-plane shear and rotation of the fluid particles and can be used to visualize the forward jet boundaries in order to evaluate jet width. Out-of-plane vorticity in the z direction was computed using the following equation:
| (2) |
Where ωz is the vorticity component with units of s−1; Vx and Vy are the x and y components of the velocity vector with units of m/s. The x and y directions are defined in Fig. 5 with the z direction being out of measurement plane. Six repetitions were performed to calculate the ensemble average velocity vectors and velocity contours.
Figure 5.
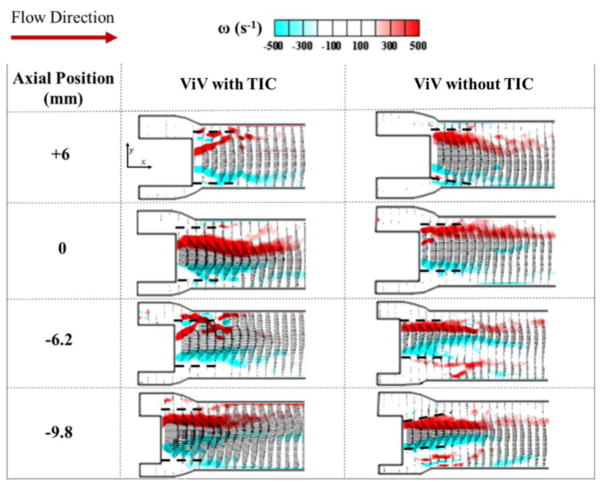
Ensemble averaged velocity vectors and vorticity contours at peak systole for ViV with and without TIC. Dotted lines indicate the position of the transcatheter aortic valve (TAV) leaflet relative to the flow.
High-speed imaging
Videos of the ViV en-face views were taken throughout the cardiac cycle. The images were taken for 1 cardiac cycle at a frequency of 1000 Hz by a Photron Fastcam SA3 high-speed video camera (Photron, San Diego, CA, USA) and a high-speed controller (HSC) (LaVision, Ypsilanti, MI). Refraction was corrected using a calibration in DaVis particle image velocimetry software (DaVis 7.2, LaVision Germany). Leaflet oscillations during systole were manually counted and converted to frequency (i.e. number of oscillations per second).
Particle Image Velocimetry (PIV)
The flow was seeded with fluorescent PMMA-Rhodamine B particles with diameters ranging from 1 to 20 μm. The dynamic models of the ViV were assessed using high resolution particle image velocimetry (PIV) which involves illuminating a region of interest in the flow domain using a laser sheet created by Nd:YLF single cavity diode pumped solid state, high repetition rate laser coupled with external spherical and cylindrical lenses. The spatial and temporal resolutions were 0.07mm/pixel and 1000 Hz respectively. Vectors were calculated using adaptive cross-correlation algorithms described in our previous studies16, 20.
ViV inflow-outflow assessment
The inflow areas (IOA) after ViV corresponding to different axial positions were also measured. A sample image is shown as an inset in Fig. 3a.
Figure 3.
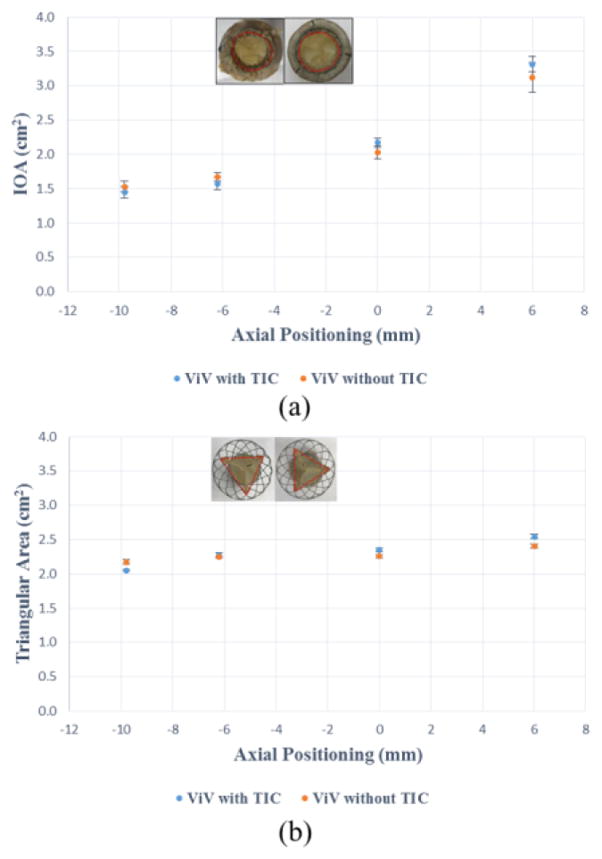
(a) Inflow orifice areas (IOA) for different axial positions (b) Triangular outflow areas for different axial positions. The error bars indicate the standard deviation.
To assess any constriction of the outflow section of the Medtronic Evolut TAV, the area of the triangle defined by the three leaflet commissural attachment points to the stent as vertices (see inset of Fig. 3b) was measured and compared for different axial ViV positions.
Results
Hemodynamics
PGs are plotted versus the different axial positions as shown in Fig. 4a. The PG values for the ViV without TIC were lower than those with TIC except for the −9.8mm axial position however the difference was not clinically significant (6.2mmHg). With the SAV without TIC, the supra-annular axial position (+6mm) showed the lowest pressure gradient 12.69±2.19mmHg compared to the sub-annular axial deployment (−9.8mm) 30.56±1.32 mmHg (p<0.01). The difference in PG between +6mm and 0mm was not significant as the values were 12.7±2.2mmHg and 15.5±1.5 mmHg respectively (p=0.14). This monotonic trend is not observed in the ViV with TIC cases. The highest pressure gradient was found to be at the 0mm axial position (42.0±1.7 mmHg). There was no significant difference between PG between the sub-annular deployments and the supra-annular. PG was found to be 28.0±1.0mmHg at −6.2mm, 24.3±1.07mmHg at −9.8mm versus 30.2±2.0mmHg at +6mm. The difference in values when TAV is at −6.2mm and +6mm is not significant (p=0.15). The EOAs are plotted versus the different axial positions as shown in Fig. 4b. ViV without TIC showed greater EOA values than those with TIC for all positions except corresponding to −9.8mm where EOA was 12.4% higher for the case with TIC (1.27±0.03 cm2 versus 1.13±0.02 cm2, p<0.01). The most significant difference between both ViV cases was among the supra-annular axial positions where the EOAs were 1.13±0.04 cm2 versus 1.77±0.15 cm2 at +6mm (p<0.01) and 0.97±0.02 cm2 versus 1.59±0.08 cm2 at 0mm position (p<0.01) for SAVs without and with TIC respectively. The pattern of the 2 curves is also noted to be different. While in ViV without TIC, the EOA improves with supra-annular deployment monotonically going from 1.13±0.02 cm2 at −9.8mm to 1.77±0.15 cm2 at +6mm (p<0.01), in ViV with TIC the EOA seems to be non-uniform as the deployment varies going from 1.27±0.03cm2 at −9.8mm to 0.97±0.02 cm2 at 0 mm (p<0.01) only to recover and reach 1.10±0.04 cm2 at +6mm (p<0.01 between 0 and +6mm) mirroring the behaviour of the pressure gradient curve.
Figure 4.
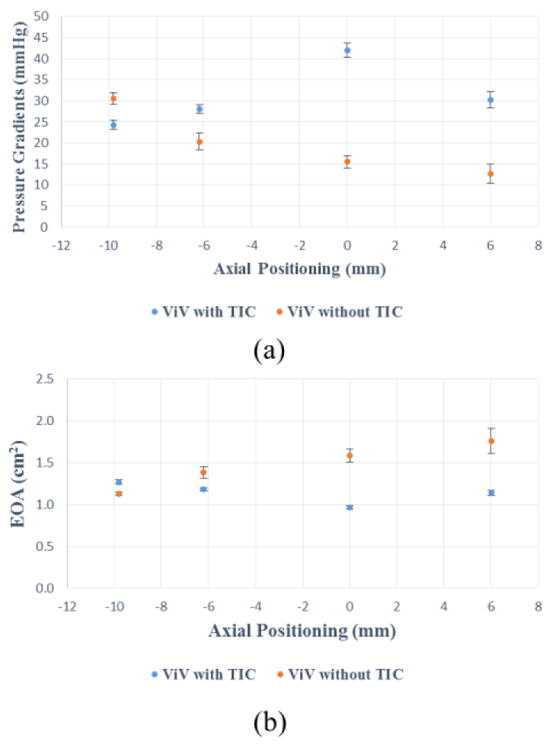
(a) Pressure gradients (PG) of the ViV combinations at different axial positions (b) Effective orifice areas (EOA) of the ViV combinations at different axial positions. The error bars indicate the standard deviation.
To assess if the TAV placement directly impacts inflow and outflow geometries, the inflow orifice area (IOA) and outflow areas of the ViV configuration of each corresponding SAV are plotted versus the different axial positions in Fig. 3a and Fig. 3b respectively. IOA of the ViVs represents the physical opening of the orifice where the flow enters the ViV apparatus as highlighted in Fig. 3a inset. The outflow areas represent any constriction of the stent as shown in Fig. 3b inset. The variations for IOA as well as outflow area showed the same pattern of variation with respect to the axial positions for both SAV cases. Both IOA and outflow areas increased with supra-annular axial deployment. The maximum difference in IOA was 0.19cm2 and 0.14 cm2 for the triangular outflow area corresponding to the axial position of +6mm. The differences in IOA values at every axial position between ViV with TIC and without are not significant (p=0.23, p=0.19, p=0.11 and p=0.22 going from sub-annular to supra-annular deployment depths respectively). Similarly, for the triangular outflow areas the differences are not significant comparing every axial position between ViV with and without TIC (p=0.36, p=0.47, p=0.39 and p=0.37 going from sub-annular to supra-annular deployment depths respectively).
Flow velocity fields
Bin averaged velocity vectors and vorticity contours of the main jet flow from the ViV with and without TIC are displayed in Fig. 5 for the different axial positions at peak systole. The red and blue contours represent the shear layers corresponding to the jet boundaries and the distance between them represents the width of the jet. The line extending distal from the TAV leaflet edges with respect to the flow is shown was dotted lines in the same figure. These dotted lines do not physically represent the leaflet; they only represent where the edge of the leaflet is situated with respect to the jet boundaries. The distances between the parallel shear layers for the different axial positions were measured and plotted in Fig. 6a. For the ViV without TIC, the distance between shear layers monotonically increases with increasing axial position going from 7.0±0.2mm at −9.8mm to 10.2±0.3mm at +6mm (p<0.01). The shear layers are tangent to the trajectory of the dotted lines as shown in Fig.5. However, in the case of ViV with TIC, the distance between shear layers decreases from 7.3±0.4mm at −9.8mm to reach a minimum of 4.8±0.3mm at 0mm (p<0.01), only to recover to 5.5±0.5mm at +6mm (p=0.13 showing that the difference at 0 and +6mm is insignificant).
Figure 6.
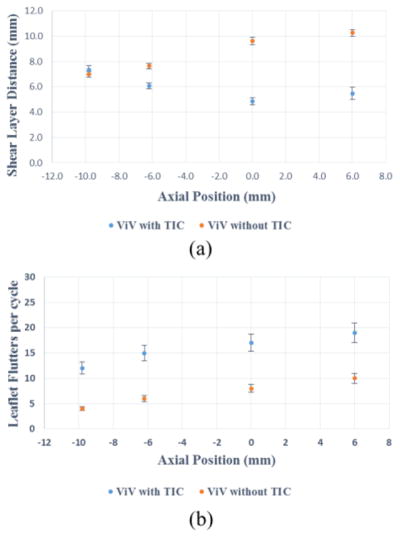
(a) Distance between shear layers at different axial positions (b) Leaflet flutters per cardiac cycle at different axial positions. The error bars indicate the standard deviation.
Leaflet kinematics
The opening and closing of the leaflets are well observed in the en-face high-speed imaging videos (Video 1). These videos show significantly stronger and higher-frequency leaflet fluttering throughout the cardiac cycle for ViV with TIC cases at all axial positions. The leaflet flutters per cycle are plotted versus the axial positions for both ViVs and shown in Fig. 6b. ViV with TIC at all axial positions shows higher fluttering frequency (~ 100% increase) compared to without TIC.
Discussion
The ViV setup of a 23mm Medtronic Evolut TAV in a severely calcified 23mm Carpentier-Edwards SAV with TIC explanted from a patient was tested in a left heart simulator to check for anomalous hemodynamic performance or similarities as a function of axial positioning with those obtained when the SAV is pristine. This in-vitro assessment of ViV using SAVs with and without TIC has shown that TIC yielded a significantly different and non-monotonic ViV hemodynamic performance relative to axial positioning compared with without TIC. In what follows, we focus on illustrating a new dynamic mechanism, brought on from TIC, for the observed hemodynamic behaviour in ViV.
As shown in this study’s ViV without TIC, supra-annular deployment of the TAV yields better EOA and lower PGs compared with lower axial positions. This finding was in agreement with previous literature17, 23. Nevertheless, in the case of the ViV with TIC, the EOA does not seem to undergo a significant improvement as the axial deployment of the TAV varies from sub-annular positions to supra-annular positions. While this clearly does not contradict with the fact that supra-annular implantations does provide the most probability for low gradient, it does explain why there are some (although low probability) cases where supra-annular do not reduce gradients significantly. This was previously unexplainable using in-vitro studies of ViV in pristine SAVs. For the specific model in this study, non-monotonic behaviour of the EOA versus the different axial positions is noted with the apparent drop in EOA for the 0mm axial position and the recovery with the supra-annular deployment at +6mm.
Interestingly, the geometric differences in terms of inflow and outflow areas (Fig. 3a and 3b) between ViV with and without TIC did not show differences in magnitude or trends significant enough between both cases to explain the starkly contrasting pressure and EOA behaviour (Fig. 4a and 4b). In fact, for ViV without TIC, the variations in inflow and outflow areas with axial positioning agree with published EOA results2, 17, 24. Nevertheless, these area variations fail to explain the non-monotonic PG or EOA measurements for ViV configurations with TIC.
While the inflow and outflow areas are not significantly different, this study clearly showed that the jet widths as well as leaflet oscillation characteristics were significantly different between ViV with TIC and the pristine cases indicating that the valve’s dynamic function was significantly altered despite the TAV being geometrically seated identical to that in the TIC free case. In fact, the distances between the shear layers (which represent the width of the jet) when plotted with respect to different axial positions mirrored the variations of EOAs shown in Fig. 4b and 6a. This should not be surprising because EOA by definition represents the area of cross-section of the vena contracta region of the jet, therefore physically they are meant to mirror each other. So the question remains: why is the jet narrower with more leaflet oscillations when there is TIC particularly for some exceptional high implantation cases?
The only explanation physically possible is the effect of irregular tissue ingrowth that is commonly seen along on the lumen of the inflow region of the SAV as well as the calcific nodules also present in the lumen region of the SAV. The occurrence of leaflet oscillations signifies that the forward jet has separated right around the inflow region of the SAV causing jet convergence to occur within the SAV itself (see Video 2). Flow separation occurs when the fluid particles adjacent to the body deviate from the contour of the body, contrary to flow attachment which means that the fluid particles move parallel to the body wall. The zone of separated flow is a recirculation zone surrounding the converging jet interacts and exciting fluid instabilities that lead to pressure oscillations causing leaflets to flutter. This is in contrast to what typically happens in prosthetic heart valves where the flow remains attached until the leaflets edge with turbulence occurring further downstream, thereby not exhibiting any significant leaflet flutter. A separated turbulent jet at the inflow is consistent with the observation of the leaflets (see Video 1) oscillating in response to jet instabilities within the SAV lumen.
A schematic illustrating the above dynamic phenomena of the flow fields upstream and downstream of ViV with and without TIC during forward flow phase is represented in Fig. 7. When the TAV is deployed inside a SAV without TIC (Fig. 7a), the smoothness of the SAV inflow region offers a flow entry with minimal perturbations. The flow remains attached inside the available lumen of the ViV and eventually separates at the TAV leaflets edge ultimately issuing a central jet. However, for ViV with TIC (Fig. 7b), the irregularities at the inflow region from TIC, force the flow to separate at the inflow orifice. The resulting jet is narrower and flows through the length of the ViV configuration, also causing the leaflets to flutter in response to oscillations between the turbulent jet and the flexible TAV leaflets. This phenomenon is illustrated in Fig. 7 and Video 2 and confirmed by the low jet width measurements that are represented by the distances between the shear layers (Fig. 5 and 6a) and the increased flutter noticed in ViV with TIC cases (Fig. 6b and Video 1). The fluttering observed comes in accordance with the position of the leaflets relative to the flow shown in Fig. 5. These observations indicate that for ViV with TIC, the jet is more unstable and narrower on an average leading to higher PGs.
Figure 7.
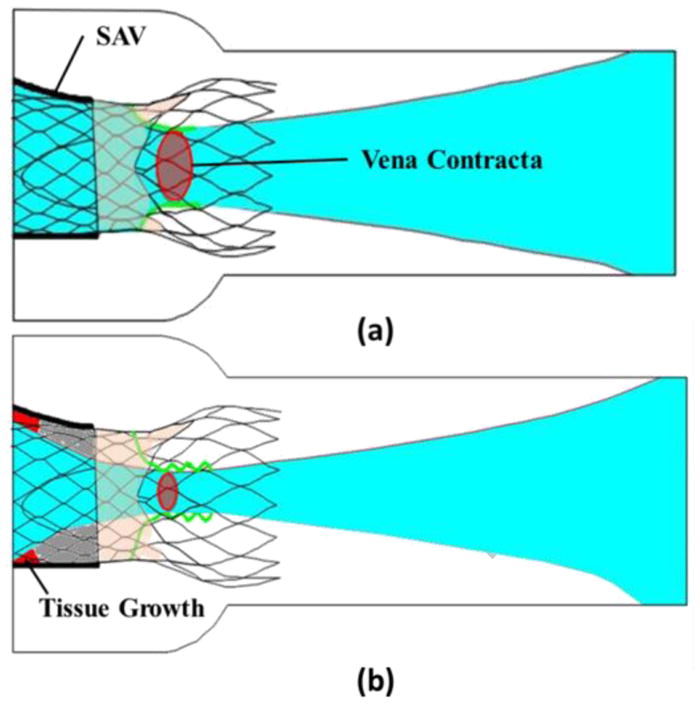
Flow fields upstream and downstream of ViV (a) without TIC and (b) with TIC during the forward flow phase.
As a final discussion point, the nature of TIC certainly appears to play a dynamic role in ViV hemodynamic performance. To put things into perspective, every SAV with TIC will have its own unique features and therefore can be expected to have a unique performance characteristic. If the above study was conducted on a random sampling of explanted valves, the result would mirror the variations seen in-vivo as opposed to the well-defined curves seen in pristine valve in-vitro ViV studies. While we believe that the mechanisms outlined above may not explain all of the incidences of obtaining high PGs in-vivo with high-implants when they should not, the bigger question is whether patient specific customization be incorporated into the guidelines to potentially minimize the inflow perturbations impact within SAV with TIC. Addressing the revision guidelines is beyond the scope of this work and we hope future studies will focus on this aspect through prospective clinical studies.
Conclusions
An in-vitro study of a ViV using SAV without TIC and another with TIC was performed with a Medtronic Evolut as the TAV as a function of axial positioning. We conclude that the inflow TIC greatly influence ViV performance due to dynamic effects that results in a real anomalous performance characteristic different than that seen in most ViV in-vivo. Further in-vivo studies are needed to evaluate ViV outcomes in the presence of severe TIC in SAVs.
Supplementary Material
Acknowledgments
The research done was partly supported by National Institutes of Health (NIH) under Award Number R01HL119824.
Footnotes
Conflict of Interest: Dr. Juan Crestanello reports having grants from Medtronic, Boston Scientific and St Jude in addition to being part of the advisory board of Medtronic. Dr. Dasi reports having a patent application filed on novel polymeric valves. The other authors have no conflicts of interest to declare.
Publisher's Disclaimer: This is a PDF file of an unedited manuscript that has been accepted for publication. As a service to our customers we are providing this early version of the manuscript. The manuscript will undergo copyediting, typesetting, and review of the resulting proof before it is published in its final citable form. Please note that during the production process errors may be discovered which could affect the content, and all legal disclaimers that apply to the journal pertain.
References
- 1.Azadani Ali N, Jaussaud Nicolas, Matthews Peter B, Ge Liang, Guy T Sloane, Chuter Timothy AM, Tseng Elaine E. Valve-in-Valve Implantation Using a Novel Supravalvular Transcatheter Aortic Valve: Proof of Concept. The Annals of thoracic surgery. 2009;88:1864–69. doi: 10.1016/j.athoracsur.2009.08.004. [DOI] [PubMed] [Google Scholar]
- 2.Azadani Ali N, Reardon Michael, Simonato Matheus, Aldea Gabriel, Nickenig Georg, Kornowski Ran, Dvir Danny. Effect of Transcatheter Aortic Valve Size and Position on Valve-in-Valve Hemodynamics: An in-Vitro Study. The Journal of Thoracic and Cardiovascular Surgery. 2017 doi: 10.1016/j.jtcvs.2016.12.057. [DOI] [PubMed] [Google Scholar]
- 3.Bapat Vinayak. Valve in Valve App. 2015. [Google Scholar]
- 4.Bapat Vinayak, Mydin Izanne, Chadalavada Sucharitha, Tehrani Hassan, Attia Rizwan, Thomas Martyn. A Guide to Fluoroscopic Identification and Design of Bioprosthetic Valves: A Reference for Valve-in-Valve Procedure. Catheterization and Cardiovascular Interventions. 2013;81:853–61. doi: 10.1002/ccd.24419. [DOI] [PubMed] [Google Scholar]
- 5.Barbetseas John, Nagueh Sherif F, Pitsavos Christos, Toutouzas Pavlos K, Quiñones Miguel A, Zoghbi William A. Differentiating Thrombus from Pannus Formation in Obstructed Mechanical Prosthetic Valves: An Evaluation of Clinical, Transthoracic and Transesophageal Echocardiographic Parameters. Journal of the American College of Cardiology. 1998;32:1410–17. doi: 10.1016/s0735-1097(98)00385-4. [DOI] [PubMed] [Google Scholar]
- 6.Chopard R, Teiger E, Meneveau N, Chocron S, Gilard M, Laskar M, Eltchaninoff H, Iung B, Leprince P, Chevreul K, Prat A, Lievre M, Leguerrier A, Donzeau-Gouge P, Fajadet J, Mouillet G, Schiele F. Baseline Characteristics and Prognostic Implications of Pre-Existing and New-Onset Atrial Fibrillation after Transcatheter Aortic Valve Implantation: Results from the France-2 Registry. JACC Cardiovasc Interv. 2015;8:1346–55. doi: 10.1016/j.jcin.2015.06.010. [DOI] [PubMed] [Google Scholar]
- 7.Dasi LP, Ge L, Simon HA, Sotiropoulos F, Yoganathan AP. Vorticity Dynamics of a Bileaflet Mechanical Heart Valve in an Axisymmetric Aorta. Physics of Fluids. 2007;19:067105. [Google Scholar]
- 8.David Tirone E, Ivanov Joan, Armstrong Sue, Feindel Christopher M, Cohen Gideon. Late Results of Heart Valve Replacement with the Hancock Ii Bioprosthesis. The Journal of thoracic and cardiovascular surgery. 2001;121:268–78. doi: 10.1067/mtc.2001.112208. [DOI] [PubMed] [Google Scholar]
- 9.Dvir Danny, Webb John, Brecker Stephen, Bleiziffer Sabine, Hildick-Smith David, Colombo Antonio, Descoutures Fleur, Hengstenberg Christian, Moat Neil E, Bekeredjian Raffi. Transcatheter Aortic Valve Replacement for Degenerative Bioprosthetic Surgical Valves: Results from the Global Valve-in-Valve Registry. Circulation. 2012 doi: 10.1161/CIRCULATIONAHA.112.104505. CIRCULATIONAHA.112.104505. [DOI] [PubMed] [Google Scholar]
- 10.Dvir Danny, Webb John G, Bleiziffer Sabine, Pasic Miralem, Waksman Ron, Kodali Susheel, Barbanti Marco, Latib Azeem, Schaefer Ulrich, Rodés-Cabau Josep. Transcatheter Aortic Valve Implantation in Failed Bioprosthetic Surgical Valves. Jama. 2014;312:162–70. doi: 10.1001/jama.2014.7246. [DOI] [PubMed] [Google Scholar]
- 11.Eggebrecht H, Schafer U, Treede H, Boekstegers P, Babin-Ebell J, Ferrari M, Mollmann H, Baumgartner H, Carrel T, Kahlert P, Lange P, Walther T, Erbel R, Mehta RH, Thielmann M. Valve-in-Valve Transcatheter Aortic Valve Implantation for Degenerated Bioprosthetic Heart Valves. Jacc-Cardiovascular Interventions. 2011;4:1218–27. doi: 10.1016/j.jcin.2011.07.015. [DOI] [PubMed] [Google Scholar]
- 12.Forleo Marcio, Dasi Lakshmi Prasad. Effect of Hypertension on the Closing Dynamics and Lagrangian Blood Damage Index Measure of the B-Datum Regurgitant Jet in a Bileaflet Mechanical Heart Valve. Annals of biomedical engineering. 2014;42:110–22. doi: 10.1007/s10439-013-0896-1. [DOI] [PubMed] [Google Scholar]
- 13.Glower Donald D, Landolfo Kevin P, Cheruvu Srinivas, Cen Ye-Ying, Harrison J Kevin, Bashore Thomas M, Smith Peter K, Jones Robert H, Wolfe Walter G, Lowe James E. Determinants of 15-Year Outcome with 1,119 Standard Carpentier-Edwards Porcine Valves. The Annals of thoracic surgery. 1998;66:S44–S48. doi: 10.1016/s0003-4975(98)01114-x. [DOI] [PubMed] [Google Scholar]
- 14.Gurvitch Ronen, Cheung Anson, Ye Jian, Wood David A, Willson Alexander B, Toggweiler Stefan, Binder Ronald, Webb John G. Transcatheter Valve-in-Valve Implantation for Failed Surgical Bioprosthetic Valves. Journal of the American College of Cardiology. 2011;58:2196–209. doi: 10.1016/j.jacc.2011.09.009. [DOI] [PubMed] [Google Scholar]
- 15.Hatoum Hoda, Dollery Jennifer, Lilly Scott, Crestanello Juan A, Dasi LP. Implantation Depth and Rotational Orientation Effects on Valve-in-Valve Hemodynamics and Sinus Flow. Annals of Thoracic and Cardiovascular Surgery. 2018 doi: 10.1016/j.athoracsur.2018.01.070. [DOI] [PMC free article] [PubMed] [Google Scholar]
- 16.Hatoum Hoda, Moore Brandon L, Maureira Pablo, Dollery Jennifer, Crestanello Juan A, Dasi Lakshmi Prasad. Aortic Sinus Flow Stasis Likely in Valve-in-Valve Transcatheter Aortic Valve Implantation. The Journal of Thoracic and Cardiovascular Surgery. doi: 10.1016/j.jtcvs.2017.03.053. [DOI] [PMC free article] [PubMed] [Google Scholar]
- 17.Midha Prem A, Raghav Vrishank, Condado Jose F, Okafor Ikechukwu U, Lerakis Stamatios, Thourani Vinod H, Babaliaros Vasilis, Yoganathan Ajit P. Valve Type, Size, and Deployment Location Affect Hemodynamics in an in Vitro Valve-in-Valve Model. JACC: Cardiovascular Interventions. 2016;9:1618–28. doi: 10.1016/j.jcin.2016.05.030. [DOI] [PubMed] [Google Scholar]
- 18.Midha Prem A, Raghav Vrishank, Okafor Ikechukwu, Yoganathan Ajit P. The Effect of Valve-in-Valve Implantation Height on Sinus Flow. Annals of biomedical engineering. 2017;45:405–12. doi: 10.1007/s10439-016-1642-2. [DOI] [PubMed] [Google Scholar]
- 19.Milburn Krys, Bapat Vinayak, Thomas Martyn. Valve-in-Valve Implantations: Is This the New Standard for Degenerated Bioprostheses? Review of the Literature. Clinical Research in Cardiology. 2014;103:417–29. doi: 10.1007/s00392-013-0653-3. [DOI] [PubMed] [Google Scholar]
- 20.Moore Brandon L, Dasi Lakshmi Prasad. Coronary Flow Impacts Aortic Leaflet Mechanics and Aortic Sinus Hemodynamics. Annals of biomedical engineering. 2015;43:2231–41. doi: 10.1007/s10439-015-1260-4. [DOI] [PMC free article] [PubMed] [Google Scholar]
- 21.Piazza Nicolo, Bleiziffer Sabine, Brockmann Gernot, Hendrick Ruge, Deutsch Marcus-André, Opitz Anke, Mazzitelli Domenico, Tassani-Prell Peter, Schreiber Christian, Lange Rüdiger. Transcatheter Aortic Valve Implantation for Failing Surgical Aortic Bioprosthetic Valve: From Concept to Clinical Application and Evaluation (Part 1) JACC: Cardiovascular Interventions. 2011;4:721–32. doi: 10.1016/j.jcin.2011.03.016. [DOI] [PubMed] [Google Scholar]
- 22.Rahimtoola Shahbudin H. The Problem of Valve Prosthesis-Patient Mismatch. Circulation. 1978;58:20–24. doi: 10.1161/01.cir.58.1.20. [DOI] [PubMed] [Google Scholar]
- 23.Simonato Matheus, Azadani Ali N, Webb John, Leipsic Jonathon, Kornowski Ran, Vahanian Alec, Wood David, Piazza Nicolo, Kodali Susheel, Ye Jian. In Vitro Evaluation of Implantation Depth in Valve-in-Valve Using Different Transcatheter Heart Valves. EuroIntervention: journal of Euro PCR in collaboration with the Working Group on Interventional Cardiology of the European Society of Cardiology. 2016;12:909. doi: 10.4244/EIJV12I7A149. [DOI] [PubMed] [Google Scholar]
- 24.Simonato Matheus, Dvir Danny. Transcatheter Replacement of Failed Bioprosthetic Valves: Comprehensive in-Vitro Bench Testing and Large in-Vivo Clinical Assessment of the Effect of Implantation Depth on Hemodynamics after Valve-in-Valve. Cardiology. 2016;134:171. [Google Scholar]
- 25.Simonato Matheus, Webb John, Kornowski Ran, Vahanian Alec, Frerker Christian, Nissen Henrik, Bleiziffer Sabine, Duncan Alison, Rodés-Cabau Josep, Attizzani Guilherme F. Transcatheter Replacement of Failed Bioprosthetic Valves. Circulation: Cardiovascular Interventions. 2016;9:e003651. doi: 10.1161/CIRCINTERVENTIONS.115.003651. [DOI] [PubMed] [Google Scholar]
- 26.Vongpatanasin Wanpen, Hillis L David, Lange Richard A. Prosthetic Heart Valves. New England Journal of Medicine. 1996;335:407–16. doi: 10.1056/NEJM199608083350607. [DOI] [PubMed] [Google Scholar]
- 27.Walther Thomas, Dehdashtian Mark M, Khanna Rajesh, Young Ernest, Goldbrunner Peter J, Lee Walter. Trans-Catheter Valve-in-Valve Implantation: In Vitro Hydrodynamic Performance of the Sapien+ Cloth Trans-Catheter Heart Valve in the Carpentier-Edwards Perimount Valves. European Journal of Cardio-Thoracic Surgery. 2011;40:1120–26. doi: 10.1016/j.ejcts.2011.02.056. [DOI] [PubMed] [Google Scholar]
- 28.Webb John G, Dvir Danny. Transcatheter Aortic Valve Replacement for Bioprosthetic Aortic Valve Failure the Valve-in-Valve Procedure. Circulation. 2013;127:2542–50. doi: 10.1161/CIRCULATIONAHA.113.000631. [DOI] [PubMed] [Google Scholar]
- 29.Yoganathan Ajit P, Corcoran WILLIAMH, Harrison EARLC, Carl JAMESR. The Björk-Shiley Aortic Prosthesis: Flow Characteristics, Thrombus Formation and Tissue Overgrowth. Circulation. 1978;58:70–76. doi: 10.1161/01.cir.58.1.70. [DOI] [PubMed] [Google Scholar]
- 30.Yoganathan Ajit P, He Zhaoming, Casey Jones S. Fluid Mechanics of Heart Valves. Annu Rev Biomed Eng. 2004;6:331–62. doi: 10.1146/annurev.bioeng.6.040803.140111. [DOI] [PubMed] [Google Scholar]
Associated Data
This section collects any data citations, data availability statements, or supplementary materials included in this article.


