

Abstract
Several epidemiologic studies have reported that cyclooxygenase (COX) inhibitors prevent/delay the onset of Alzheimer’s disease (AD). Recent experimental studies suggest that these compounds can also diminish amyloid-β (Aβ) neuropathology in rodent models of AD. To explore the relationship of COX expression to Aβ neuropathology, we crossed mice expressing both mutant amyloid precursor protein [K670N/M671L (APPswe)] and mutant PS1 (A246E) with mice expressing human COX-2 selectively in neurons. We show here that human COX-2 expression in APPswe/PS1/COX-2 mice induces potentiation of brain parenchymal amyloid plaque formation and a greater than twofold increase in prostaglandin E2 production, at 24 months of age. This increased amyloid plaque formation coincided with a preferential elevation of Aβ1–40 and Aβ1–42 with no change in total amyloid precursor protein (APP) expression/content in the brain. Collectively these data suggest that COX-2 influences APP processing and promotes amyloidosis in the brain.
Keywords: COX-2, Amyloid, Alzheimer’s disease, Inflammation
A large number of epidemiological studies have indicated that the use of nonsteroidal anti-inflammatory drugs (NSAIDs) may prevent or delay the clinical features of Alzheimer’s disease (AD) (7,13,18). However, recent therapeutic studies with both cyclooxygenase (COX)-inhibiting NSAIDs and steroids could not confirm this epidemiological evidence (9).
The pharmacological activity of NSAIDs is generally attributed to the inhibition of COX, a rate-limiting enzyme necessary for the production of prostaglandins (PGs). COX-2 is the inducible form of COX and is involved in inflammatory responses but also neuronal functions (22). We (5,6,15) and others (14,21) have shown that COX-2 expression is elevated in the AD brain and that this elevation is correlated with the severity of brain amyloid plaque pathology (6). Additionally, a recent study found a preferential loss of hippocampal COX-2-immunopos-itive neurons in the brains of AD patients suffering severe dementia (22). However, recent evidence indicates that nonselective COX, rather than selective COX-2-specific inhibitors, has been found to influence amyloid precursor protein (APP) processing. Thus, the characterization of COX activities in the brain and their role in AD amyloidosis is receiving a great deal of attention.
To investigate the potential that chronic elevation of COX-2 expression could influence amyloid neuro-pathology in vivo, we backcrossed mice selectively expressing (h)COX-2 in neurons (10) with APPswe/ PS1-A246E transgenics (20) to generate APPswe/PS1-A246E/hCOX-2 mice. We found that the expression of hCOX-2 in the brains of APPswe/PS1-A246E animals induced selective alterations to APP processing that significantly promoted brain amyloid deposition at 24 months of age. Collectively, these studies suggest that elevated expression of COX-2 in the brain may potentiate amyloid neuropathology through mechanisms that involve COX-2-mediated APP processing.
MATERIALS AND METHODS
Transgenic Mice
Transgenic mice expressing both the human APPswe (K670N/M671L) mutation (line C3-3) and human PS1-A246E mutation (line N-5) under the regulation of a prion protein promoter were derived from founder mice provided by Dr. David Borchelt (1), and mice expressing hCOX-2 under the regulation of a neuron-specific enolase (NSE) promoter (10,20) were described previously. Heterozygous hCOX-2 transgenic mice (line NHC #32) were crossed with heterozygous APPswe/PS1 (A246E) transgenics to generate triple transgenic APPswe/PS1/hCOX-2 and double transgenic APPswe/PS1 littermates. To minimize the influence of a hybrid background, APPswe/ PS1 and/or hCOX-2 transgenics were maintained in the same C57Bl/6J × C3H (B6C3) strain. Characterization of APPswe/PS1-A246E offspring generated in our transgenic mouse facility indicates that this trans-genic mouse model develops maximal amyloid plaque pathology by 24 months of age (Xiang and Pasinetti, unpublished observation; David Borchelt, personal communication). For example, in control studies we found that the plaque pathology in the brain of 12-month-old APPswe/PS1-A246E is characterized by deposition of approximately of 20–40 6E10-immunopositive plaques per brain tissue section, which increased significantly by 24 months of age to approximately 80–120 plaques per section (Xiang, unpublished observation). Because of our previous evidence suggesting that hCOX-2 may not influence the initiation amyloidosis in the brain of 12-month-old APPswe/PS1-A246E (20), we examined the brain of 24-month-old male heterozygous APPswe/ PS1/hCOX-2 or APPswe/PS1 transgenic mice. All offspring from mating APPswe/PS1 and hCOX-2 were sorted by genotype for the individual transgenes (1,10). In addition, the presence of proper hCOX-2 mRNA expression in the brains of the APPswe/PS1/hCOX-2 mice, and its absence in the APPswe/PS1 and nontransgenic mice, were verified by in situ hybridization in all histologically examined animals (see Results). The mice were maintained on a 12-h light/ dark cycle and had access to food and water ad libitum. The animal care was in accordance with institutional guidelines.
Mice were sacrificed by decapitation and brains stored at -70°C. One hemisphere was coronally cryosliced (10 μm) and tissue sections were mounted on slides and stored in airtight boxes at −70°C until use. The remaining hemisphere was used for biochemical studies.
Amyloid Plaque Burden
For consistency, all the brain tissues sections to be examined were mounted on the same slide and carefully matched with respect to their brain caudal-to-rostral distribution (bregma 1.10 through -0.22; Mouse Brain Atlas, Paxinos). For detection of 6E10-immunopositive amyloid-β (Aβ) plaques, mounted frozen tissue sections were postfixed in 4% paraformaldehyde in phosphate-buffered saline (PBS, pH 7.4) (30 min, room temperature), incubated in 70% formic acid for 10 min, rinsed in PBS, and incubated in 0.3% (v/v) H2O2 for 15 min to block endogenous peroxidase activity. After permeabilization with 0.2% (v/v) Triton X-100 in PBS, the sections were incubated overnight with biotinylated mouse anti-Aβ (6E10; dilution 1:500; Senetek, St. Louis, MO) at 4°C in the presence of 1% (v/v) rabbit serum to reduce nonspecific antibody binding. Immunostaining was visualized using Vectastain ABC and DAB kits (Vector Laboratories, Burlingame, CA).
Congo Red birefringent positive Aβ plaques were detected using a Congo Red kit (Sigma, St. Louis, MO). Briefly, tissue sections adjacent to those used for 6E10 immunostaining were postfixed in 4% para-formaldehyde in PBS, incubated in alkaline-saturated alcoholic sodium chloride solution, and then stained in 0.2% (w/v) Congo Red. Birefringence was viewed under crossed polarized light.
Image Analysis
Amyloid burden from each mouse was quantified on five serial sections encompassing the cingulate/retrosplenial cortex, sampled at equal spatial intervals in the caudal-to-rostral orientation. All slides were processed at the same time. Microscopic images were digitized using a high-resolution charge-coupled-device (CCD) Sony (Tokyo, Japan) camera and quantified using Bioquant computer-assisted densitometry (Biometrics, Inc., Nashville, TN). Using this system for quantification of amyloid area burden (6E10 immunoreactivity and Congo Red plaque staining), the user first adjusts an optical density threshold to “tag” the stained area of interest while defining the total area of the field to be assessed. Once the area to be measured and the threshold are set, the computer measures the total area (in pixels) and the area above threshold. The direct output of this analysis is the stained area expressed as area fraction (stained area/total image area) or the number of stained objects. In our study, Congo Red-positive plaques were defined as those objects displaying gold-green birefringence under crossed polarized light and having their perimeter located outside one radius from the center of any other adjacent Congo Red-positive plaque structure. The examiner performing these measurements was blind to the mouse groups examined.
COX-2 mRNA Expression
COX-2 (endogenous mouse or exogenous trans-gene) mRNA expression in the brain was assayed with the RiboQuant™ Multiprobe RNase Protection Assay System (BD PharMingen, San Diego, CA), as previously described (12). Briefly, mouse- or human-specific COX-2 anti-sense cRNAs (10) and a set of control housekeeping cRNA probes [L32 and glyceraldehyde phosphate dehydrogenase (GAPDH)] were 32P labeled by in vitro transcription from linearized cDNAs, as previously described (12). The hCOX-2 cDNA probe was derived from the original hCOX-2 construct used to generate the hCOX-2 transgenics and does not cross-hybridize with endogenous mouse COX-2 mRNA (10). The radioactively labeled RNase protection fragments were quantified using a Storm 860 Phosphor Screen Scanner with the ImageQuant software package (Molecular Dynamics, Sunnyvale, CA). Each RNase protection assay analysis was conducted with 10 μg total RNA, according to A260 values. COX-2 mRNA (mouse or exogenous transgene) expression was normalized to that of the constitutively expressed GAPDH mRNA. Normalization of COX-2 mRNA signals to L32 did not change the outcome of the results (not shown).
For in situ hybridization detection of hCOX-2 transgene expression, frozen sections were postfixed in 4% paraformaldehyde in PBS (30 min, room temperature) and rinsed in PBS. Tissue sections were then rinsed in 0.1 M triethanolamine (TEA, pH 8.0), incubated in acetic anhydride (AA, 0.25% v/v in TEA, 10 min), and rinsed in TEA and PBS. Following AA treatment, tissue sections were hybridized with [35S]cRNA probes (0.3 μg/ml, 2 × 10⁹ dpm μg−1) transcribed from a linearized hCOX-2 cDNA. Following hybridization (overnight, 55°C), digestion with RNase A (20 μg/ml, 37°C, 0.5 h), high-stringency washes (0.1× SSC, 60°C, 1 h), and dehydration, slides were exposed to X-ray film for 24 h.
Western Analysis of Total APP and hCOX-2
Samples were homogenized in ice-cold buffer [Tris, pH 7.2, containing 1% NP-40, 0.5% sodium deoxycholate, 0.1% lauryl sulfate, 100 μg/ml PMSF, 3 μg/ml aprotinin, 3 μg/ml pepstatin A, 15 μg/ml propionyl-leupeptin, and 600 μg/ml Perfabloc (Boeh-ringer Mannheim)], boiled, centrifuged, and electrophoresed on 10% SDS-PAGE as previously described. Proteins were transferred to nylon Transblot membrane (Biorad) and immunoreacted with a monoclonal mouse anti-hAPP antibody (Chemicon, 22C11) (1:5000 dilution, 3 h, RT) in Superblock blocking solution (Pierce). Immunoreactivities were visualized autoradiographically using chemiluminescence detection kit (Super-Signal, Pierce). β-Actin immunoreactivity (anti-β-actin, Sigma, 1:5000) controlled for selectivity of changes.
Surface-Enhanced Laser Desorption/Ionization (SELDI) Mass Spectrometry
Further analysis of APP processing from brain tissues was performed by SELDI time-of-flight (TOF) mass spectrometry using the ProteinChip® system (Ciphergen Biosystems, Palo Alto, CA). Guanidine fractions were subjected to antibody capture using anti-Aβ antibodies (6E10; Senetek, Maryland Highs, MO), and the mass of each Aβ species was determined using the ProteinChip reader (2). The 6E10 mouse monoclonal antibody was added to the spots (0.5 μg/spot) of the preactivated SELDI ProteinChip and incubated in a humidified chamber for 2 h at room temperature. After washing with 10 mM PBS (pH 8.0), the array was incubated with a blocking solution containing 0.5 M ethanolamine in PBS (pH 8.0) for 15 min. The arrays were washed three times with PBS containing 0.5% (v/v) Triton X-100 (PBST) for 5 min and then the samples (0.3 μg total protein) incubated on each spot of the array for 1 h at room temperature (10 μl spot; 1:10 dilution). After removing the samples, the spots were washed three times with PBST and twice with distilled water. The spots were dried and treated with a solution containing 0.2% (w/v) α-cyano-4-hdroxy cinnamic acid in 0.25% (v/v) trifluoroacetic acid and 50% acetonitrile. Mass identification was made on each spot by 100 averaged shots in the Ciphergen SELDI Protein Biology System (PBSII).
Prostaglandin (PG) E2 Assay
PGE2 concentration was measured by enzyme-linked immunoassay kit (Cayman, Ann Harbor, MI) according to the manufacturer’s instructions. Briefly, frozen cerebral cortex was homogenized in 0.1 M PBS (containing 1 mM EDTA and 10 μM indomethacin), mixed with an equal volume of ethanol, and centrifuged. The supernatant fluid was then diluted with 50 mM acetate buffer and purified through an affinity column (Cayman). After the column was equilibrated with column buffer (0.1 M PBS, 7.7 mM NaN3, 0.5 M NaCl), the supernatant was eluted, evaporated, redissolved in enzyme-linked immunoassay buffer, and applied to 96-well plates precoated with goat anti-mouse IgG and incubated with PGE2 monoclonal antibody (and recovery tracer), for 18 h at 4°C. After the incubation with PGE2 monoclonal antibody, the plate was rinsed fives times with washing buffer and developed using Ellman’s reagent for 1 h at room temperature. The PGE2-specific concentration was determined spectrophotometrically and calculated by plotting the standard % B/B0 (% sample or standard bound/maximum bound) versus PGE2 concentration (in pg/ml).
Statistical Analysis
For each in vivo study three to five mice per group were studied. All values are expressed as means ± SEM. Differences among means were analyzed using analysis of variance (ANOVA). Newman-Keuls post hoc tests were used to assess pairwise comparisons between means. Differences between means were analyzed using a two-tailed Student t -test. In all analyses, the null hypothesis was rejected at the 0.05 level. The statistical analyses were performed using Prism Stat program (GraphPad Software, Inc., San Diego, CA).
RESULTS
Effects of hCOX-2 Expression on Amyloid Plaque Burden in the Cerebral Cortex of APPswe/PS1/COX-2 Transgenic Mice
Amyloid burden was determined in the brains of 24-month-old APPswe/PS1/hCOX-2 mice and APPswe/PS1 littermates using a combination of 6E10 immunostaining or Congo Red birefringence and quantification by high-power microscopy and image analysis. Consistent with previous studies of the brains of 12-month-old APPswe/PS1 transgenics (20), 6E10 Aβ deposits were most evident in the gray matter of the cingulate cortex of the APPswe/PS1 transgenics. For this reason, we continued to survey the influence of hCOX-2 expression on amyloid burden in the cingulate cortex of 24-month-old APPswe/PS1/hCOX-2 relative to APPswe/PS1 control littermates.
The hCOX-2 expression in the brain of 24-month-old APPswe/PS1/hCOX-2 transgenics resulted in a greater than twofold increase in 6E10-immunopositive Aβ plaque area (p < 0.05) (Figs. 1A, 2A, B) and Congo Red (β-pleated sheet) birefringence-positive plaque area (p < 0.01) (Figs. 1B, 2C, D) in the cingulate cortex, compared with age-matched APPswe/PS1 control littermates. Similarly, hCOX-2 expression also increased the number of 6E10-immunopositive Aβ plaques throughout the entire cortex (p < 0.03) (Fig. 1C).
Figure 1.

Analysis of 6E10-immunopositive Aβ plaque burden (A) and Congo Red birefringent-positive Aβ plaque burden (B) in the cingulate cortex, and numerical Congo Red plaque density through the entire cortex (C) of 24-month-old APPswe/PS1/hCOX-2 mice, compared with APPswe/PS1 control littermates. In (A, B) the results are expressed as percent of the control group (APPswe/PS1 littermates) and are shown as mean ± SEM. In (C), total number of plaque throughout the entire cortex is shown as mean ± SEM.
Figure 2.

Representative low-power magnification of 6E10-immunopositive Aβ plaques in the cingulate cortex of a APPswe/PS1 (A) and a APPswe/PS1/hCOX-2 transgenic (B), respectively. In (C) and (D), low-power magnification of Congo Red-positive Aβ plaque in the cerebral cortex of a APPswe/PS1 and a APPswe/PS1/hCOX-2 mouse displaying birefringence under polarized light. Scale bars (A, B): 100 μm; (C, D): 30 μm.
hCOX-2 Expression Alters Aβ Processing in the Brain
To determine if hCOX-2 influences APP processing in the brains of 24-month-old APPswe/PS1/hCOX-2 transgenics, we analyzed brain Aβ by SELDI affinity mass spectrometry using 6E10 antibody chips. The major detectable species of Aβ peptides in the guanidine-extracted fraction from the cortices of 24-month-old APPswe/PS1 transgenic mice were Aβ1–40 and Aβ1–42 [mass (Da)/charge 4,327.7 and 4,511.9, respectively] (Fig. 3A, a). A peak was also detected having a mass consistent with that of Aβ1–38 [mass (Da)/charge 4,128.6] (Fig. 3A, a). When we examined the cerebral cortex fractions derived from APPswe/PS1/hCOX-2 transgenics (Fig. 3A, b), we found a marked elevation in the amount of the Aβ1–40, Aβ1–42, and also Aβ1–38 species. We also note that SELDI analysis of the APPswe/PS1/hCOX-2 group identified additional peaks with molecular mass (Da)/ charge of 4,072.8 and 4,228.3, consistent with those of Aβ1–37 and Aβ1–39, respectively (Fig. 3A, b). This evidence suggests that hCOX-2 in the brain could promote Aβ generation and possibly amyloid burden by influencing APP processing preferentially toward the formation of Aβ1–40 and Aβ1–42, among others. We note that in control SELDI affinity mass spectrometry studies, chips lacking the 6E10 anti-Aβ capture antibody yielded negative results (not shown).
Figure 3.
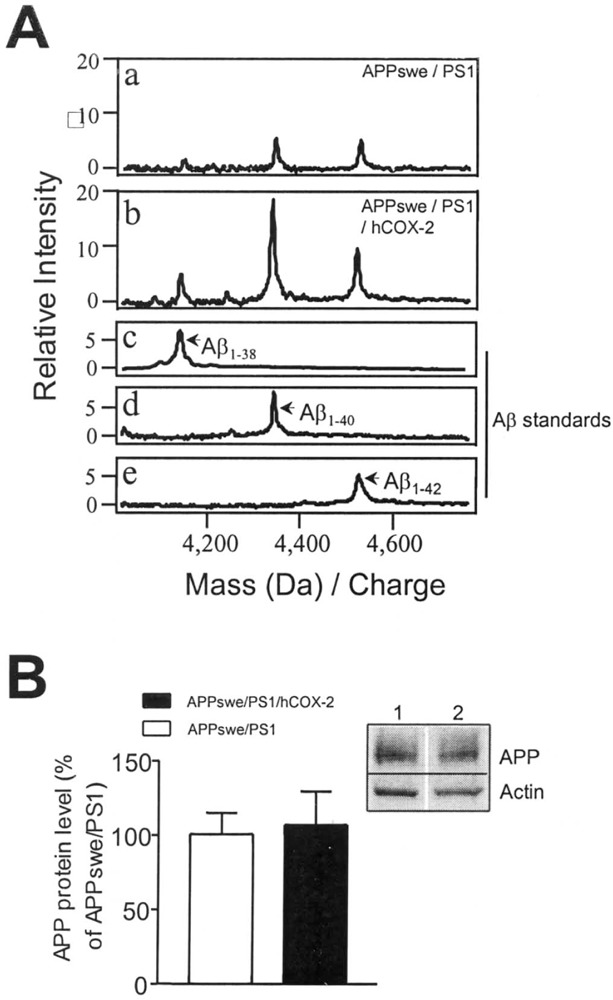
(A) Representative SELDI-TOF mass spectra for Aβ peptides in cortical extracts showing greater than twofold elevation of Aβ1–38, Aβ1–40, and Aβ1–42 in 24-month-old APPswe/PS1/hCOX-2 transgenic mice (b) compared with age matched APPswe/PS1 control littermates (a). In (c, d, e) synthetic Aβ1–38, Aβ1–40, and Aβ1–42 standards (Sigma, St. Louis, MO) were used to identify Aβ species. (B) No detectable change in total cortical APP content in 24-month-old APPswe/PS1/hCOX-2 transgenics compared with age-matched APPswe/PS1 control littermates, assessed by Western blot analysis with 22C11 APP antibody. The results are shown as mean ± SEM. (B, inset) Representative Western blot result: lane 1, APPswe/PS1; lane 2, APPswe/PS1/hCOX-2.
In control studies, we further investigated the possibility that the select elevation of total cortical Aβ peptides was associated with altered APP expression. Western blot immunodetection of APP using the 22C11 anti-APP antibody (N-terminal) revealed no detectable changes in the expression levels of total full-length APP in the brains of APPswe/PS1/hCOX-2 animals relative to age-matched APPswe/PS1 transgenics (Fig. 3B). Consistent with Western blot evidence, no detectable difference was found in cortical APP (endogenous mouse or exogenous human) mRNA expression in APPswe/PS1/hCOX-2 transgenics relative to age-matched APPswe/PS1 transgenic control litter-mates (not shown).
hCOX-2 Expression in the Brain Promotes PGE2 Synthesis Without Influencing Endogenous Mouse COX-2 Expression
In control studies, the overall levels of endogenous mouse and exogenous human COX-2 expression in the brains of 24-month-old APPswe/PS1/hCOX-2 and APPswe/PS1 mice were examined by RNase protection assay. The normalized (vs. GAPDH) levels of mouse cortical COX-2 mRNA expression did not differ between APPswe/PS1/hCOX-2 and APPswe/PS1 transgenics (Fig. 4A, B). However, as expected, the hCOX-2 mRNA transgene expression was detectable only in the brain of APPswe/PS1/hCOX-2 triple transgenics (Fig. 4A, B).
Figure 4.

(A) Endogenous mouse COX-2 mRNA expression in 24-month-old APPswe/PS1/hCOX-2 compared with age-matched APPswe/PS1 control littermates, as assessed by RNase protection assay. (B) Representative autoradiographic signal of protected RNA bands: lane 1, mouse (m)COX-2, human (h)COX-2, and GAPDH mRNA expression in APPswe/PS1 compared with APPswe/ PS1/hCOX-2 (lane 2). (C) Autoradiographic signal for exogenous hCOX-2 mRNA expression assessed by in situ hybridization. (D) Increased cortical PGE2 levels in 24-month-old APPswe/PS1/hCOX-2 compared with age-matched APPswe/PS1 control littermates. In (D) values are expressed as percent of the PGE2 values in APPswe/ PS1 and are shown as mean ± SEM.
The proper hCOX-2 mRNA transgene expression in the brain gray matter of the APPswe/PS1/hCOX-2 mice, and its absence in APPswe/PS1 mice, was confirmed by in situ hybridization (Fig. 4C).
PGE2 levels in the cortex of 24-month-old mice were examined to determine whether hCOX-2 expression in the brain of APPswe/PS1/hCOX-2 transgenics resulted in functional COX-2 activity. We found a greater than twofold elevation of cortical PGE2 activity in 24-month-old APPswe/PS1/hCOX-2 mice (p < 0.05) compared with APPswe/PS1 control littermates (Fig. 4D).
DISCUSSION
In this study we found that the neuronal expression of hCOX-2 in APPswe/PS1/hCOX-2 transgenic mice promoted amyloid plaque formation in the brain. This finding correlated with alterations in APP processing that primarily favored the generation of Aβ1–40 and Aβ1–42, among others. This marked facilitation of amyloidosis—coincidental to altered APP processing and not APP production–provides the first in vivo evidence supporting the hypothesis that COX-2 impacts AD-type amyloid neuropathology. In agreement with previous descriptive evidence suggesting that COX-2 expression correlates with AD neuropathology (14,15,21), these studies suggest that COX-2 activities are a significant risk factor influencing amyloidosis in the brain.
Previous evidence has indicated that COX-derived PGE2 can induce APP transcription in cultured glial cells (11). As expected, we found a robust increase in PGE2 content in the brains of APPswe/PS1/hCOX-2 mice, and in light of these studies explored the steady-state levels of APP expression in our transgenics. We found no alterations in total APP protein content (and mRNA expression, not shown) in the brain of 24-month-old APPswe/PS1/hCOX-2 mice compared with APPswe/PS1 transgenics. These data suggest that no relationship exists between PGE2 and steady-state levels of APP expression in our in vivo model. However, although COX-2 may not be the proximate cause of increased amyloid burden, through direct modulation of APP expression, it is possible that COX-2 may contribute to abnormal APP processing by altering the association of γ-secretase(s) with APP. Alternatively, COX-2, through mechanisms involving PG generation, might also inhibit α-secretase cleavage and result in increased Aβ peptide production, as has been previously reported in certain cases of hereditary amyloidosis (4). As well, we cannot rule out the possibility that COX-2 may directly or indirectly stimulate the activity of peptidases in the brain that convert Aβ1–42 into shorter Aβ species, such as Aβ1–40 or Aβ1–38 (among others), leading to altered Aβ peptide ratios. Using an adenovirus transfection system in ongoing in vitro studies, we are currently exploring the possibility that COX-2 (and/or COX-1) expression may influence APP processing by preferentially affecting α- and/or β-, γ-secretase(s) activities.
Genetic evidence supports a causative role for Aβ1–42 in AD pathogenesis, but at the same time provides less evidence to support a pathogenic role for Aβ1–40. However, a significant amount of Aβ1–40 and amino-terminally truncated forms of Aβ ending at Aβ40 are deposited in senile plaques in the typical late-onset AD brain (3). Moreover, in several studies Aβ1–40 appears to be the most abundant peptide in cerebrovascular amyloid deposits (3). While beyond the scope of these studies, we found that COX-2 did not promote perivascular amyloid deposition (Xiang and Pasinetti, unpublished observation) but preferentially promoted parenchymal amyloid deposition in the brain of 24-month-old APPswe/PS1/hCOX-2 transgenics. Thus, given the fact that the major difference in Aβ1–40 and Aβ1–42 species is the rates of fibril formation, it is likely that both of these isoforms can contribute to amyloidosis, but that Aβ1–40 deposition may require additional factors to promote its deposition. Additional factors that may promote Aβ1–40 fibril formation are through COX-2-mediated proinflammatory activities in the brain. For example, there is evidence that COX-2 may promote the expression of the complement component C1qB (17), known for its role in promoting Aβ aggregation (8). Moreover, our findings showing promotion of amyloidogenesis by hCOX-2 at 24 months of age (but not 12 months) (13) suggest that existing amyloid deposits may be necessary to elicit COX-2-mediated potentiation of amyloid deposition.
Our findings show that neuronal hCOX-2 expression in 24-month-old APPswe/PS1/hCOX-2 mice dramatically increases amyloid plaque deposition, possibly by influencing APP processing. This evidence is of particular interest in view of a recent study by Weggen et al. (19), reporting that NSAIDs may influence γ-secretase cleavage of APP and subsequently alter the generation of Aβ peptides. This study also found that the NSAID sulindac sulfide possessed anti-amyloidogenic activities, and suggested that this novel feature functioned independent of COX activity, in vitro. However, the data reported here suggest that, both in vivo and in vitro, COX-2 has direct relevance to APP processing and/or generation of Aβ peptides. Thus, it may be the case that chronic elevations of COX-2 as found in the AD brain may have significant relevance to APP processing. While it may be the case that selective COX-2 inhibitors are not the ideal NSAID for the treatment of AD clinical dementia (16), our study suggests that COX-2-inhibiting activities of NSAIDs may indeed have preventive therapeutic relevance to amyloidogenesis.
Collectively, this study strongly suggests that COX-2 is an important pathogenic effector in AD. We propose that further investigation of these findings will yield significant insight to the current understanding of the role NSAIDS in AD, and lead both to new strategies for the treatment of AD and to modifications in current treatment paradigms.
ACKNOWLEDGMENTS
Supported by NIA AG13799 and the Zenith Award from the Alzheimer’s Association to G.M.P.
REFERENCES
- 1. Borchelt D. R.; Ratovitski T.; van Lare J.; Lee M. K.; Gonzales V.; Jenkins N. A.; Copeland N. G.; Price D. L.; Sisodia S. S. Accelerated amyloid deposition in the brains of transgenic mice coexpressing mutant presenilin 1 and amyloid precursor proteins. Neuron 19:939–945; 1997. [DOI] [PubMed] [Google Scholar]
- 2. Davies H.; Lomas L.; Austen B. Profiling of amyloid beta peptide variants using SELDI Protein Chip arrays. Biotechniques 27:1258–1261; 1999. [PubMed] [Google Scholar]
- 3. Golde T. E.; Eckman C. B.; Younkin S. G. Biochemical detection of Abeta isoforms: Implications for pathogenesis, diagnosis, and treatment of Alzheimer’s disease. Biochim. Biophys. Acta 1502:172–187; 2000. [DOI] [PubMed] [Google Scholar]
- 4. Haass C.; Hung A. Y.; Selkoe D. J.; Teplow D. B. Mutations associated with a locus for familial Alzheimer’s disease result in alternative processing of amyloid beta-protein precursor. J. Biol. Chem. 269:17741–17748; 1994. [PubMed] [Google Scholar]
- 5. Ho L.; Pieroni C.; Winger D.; Purohit D. P.; Aisen P. S.; Pasinetti G. M. Regional distribution of cyclooxygenase-2 in the hippocampal formation in Alzheimer’s disease. J. Neurosci. Res. 57:295–303; 1999. [DOI] [PubMed] [Google Scholar]
- 6. Ho L.; Purohit D.; Haroutunian V.; Luterman J. D.; Willis F.; Naslund J.; Buxbaum J. D.; Mohs R. C.; Aisen P. S.; Pasinetti G. M. Neuronal cyclooxygenase 2 expression in the hippocampal formation as a function of the clinical progression of Alzheimer disease. Arch. Neurol. 58:487–492; 2001. [DOI] [PubMed] [Google Scholar]
- 7. in’t Veld B. A.; Ruitenberg A.; Hofman A.; Launer L. J.; van Duijn C. M.; Stijnen T.; Breteler M. M.; Stricker B. H. Nonsteroidal antiinflammatory drugs and the risk of Alzheimer’s disease. N. Engl. J. Med. 345:1515–1521; 2001. [DOI] [PubMed] [Google Scholar]
- 8. Jiang H.; Burdick D.; Glabe C. G.; Cotman C. W.; Tenner A. J. beta-Amyloid activates complement by binding to a specific region of the collagen-like domain of the C1q A chain. J. Immunol. 152:5050–5059; 1994. [PubMed] [Google Scholar]
- 9. Jones R. W. Inflammation and Alzheimer’s disease. Lancet 358:436–437; 2001. [DOI] [PubMed] [Google Scholar]
- 10. Kelley K. A.; Ho L.; Winger D.; Freire-Moar J.; Borelli C. B.; Aisen P. S.; Pasinetti G. M. Potentiation of excitotoxicity in transgenic mice overexpressing neuronal cyclooxygenase-2. Am. J. Pathol. 155:995–1004; 1999. [DOI] [PMC free article] [PubMed] [Google Scholar]
- 11. Lee R. K.; Knapp S.; Wurtman R. J. Prostaglandin E2 stimulates amyloid precursor protein gene expression: Inhibition by immunosuppressants. J. Neurosci. 19:940–947; 1999. [DOI] [PMC free article] [PubMed] [Google Scholar]
- 12. Luterman J. D.; Haroutunian V.; Yemul S.; Ho L.; Purohit D.; Aisen P. S.; Mohs R.; Pasinetti G. M. Cytokine gene expression as a function of the clinical progression of Alzheimer disease dementia. Arch. Neurol. 57:1153–1160; 2000. [DOI] [PubMed] [Google Scholar]
- 13. McGeer P. L.; Schulzer M.; McGeer E. G. Arthritis and anti-inflammatory agents as possible protective factors for Alzheimer’s disease: A review of 17 epidemiologic studies. Neurology 47:425–432; 1996. [DOI] [PubMed] [Google Scholar]
- 14. Oka A.; Takashima S. Induction of cyclo-oxygenase 2 in brains of patients with Down’s syndrome and dementia of Alzheimer type: Specific localization in affected neurones and axons. Neuroreport 8:1161–1164; 1997. [DOI] [PubMed] [Google Scholar]
- 15. Pasinetti G. M.; Aisen P. S. Cyclooxygenase-2 expression is increased in frontal cortex of Alzheimer’s disease brain. Neuroscience 87:319–324; 1998. [DOI] [PubMed] [Google Scholar]
- 16. Sainati S.; Ingram D.; Talwalker S.; Geis G. Results of a double-blind, randomized, placebo-controlled study of celecoxib in the treatment of progression of Alzheimer’s disease. Sixth International Stockholm/Springfield Symposium on Advances in Alzheimer Therapy; 2000. [Google Scholar]
- 17. Spielman L.; Winger D.; Ho L.; Aisen P. S.; Shohami E.; Pasinetti M. Induction of the complement component C1qB in brain of transgenic mice with neuronal overexpression of human cyclooxygenase-2. Acta Neuropathol. (Berl.) 103:157–162; 2002. [DOI] [PubMed] [Google Scholar]
- 18. Stewart W. F.; Kawas C.; Corrada M.; Metter E. J. Risk of Alzheimer’s disease and duration of NSAID use. Neurology 48:626–632; 1997. [DOI] [PubMed] [Google Scholar]
- 19. Weggen S.; Eriksen J. L.; Das P.; Sagi S. A.; Wang R.; Pietrzik C. U.; Findlay K. A.; Smith T. E.; Murphy M. P.; Bulter T.; Kang D. E.; Marquez-Sterling N.; Golde T. E.; Koo E. H. A subset of NSAIDs lower amyloidogenic Abeta42 independently of cyclo-oxygenase activity. Nature 414:212–216; 2001. [DOI] [PubMed] [Google Scholar]
- 20. Xiang Z.; Ho L.; Valdellon J.; Borchelt D.; Kelley K.; Spielman L.; Aisen P. S.; Pasinetti G. M. Cyclooxygenase (COX)-2 and cell cycle activity in a transgenic mouse model of Alzheimer’s disease neuropathology. Neurobiol. Aging; 23:327–334; 2002. [DOI] [PubMed] [Google Scholar]
- 21. Yasojima K.; Schwab C.; McGeer E. G.; McGeer P. L. Distribution of cyclooxygenase-1 and cyclooxy-genase-2 mRNAs and proteins in human brain and peripheral organs. Brain Res. 830:226–236; 1999. [DOI] [PubMed] [Google Scholar]
- 22. Yermakova A.; O’Banion M. K. Cyclooxygenases in the central nervous system: Implications for treatment of neurological disorders. Curr. Pharm. Des. 6:1755–1776; 2000. [DOI] [PubMed] [Google Scholar]