Abstract
The effectiveness of a clinical decision support (CDS) program encouraging clinicians to record patient’s Body Mass Index (BMI) and document appropriate follow-up plans is evaluated. Test (4,987 practices, 33,445 clinicians) and control groups (881 practices, 6,316 clinicians) were selected using stratified random sampling. Three CDS alerts for BMI screening and follow-up based on evidence based clinical quality guidelines were displayed at the point of care in a cloud-based EHR. The effectiveness of the CDS program was measured over 4 months by tracking recorded BMI and documented follow-up plans. Over the program, BMI recording increased minimally and documentation of follow-up plans increased 5-fold (p=0.05) compared to the control group. The overweight test group patients (18- 64yo) gained less weight (p=0.06) than the control group and underweight patients gained more weight (p<0.01) during the program period. Outcome studies with longer follow-up periods are needed to further confirm positive outcomes.
Introduction
According to the Centers for Disease Control and Prevention (CDC), more than one-third (36.5%) of U.S. adults are obese1. Obesity prevalence in the United States (U.S.) is on the rise and is expected to reach 42% of the population by 20302. Obesity is a risk factor for conditions including heart disease, stroke, type 2 diabetes, and certain types of cancer, some of the leading causes of preventable death2,3. Various institutions including the National Institutes of Health (NIH) and CDC have provided guidelines to help classify weight based on Body Mass Index (BMI)4,5. Anyone with a BMI between 25 and 29.9 would be classified as overweight and anyone with a BMI over 30 would be classified as obese4. In 2003, the U.S. Preventive Services Task Force recommended that primary care practitioners (PCPs) screen all adults for obesity and offer behavioral interventions and intensive counseling to affected individuals6. However, practice guidelines alone have failed to elicit appropriate clinician behavior7. Studies have shown that CDS systems improve clinical practice in preventive care and computer-assisted drug ordering and dosing systems8. While various studies have been done to test the effectiveness of CDS in management of high blood pressure, diabetes care, and asthma care8,9, there have been a limited number of studies that evaluate the effectiveness of a weight management CDS on clinician behavior and patient outcomes10.
A manufacturer of a chronic weight management treatment sponsored this CDS program for BMI screening and follow-up on the Practice Fusion EHR platform (PF-EHR). Our goals were to first measure the effectiveness of the CDS programs and second to find any evidence of improvements in patient outcomes associated with the CDS programs. The PF-EHR is cloud-based with 30,000 active practices in all 50 states facilitating over 5M office visits per month representing 6.7% of US ambulatory care. This study evaluates the impact of the weight management CDS program on clinician behavior and patient outcomes.
BMI Clinical Decision Support Program Development
For this study, three computer-based CDS alerts were implemented based on evidence-based clinical guidelines and quality measures11. The CDS logic implemented is represented below (Figure 1).
Figure 1.
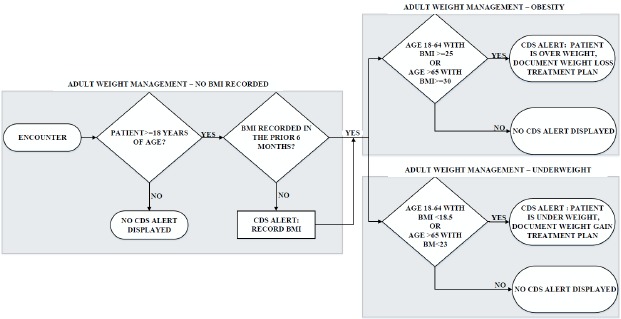
CDS Alert logic.
The first alert (“BMI not recorded”) prompted clinicians to record BMI for patients age 18 years or older who did not have a recorded BMI in the prior 6 months (Figure 2).
Figure 1.

Screenshot of alert: BMI not recorded.
For patients who did have a BMI recorded during the prior 6 months, the second alert (“Overweight, document follow- up plan”) identified patients aged 18-64 whose most recent BMI recording during the prior 6 months was >= 25 and patients of age>65 years with BMI >=30 and prompted clinicians to document a weight loss plan (Figure 3).
Figure 3.

Screenshot of alert: Overweight, document follow-up plan
The third alert (“Underweight, document follow-up plan”) identified patients aged 18-64 whose most recent BMI recording during the prior 6 months was <18.5 and patients of age>65 years with BMI <23 and prompted clinicians to document a weight gain plan (Figure 4).
Figure 4.

Screenshot of alert: Underweight, document follow-up plan
In the PF-EHR, BMI is auto-calculated when height and weight are documented in the vitals area of the patient chart, so for this study, BMI documentation equates to documentation of height and weight. In addition, documentation of a BMI related follow-up plan was counted when a clinician indicated in the assessment area of the patient chart that they performed one of two follow-up plans: “Calculated BMI above normal parameters and a follow-up plan was documented” or “Calculated BMI below normal parameters and a follow-up plan was documented”. The list of follow-up plans that clinicians could choose from were BMI follow-up plans available in the PF-EHR as a structured data associated to SNOMED concepts: weight control education (procedure), nutrition counseling, nutrition supplement (dietary) therapy, peripherally acting anti-obesity drug, counseling about physical activity (exercise), referral to weight maintenance regimen service, bariatric operative procedure (surgery), and next appointment.
The CDS logic for all three alerts excluded pregnant women, patients who received palliative care, refused BMI measurement, were in an urgent or emergent medical situation where time was of the essence and to delay treatment would jeopardize the patient’s health status, or any other reason documented in the medical record by the clinician explaining why BMI measurement was not appropriate during the timeframe.
Measuring Effectiveness
Test (4,987 practices, 33,445 clinicians) and control groups (881 practices, 6,316 clinicians) were selected prior to the program using a stratified random sampling method at the practice level. Eligible practices (5,871) were chosen based on history of patients meeting the CDS alert criteria (previous patients with BMI recorded and previous diagnosis of obesity). Practices were then stratified on all combinations of the following: tertiles of number of active patients per practice, tertiles of total visits by patients, tertiles of BMI values, tertiles of counts of BMI Screening/Intervention/Assessments, tertiles of visits by patients diagnosed with obesity, tertiles of number of MDs and NPs per practice and specialties (PCPs (Family Medicine, Internal Medicine, and General Practice), Obstetrics and Gynecology, Endocrinology), geographic region (West, Southwest, Midwest, Southeast, and Northeast). 15% of practices from each stratum were randomly selected for inclusion into the control group (strata combinations with less than 5 practices were combined and randomly sampled). The remaining practices comprised the test group.
Non-parametric Mann-Whitney tests were performed for continuous parameters and Chi-squared tests for categorical parameters to evaluate test and control group similarity. High p-values indicated that the control group adequately represented the test group (total visits by patients with a BMI captured (p=0.99), count of BMI follow-up plans documented (p=0.95), patients aged 65+ with low BMI (p=0.94), patients aged 65+ with normal BMI (p =0.88), visits by patients diagnosed with obesity (p=0.58), specialty (p=0.72), number of MD/NP clinicians per practice (p=0.99), number of active patients per practice (p=0.86)).
Test and control practices were monitored through a baseline period from 8/1/2014 to 11/30/2014 and through the CDS alerts program period from 12/1/2014 to 3/31/2015. CDS alerts were not shown to the control group, however visits where the CDS criteria were met were recorded for comparison. Percentage of visits for BMI recorded for visits where alerts shown (test group)/alerts should have shown (control group) were calculated and compared for the program period. The study did not continue past 4 months due to changes of the BMI documentation user-interface on the PF-EHR platform which changed the conditions of the study.
Results
During the 4 month program period, of the 39,761 clinicians in our program (33,445 test, 6,316 control), 11,123 clinicians were alerted. The alerted clinicians saw 1,154,304 distinct patients (981,155 test, 173,149 control) over 3,226,031 visits (2,766,603 test, 459,428 control). “BMI not recorded” was displayed to 8,856 clinicians and 285,947 patients, over 779,508 visits. Overall, percentage of visits with recorded BMI were equivalent between the test and control group (53.0% vs 53.6%, p=0.36, Figure 5).
Figure 5.
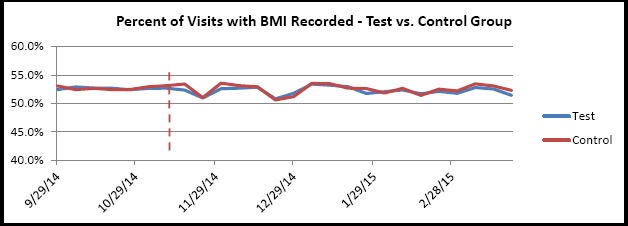
Percent of Visits with BMI Recorded - Test vs. Control Group
However, for the subset of visits that were shown (test group) or were eligible for (control group) the “BMI not recorded” alert, there was a significantly higher percentage of visits with recorded BMI in the test group than the control group (27.9% vs 12.1%, p < 0.01, Figure 6).
Figure 6.
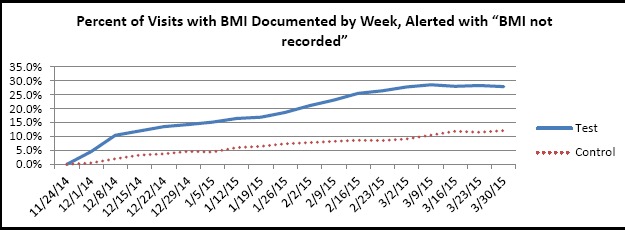
Percent of visits with BMI documented by week alerted with “BMI not recorded”.
“Overweight, document follow-up plan” was displayed to 10,018 clinicians, attributed to 837,721 patients over 2,713,986 visits. 9.8% of alerted patients (82,170 patients) had a follow-up plan documented in the program period. Documentation of follow-up plan for overweight patients increased by a factor of 5 for most of the program period compared to the baseline period in the test group (Figure 7). A smaller factor increase was observed in the test group between 12/11/14 and 1/11/15 attributed with a decrease of office visits during the winter holiday. The control group had no change BMI documentation of follow-up plan for BMI between the baseline and program period.
Figure 5.
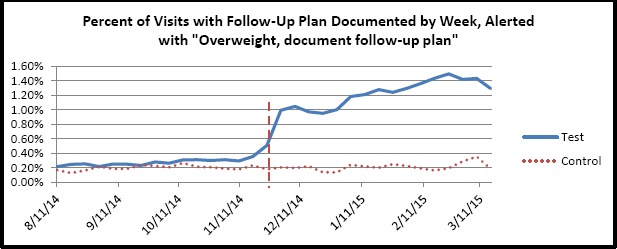
Percent of visits with follow-up plan documented by week alerted with “Overweight, document follow-up plan”
“Underweight, document follow-up plan” was displayed to 7,036 clinicians, attributed to 92,309 patients over 311,382 visits. 7.7% of alerted patients (7160 patients) had a follow-up plan documented in the program period. Documentation of follow-up plan for underweight patients increased by a factor of 5 for most of the program period compared to the baseline period in the test group (Figure 8). A smaller factor increase was observed in the test group between 12/11/14 and 1/11/15 attributed with a decrease of office visits during the winter holiday. The control group had no change BMI documentation of follow-up plan for BMI between the baseline and program period for the control group.
Figure 5.
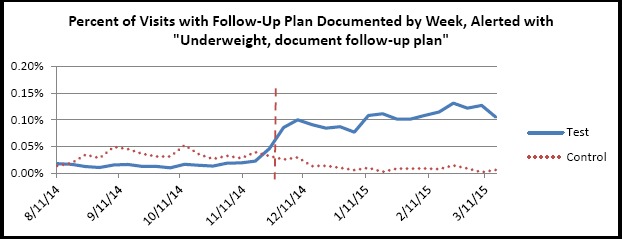
Percent of visits with follow-up plan documented by week alerted with “Underweight, document follow- up plan”
Overall percent of visits with documented follow-up plans for abnormal BMI increased in the test group in the program period compared to the baseline period (1.24% vs 0.29%, p<0.01). The control group showed no difference in percent of visits with documented follow-up plans (0.26% vs 0.22%, p=0.80, Figure 9).
Figure 9.
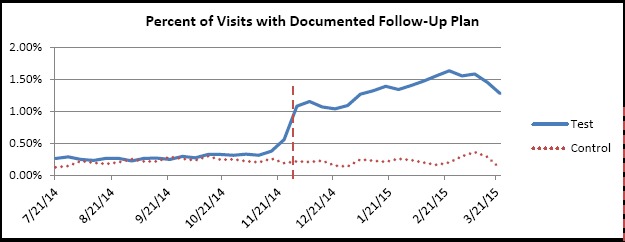
Percent of visits with documented BMI follow-up plan by week.
Weight control education (procedure), nutrition counseling, and nutrition supplement (dietary) therapy were the top three Follow-up plans documented (Table 1).
Table 1.
Type of Follow-Up Plans documented for Abnormal BMI.
| Follow-Up Plans | ControlGroup %(4 months) | TestGroup%(4 months) |
|---|---|---|
| Weight control education (procedure) | 52.0% | 61.6% |
| Nutrition counseling | 40.7% | 27.6% |
| Nutrition supplement (dietary) therapy | 5.4% | 7.2% |
| Peripherally acting anti-obesity drug | 1.1% | 2.2% |
| Counseling about physical activity (exercise) | 0.1% | 0.6% |
| Referral to weight maintenance regimen service | 0.4% | 0.5% |
| Bariatric operative procedure (surgery) | 0.2% | 0.4% |
| Next Appointment | 0.0% | 0.0% |
Patient Outcomes:
Differences in patient BMI recorded at the start of the program and the end of the program were examined for patients with visits that were alerted and that had at least one BMI recorded between 12/1/2014 and 12/31/2014 and at least one BMI recorded between 2/1/2015 and 3/31/2015. The first BMI recorded between 12/1/2014 and the last BMI recorded between 2/1/2014 and 3/31/2015 were compared.
Table 2 compares the impact of follow-up plans during the four-month follow-up period between the test and control groups. While the patients (18-64 years) in the test group did not lose weight, there is weak evidence that they gained less weight during the follow-up period than the control group (p=0.06). There was no significant difference in weight change for patients 65+ (p=0.40). While underweight patients (18-64 years and 65+) gained significantly more weight than those in the control group (p<0.01, p=0.02).
Table 2.
Percent changes in BMI for patients that had a recorded BMI at the beginning and end of the program:
| Patient Category | % Weight Change in Test Group | % Weight Change in Control Group | p-values |
|---|---|---|---|
| Overweight patients aged 18-64 years | + 0.02% SD=4.93 | +0.32% SD=4.11 | P=0.06 |
| Underweight patients aged 18-64 years | +3.98% SD=17.85 | -0.82% SD=3.12 | P<0.01 |
| Overweight patients aged 65 years and older | -0.41% SD=4.43 | -0.49 SD=4.39 | P=0.40 |
| Underweight patients aged 65 years and older | +0.79% SD=8.7 | -2.79%SD=8.56 | P=0.02 |
Discussion
Though we observed a small increase in BMI recorded for visits that received the “BMI not recorded” alert, the overall percentage of visits with a documented BMI did not change significantly. This suggests that the “BMI not recorded” alert is not as effective at a population level. However, the significant increase in percentage of documentation of follow-up plans indicate that follow-up plan alerts were effective in altering clinician behavior. Our study had a few limitations. Firstly, the follow-up period was relatively short. Although the follow-up period was short, we did see improved patient outcomes. Further studies with a longer follow-up periods are needed to confirm the positive outcomes. Secondly, test and control groups were chosen based on practice criteria. Future studies controlling better for patient demographics characteristics (such as more granular geography, age, socioeconomic characteristics, genomic traits, and co-morbidities) would provide additional insight on patient outcomes.
Conclusion
CDS systems are increasingly being adopted by the medical community to help clinician compliance with evidence based guidelines and best practices with the intent of improving patient outcomes. This study has shown that CDS systems can be an effective tool to help clinicians follow weight management clinical guidelines and improve patient outcomes.
References
- 1. https://www.cdc.gov/obesity/data/adult.html.
- 2.Finkelstein EA, Khavjou OA, Thompson H, et al. Obesity and severe obesity forecasts through 2030. American Journal of Preventive Medicine. 2012;42:563–570. doi: 10.1016/j.amepre.2011.10.026. [DOI] [PubMed] [Google Scholar]
- 3.[PDF]Management of Overweight and Obesity in Adults - National Heart. Available from: https://www.nhlbi.nih.gov/sites/www.nhlbi.nih.gov/files/obesitv-evidence-review.pdf.
- 4.[PDF]Clinical Guidelines on the Identification - National Heart, Lung, and. Available from: https://www.nhlbi.nih.gov/files/docs/guidelines/ob_gdlns.pdf.
- 5. https://www.cdc.gov/healthvweight/assessing/bmi/adult_bmi/index.html.
- 6.U.S. Preventive Services Task Force. Screening for obesity in adults: recommendations and rationale. Ann Intern Med. 2003 Dec 2;139(11):930–2. doi: 10.7326/0003-4819-139-11-200312020-00012. [DOI] [PubMed] [Google Scholar]
- 7.Felix H, West DS, Bursac Z. Impact of USPSTF practice guidelines on clinician weight loss counseling as reported by obese patients. Prev Med. 2008 Oct;47(4):394–7. doi: 10.1016/j.ypmed.2008.06.002. [DOI] [PubMed] [Google Scholar]
- 8.Kawamoto K, Houlihan CA, Balas EA, Lobach DF. Improving clinical practice using clinical decision support systems: a systematic review of trials to identify features critical to success. BMJ. 2005 Apr 2;330(7494):765. doi: 10.1136/bmj.38398.500764.8F. [DOI] [PMC free article] [PubMed] [Google Scholar]
- 9.Jaspers MWM, Smeulers M, Vermeulen H, Peute LW. Effects of clinical decision-support systems on practitioner performance and patient outcomes: a synthesis of high-quality systematic review findings. J Am Med Inform Assoc. 2011 May 1;18(3):327–34. doi: 10.1136/amiajnl-2011-000094. [DOI] [PMC free article] [PubMed] [Google Scholar]
- 10.Baer HJ, Wee CC, DeVito K, Orav EJ, Frolkis JP, Williams DH, et al. Design of a cluster-randomized trial of electronic health record-based tools to address overweight and obesity in primary care. Clin Trials. 2015 Aug;12(4):374–83. doi: 10.1177/1740774515578132. [DOI] [PMC free article] [PubMed] [Google Scholar]
- 11.[PDF]NQF #0421 Preventive Care and Screening: Body Mass Index (BMI. Available from: https://www.qualitvforum.org/WorkArea/linkit.aspx?LinkIdentifier=id&ItemID=71112.


