

Abstract
Advanced regression and machine learning models can provide personalized risk predictions to support clinical decision-making. We aimed to understand whether modeling methods impact the tendency of calibration to deteriorate as patient populations shift over time, with the goal of informing model updating practices. We developed models for 30-day hospital mortality using seven common regression and machine learning methods. Models were developed on 2006 admissions to Department of Veterans Affairs hospitals and validated on admissions in 2007-2013. All models maintained discrimination. Calibration was stable for the neural network model and declined for all other models. The L-2 penalized logistic regression and random forest models experienced smaller magnitudes of calibration drift than the other regression models. Calibration drift was linked with a changing case mix rather than shifts in predictoroutcome associations or outcome rate. Model updating protocols will need to be tailored to variations in calibration drift across methods.
Introduction
Risk prediction models are developed across clinical domains1-6 to support patient and provider decision-making, adjust quality metrics for acuity, and augment enrollment strategies for clinical trials1, 5. Although model validations have traditionally focused on discrimination, calibration is increasingly recognized as an essential aspect of model accuracy, particularly when models support individual-level patient decision-making1, 7, 8. With the adoption of electronic health records and use of advanced modeling methods, the role of clinical prediction models and our understanding of the challenges presented by the incorporation of predictive analytics into clinical care are rapidly evolving1, 9-11. One such challenge is deterioration of model calibration as characteristics of patient populations shift over time6, 12-15. Limited evidence is available regarding how such calibration drift may vary across advanced regression and machine learning models, and how modeling methods may impact the need for routine model updating.
Mortality within 30-days of hospital admission, a key metric of hospital quality and patient safety, is assessed and tracked by the Centers for Medicare and Medicaid Services (CMS) to both inform the public and, since 2013, to adjust reimbursements16. CMS quality metrics rely on prediction models to standardize mortality rates by adjusting for the case mix of each hospital’s patient population16. In addition to quality benchmarking, prediction models for hospital mortality may be used to support decision-making particularly in the critical care setting. Numerous prediction models for hospital mortality have been presented in the literature2, and external validations have documented deteriorating calibration over time for many of these models13, 14, 17-19. While advanced regression and machine learning methods have been implemented for mortality prediction20-22, studies of calibration drift have primarily focused on logistic regression models and crude measures of average calibration. We sought to extend this existing literature through consideration of additional modeling methods, more stringent assessments of calibration, and systematic quantitative evaluations of the population data shifts driving performance changes.
Methods
We accessed data on eight years (2006-2013) of admissions to Department of Veterans Affairs hospitals nationwide with corresponding pre-admission data from 2002 for admitted patients, and randomly selected 50% of the sites within each Veterans Integrated Service Network for inclusion in this analysis. We modeled 30-day all-cause mortality after hospital admission using a predictor set developed through review of previously published risk models2, 23-25. Predictors were extracted from the national Corporate Data Warehouse26 and included demographics, vital signs during the first 48 hours of admission, laboratory values during the first 48 hours of admission, and diagnoses codes, medications, and care utilization prior to admission. Admissions were excluded if the patient was under 18 years of age, discharged to hospice care, admitted for less than 48 hours, or lacked 30-days of available follow-up (i.e., admitted in the last 30 days of 2013).
Admissions beginning in 2006 served as our training set and admissions beginning in 2007-2013 served as our validation set. Using the common training data and predictors set, we developed seven parallel models for hospital mortality based on logistic regression (LR), L-1 penalized logistic regression (L1; i.e., lasso), L-2 penalized logistic regression (L2; i.e. ridge), L-1/L-2 penalized logistic regression (L1-L2; i.e., elastic net), random forest (RF), neural networks (NN), and naïve Bayes (NB)27. For those models requiring tuning (i.e., L1-L2, NN, RF), hyperparameters were selected with 5-fold cross-validation. Each model was internally validated with the bootstrap (B=200) using only admissions in the training set (2006 admissions). We divided the 7-year validation set into consecutive 3-month periods (n=28) and assessed performance of the models within each. Discrimination was measured with the area under the receiver operating characteristics curve (AUC)28. Calibration was measured with observed to expected outcome ratios (O:E), the Cox logistic recalibration model’s intercept and slope, and flexible calibration curves29, 30. The most stringent measure of calibration in this study, flexible calibration curves assess calibration across the range of probabilities by fitting a logistic model for the observed outcome based on predicted probabilities fit with a restricted cubic spline29. We summarized these calibration curves with the estimated calibration index (ECI; the mean squared difference between predicted probabilities and estimated observed probabilities from the flexible calibration curves)29 and by regions of predicted probability where the model was calibrated, overpredicted, or underpredicted (i.e., ranges of probability over which the confidence interval of the flexible calibrations curve captured the 45° line of perfect agreement, was below the line, or was above the line were labeled as regions of calibration, overprediction and underprediction, respectively). In addition, we calculated within-region ECIs and rescaled each region by the volume of observations with predictions in its range. This proportional regional volume assessment emphasized calibration status based on data density and ranges of probability most relevant to the observed data.
We also characterized data shifts in the patient population to link any changes with model performance over time. We documented shifts in the mortality rate and in the distribution of each predictor across the study period. Case mix changes were further assessed by fitting membership models in each 3-month validation period. Membership models are prediction models aimed at discriminating between validation and development observations using the outcome and predictor set from our original model to determine whether case mix shift is present and identify variables contributing to such shift31. We refit the LR, L1, and RF models in each 3-month validation period to explore shifts in the strength of associations between predictors and 30-day mortality. Any changes in association were documented as changes in LR odds ratios, L1 variable selection patterns, and RF variable importance ranks.
All analyses were conducted in R 3.2. This study was approved by the Institutional Review Board and the Research and Development committee of the Tennessee Valley Healthcare System VA.
Results
Nationwide, 3,467,142 admissions to VA facilities met all eligibility criteria for our 30-day all-cause mortality models. Restricting to admissions from the randomly selected sites, our analysis set included 1,893,284 admissions (54.6% of all eligible admissions), 235,548 in the 2006 development set and 1,657,736 in the 7-year validation set. The final validation set (i.e., 2013-Q4) was smaller than the other validation set (n=37,442) as it was restricted to admissions beginning on or before December 1, 2013 to allow for sufficient follow-up time for outcome ascertainment. The remaining 27 validation sets consisted of 60,011 admissions on average (range 57,367 – 62,139). A brief summary of the patient population at select points across the study period is presented in Table 1. Admitted patients were primarily male (95.0%), white (72.1%), in their early 60s (mean age: 63.4; standard deviation: 14.0), and diagnosed with at least one chronic medical condition (93.9% diagnosed with one condition, 86.8% diagnosed with multiple conditions). Overall, the 30-day all-cause mortality rate after admission was 4.9%.
Table 1:
Patient population at development (2006) and during three validation year
| 2006 | 2007 | 2010 | 2013 | |
|---|---|---|---|---|
| N | 235,548 | 235,734 | 243,631 | 214,798 |
| % 30-day mortality | 5.0 | 4.9 | 4.9 | 4.7 |
| Age in years (mean and SD) | 62.9 (13.7) | 63.0 (13.8) | 63.6 (14.0) | 63.9 (14.3) |
| % Female | 4.5 | 4.7 | 4.9 | 5.5 |
| Race | ||||
| % White | 71.7 | 71.6 | 72.3 | 72.1 |
| % Black | 19.8 | 20.0 | 19.6 | 19.8 |
| % American Indian/Alaskan | 1.3 | 1.4 | 1.5 | 1.6 |
| % Asian/Pacific Islander | 1.1 | 1.2 | 1.2 | 1.3 |
| % Unreported | 6.0 | 5.9 | 5.5 | 5.3 |
| BMI at admission (mean and SD) | 28.2 (7.1) | 28.3 (7.3) | 28.7 (7.2) | 28.8 (7.1) |
| Health care utilization (prior year) | ||||
| Inpatient visits (mean and SD) | 1.3 (2.0) | 1.3 (2.0) | 1.3 (2.0) | 1.3 (2.1) |
| Outpatient visits (mean and SD) | 36.4 (43.6) | 37.1 (43.3) | 42.0 (48.2) | 43.5 (48.9) |
| Select diagnoses (preadmission) | ||||
| Chronic pulmonary disease | 28.4 | 32.4 | 38.5 | 41.2 |
| Congestive heart failure | 17.3 | 19.1 | 22.0 | 23.7 |
| Depression | 20.1 | 24.5 | 32.6 | 38.4 |
| Dyslipidemia | 41.8 | 49.6 | 61.5 | 66.4 |
| Hypertension | 61.7 | 67.4 | 74.2 | 76.4 |
| Renal failure | 12.3 | 15.3 | 19.5 | 21.9 |
Initial performance of each of the seven models is presented in Table 2. Due to large sample sizes, the confidence intervals are narrow for all measures. Discrimination was generally good, with AUCs ranging from 0.768 to 0.847. The NN and NB models had slightly lower AUCs that the regression and RF models. The regression models and the NN model were calibrated based on both O:E ratios and ECIs. The RF model, with an O:E ratio of 0.929 (95% CI: 0.927, 0.931), slightly overpredicted on average. The NB model lacked calibration due to strong overfitting.
Table 2:
Initial model performance with 95% confidence intervals
| Regression | Machine Learning | ||||||
|---|---|---|---|---|---|---|---|
| LR | L1 | L2 | L1-L2 | RF | NN | NB | |
| Discrimination | |||||||
| AUC | 0.847 [0.846, 0.847] |
0.844 [0.844, 0.844] |
0.842 [0.841, 0.842] |
0.844 [0.844, 0.844] |
0.834 [0.833, 0.834] |
0.794 [0.794, 0.795] |
0.768 [0.768, 0.769] |
| Calibration | |||||||
| O:E ratio | 0.998 [0.996, 1.001] |
0.998 [0.996, 1.001] |
0.998 [0.996, 1.001] |
0.998 [0.996, 1.001] |
0.929 [0.927, 0.931] |
0.997 [0.993, 1.00] |
0.339 [0.338, 0.340] |
| Cox intercept | −0.048 [−0.055, −0.042] |
0.088 [0.080, 0.096] |
0.215 [0.207, 0.223] |
0.096 [0.088, 0.105] |
0.074 [0.065, 0.082] |
−0.122 [−0.133, −0.112] |
−2.548 [−2.551, −2.546] |
| Cox slope | 0.980 [0.977, 0.982] |
1.039 [1.036, 1.042] |
1.093 [1.090, 1.096] |
1.043 [1.040, 1.046] |
1.072 [1.069, 1.076] |
0.951 [0.947, 0.955] |
0.113 [0.113, 0.114] |
| ECI | 0.013 [0.013, 0.014] |
0.010 [0.010, 0.010] |
0.011 [0.010, 0.011] |
0.010 [0.010, 0.010] |
0.034 [0.033, 0.034] |
0.008 [0.007, 0.008] |
7.783 [7.758, 7.808] |
Model Performance Over Time
We observed stable discrimination for all models over the 7-year validation period (Bonferroni adjusted p<0.001; Figure 1). The regression and RF models had comparable AUCs and maintained higher discrimination than the NB and NN models, which exhibited similar levels of discrimination.
Figure 1:
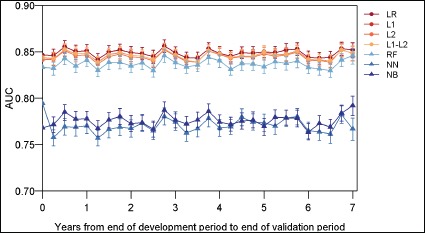
Model discrimination (AUC) over time.
We observed calibration drift over time for all models, with the magnitude and pattern of drift varying by modeling method and calibration metric (Figure 2). The NB model substantially underperformed all other models in terms of calibration due to extreme predictions, and thus the calibration of this model is not considered further.
Figure 2:
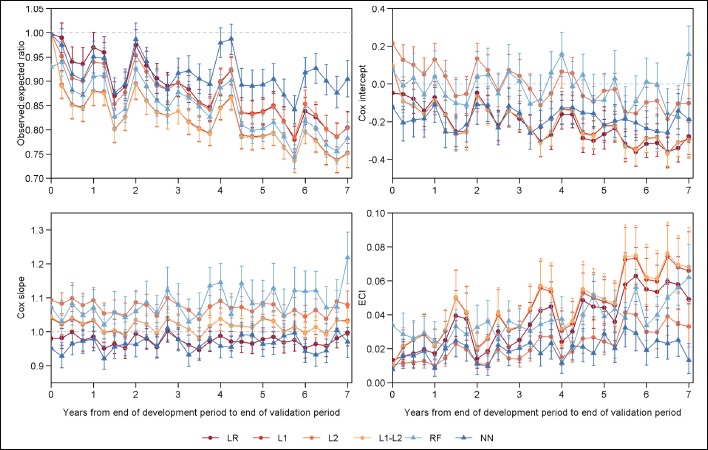
Model calibration over time. Reference values indicating perfect calibration shown with dotted grey lines.
The O:E ratio (ideal value: 1) declined immediately after development and across the study period for all models, indicating increasing average overprediction. At the first 3-month validation period, O:E ratios included the ideal values of 1.0 for only the NN and LR models. These two models achieved calibration according to the O:E ratio at two to four additional time points, however, overpredicted on average for most of the validation period. The trajectory of the O:E ratio was similar for most models, with the exception of the NN model which did not exhibit a significant slope in the O:E ratio over time (Bonferroni adjusted p<0.001). The NN model demonstrated significantly less overprediction than the RF and regression models, particularly in the last three years of the validation period. In addition to the overall drift, a seasonal pattern was apparent in the O:E ratios. In the first and fourth quarters of most validation years, 0:E ratios peaked for all models.
The Cox logistic recalibration intercept (ideal value: 0) and slope (ideal value: 1) also noted different patterns of drift across modeling methods. The Cox intercept declined across the validation period for each of the regression models, indicating increasing overprediction, while remaining stable for the RF and NN models (Bonferroni adjusted p<0.001). The L2 model exhibited a smaller decline in the Cox intercept over time than the other regressions. The RF model did not systematically over or underpredict in most (24 of 28) validation periods, and the NN model systematically overpredicted to a stable degree for the entire study period. Additionally, we observed a seasonal pattern in the Cox intercept similar to that of the O:E ratio, although to a lesser degree. Cox slopes were stable over time (Bonferroni adjusted p<0.001). No significant overfitting was observed for the LR, L1, and L1-L2 regression models. The L2 regression and RF models exhibited some underfitting (i.e., Cox slope>1.0). This underfitting was consistent over time for the L2 regression model and demonstrated a nonsignificant tendency toward increasing for the RF model. The NN model had Cox slopes less than 1, indicating overfitting; however, there was no significant change over time.
Measuring calibration more stringently with flexible calibration curves, we observed drift among the regression and RF models, and stable overall calibration with some seasonal variation for the NN model. ECIs (ideal value: 0) of the regression and RF models increased across the validation period (Bonferroni adjusted p<0.001), indicating declining calibration, and exhibited no changes in the trajectory or rate of ECI drift during the seven validation years. The L2 regression model experienced a smaller magnitude of drift in the ECI compared to the other regression models and a similar magnitude of drift to the RF model. Compared to the L2 regression and RF models, the rate of change in ECI was 50% higher for the LR model (0.006 [95% CI: 0.005, 0.008] vs 0.004 [95% CI: 0.003, 0.005] and 0.004 [95% CI: 0.002, 0.005] for the LR vs L2 and RF, respectively) and 75% higher for the L1 and L1-L2 models (0.007 [95% CI: 0.006, 0.009] for both). For each model, seasonal corrections of the ECI were generally observed in the first and fourth quarters of each year. ECI was stable over time for the NN model (Bonferroni adjusted p<0.001). Although not significantly different from the surrounding time periods, in most validation years, the ECI of the NN model was markedly lower (i.e., closer to the ideal value of 0) during the first and fourth quarters of most years.
The ranges of predicted probabilities and proportion of admissions over which each model was calibrated also changed over time and varied by modeling method (see Figure 3). With the exception of the NB model, which strongly overpredicted for most predicted probabilities, each model moved in and out of regions of calibration, overprediction, and underprediction across the range of predicted probabilities. The RF model was the only model with a large range of probabilities over which it strongly underpredicted. During the first half of the validation period, the L2 regression model tended to be calibrated for predictions in the 50% to 90% ranges. The remaining models and the L2 regression model during the second half of the validation period tended to strongly overpredict for predicted probabilities starting at approximately 20%. For each regression model, across the validation period the proportional volume assessment (Figure 4) indicated that nearly half of admissions were in regions of overprediction, with the proportion increasing slowly over time. The majority of these admissions were minimally overpredicted, falling in areas with regional ECI values near the ideal value of 0, as highlighted by the lightest blue shades in Figure 4. For example, in the LR model, a low risk region of overprediction captured at least 40% of admissions in each 3-month validation period and had a mean ECI of 0.005 (range: 0.002 – 0.009). Each of the regression models also experienced growth in an overpredicted region with a larger magnitude of miscalibration among higher predicted probabilities. For the FI and F1-F2 regression models, the vast majority of admissions were strongly overpredicted in the last year of the study period. The overpredicted region of the RF model captured a growing proportion of admissions over time and increased modestly in the magnitude of overprediction across the validation period. The proportional volume analysis highlighted a seasonal pattern in the calibration of the NN model for admissions with predicted probabilities under 3%. On average, 61.3% of all admissions were in this low risk region for which the NN model was calibrated during the first and fourth quarters of most years and minimally overpredicted during the second and third quarters.
Figure 3:
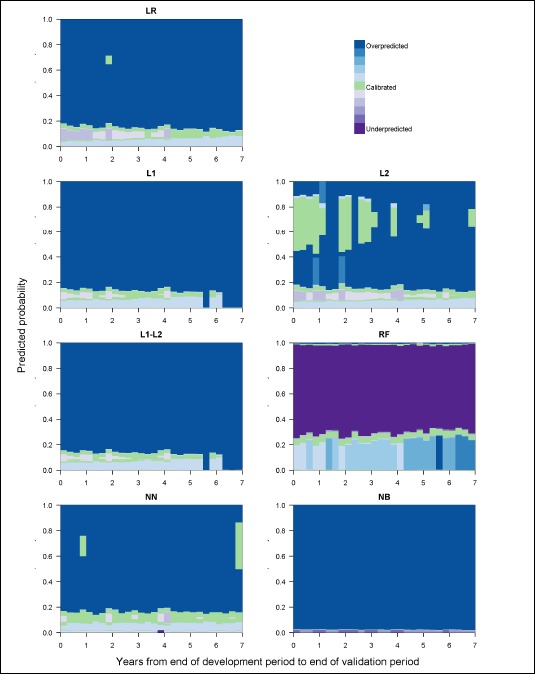
Model calibration over time, measured by regions of calibration and shaded by the magnitude of the within region ECI.
Figure 4:
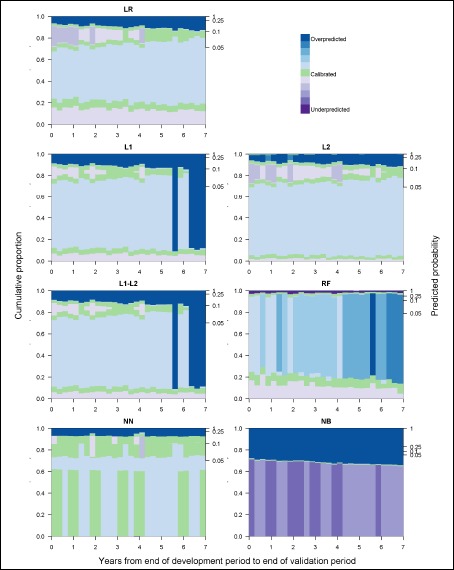
Model calibration over time, measured by regions of calibration scaled by proportion of observations in each region and shaded by the magnitude of the within region ECI.
Data Shifts in the Patient Population Over Time
Over the 7-year validation period, there was a statistically significant decline in the 30-day mortality rate (Bonferroni adjusted p<0.0003); however, this change was small, declining from 5.0% in the 2006 development year to 4.8% in the final validation period. Seasonal fluctuations within each validation year were three times larger than the overall change in the mortality rate (mean within year change: 0.6%; overall change: 0.2%). Compared to predictor variables, the outcome was relatively unimportant in RF membership models aimed at distinguishing validation and development observations. The variable importance rank of 30-day mortality declined from 59 to 63 out of 67 over the first validation year and was stable at a mean of 63 (range: 52 – 64) over the next 6 years.
We observed case mix shift across the validation period. Distributions of predicted probabilities generally indicated increasing severity and heterogeneity of risk in the patient population over time (Bonferroni adjusted p<0.002). Membership models also noted the presence of case mix shift, with the logistic membership models increasingly discriminating between admissions from the development and each sequential validation set as the AUC increased from 0.616 (95% CI: 0.613, 0.618) to 0.836 (95% CI: 0.834, 0.839) over the seven validation years. We observed changes in the distributions of 94.5% of predictors during the study period (Bonferroni adjusted p<0.0003). The proportion of admissions to black patients, that were planned, and that were unplanned but not readmissions did not change over time. In addition, the mean of the most recent blood urea nitrogen level was constant over. Changes in vital signs, laboratory values, and body mass index were generally small in magnitude. The forms of these changes were variable, with some having an inflection points at three to four years after model development. The largest changes were observed among the health history variables. With the exception of HIV, which declined by less than 0.5%, the proportion of admissions involving patients with each health condition increased across the validation period. The rates of these increases were generally constant over time. Among health history variables, the largest changes over time occurred for dyslipidemia (41.8% to 66.8%), fluid and electrolyte disorders (19.0% to 38.9%), and depression (20.1% to 39.9%), while the smallest change was observed for lymphoma (1.2% to 1.6%).
Changes in the strength of associations between predictors and 30-day mortality were measured by changes in the structure of models refit in each 3-month validation period. For the majority of predictors, we observed no temporal changes in association. Odds ratios from LR models refit in each 3-month validation period generally remained within the confidence intervals of the odds ratio from the original model based on 2006 data. However, a few variables exhibited a non-significant tendency toward strengthening or weakening associations. For some laboratory values, such as chloride and sodium levels during admission, odds ratios were less stable, moving in and out of significance in both directions of association. In L1 regression models refit over time, we observed significant temporal changes in selection patterns for two predictors (Bonferroni adjusted p<0.0004): history of liver disease and mean corpuscular hemoglobin concentration during the admission window. The frequency of selection for inclusion in L1 regression models began to decline starting approximately two years after development for both predictors. The magnitude of decline in selection frequency was larger for liver disease, which was selected in 98.0% of bootstrapped models at development and in 44.5% of models in the final validation period. Refitting RF models in each 3-month validation period revealed temporal changes in variable importance ranking for three predictors (Bonferroni adjusted p<0.0004): history of depression, history of dyslipidemia, and serum creatinine during the admission window. Ranks increased from 51 to 43 for depression and 29 to 17 for creatinine. The variable importance rank of dyslipidemia was steady through the first five years and then declined from 39 to 50 over the last two years of the validation period.
Discussion
In repeated validations over seven years, we observed varying patterns of performance among regression and machine learning models for 30-day all-cause mortality after hospital admission. Among all models, discrimination was stable over time. With the exception of the NN model, calibration drifted across the entire validation period as all other models increasingly overpredicted risk. Seasonal changes in the mortality rate were correlated with cyclical fluctuations in the calibration of all models, including the NN model despite its maintaining stable calibration overall. Case mix shift dominated temporal changes in the patient population. Taken together with the observed calibration drift, the data shift assessments highlight robustness of the NN model, moderate susceptibility of the RF and L2 regression models, and high susceptibility of the other regression models to case mix shift.
Our findings of stable discrimination and increasing overprediction over time are consistent with previous studies of performance drift in logistic hospital mortality models13, 14, 17-19. While most prior work focused on logistic regression models, Minne et al14, 32 provide a comparison of calibration drift between corresponding logistic regression and treebased rSAPS-II models for mortality among elderly ICU patients. Based on O:E ratios, the logistic rSAPS-II experienced increasing levels of overprediction within four years of development, while the tree-based rSAPS-II demonstrated stable calibration14, 32. Although we did not observe differences in calibration drift between our logistic and RF models based on the O:E ratios, our RF model did experience a smaller magnitude of deterioration in the more stringent ECI metric compared to our logistic regression model.
Performance drift is driven by changes in the prevalence of an outcome, patient case mix, and associations between predictors and outcomes3, 5, 6, 13, 15, 31. In our cohort, we detect limited evidence of predictor-outcome association shifts and observed primarily seasonal changes in the mortality rate. Seasonal event rate shift was correlated with a cyclical pattern in calibration. However, with the exception of the NN model, our models experienced calibration drift across the validation period that could not be explained by the seasonal variation in the mortality rate alone and is likely, therefore, associated with the documented changes in patient case mix. The stability of calibration of the NN model suggests this method is robust to case mix changes, at least to the extent seen in our cohort. The Cox recalibration model and flexible calibration curves indicated less deterioration in calibration over time for the L2 regression and RF models compared to the LR, L1, and L1-L2 regression models. The basic logistic regression and penalized regression methods that include variable selection, therefore, appear to be the most susceptible methods to calibration drift in the presence of case mix shift, while the L2 regression and RF models appear to be moderately susceptible, falling between the other regression approaches and the NN model. Additionally, we note that case mix shifts leading to changes in the variability of risk in the patient population have been previously noted to be of particular concern for discrimination drift, as patients become more difficult to distinguish or more easily separable as they become more homogenous or more heterogeneous, respectively31. Although we observed increased heterogeneity of risk among admissions over time, we did not observe drifting discrimination. This may indicate that the degree of change in the variability of the risk in this cohort was not sufficient to trigger discrimination drift.
An important limitation in interpretation of modeling performance over time in real-world data is that different patterns of data shifts could result in differential model performance. We previously executed a separate study in which we explored calibration drift and data shifts in the clinical domain of hospital-acquired acute kidney injury33. Diverging patterns of calibration drift between regression and machine learning methods were observed in both studies. Our current study extends and complements our previous findings by revealing disparate patterns of calibration drift across modeling methods in the presence of distinctive combinations of data shifts. For both clinical domains, the calibration of all models was susceptible to shifting event rates. While we did not observe predictor-outcome association shifts in our 30-day mortality cohort, association shifts in the acute kidney injury population temporally coincided with diverging patterns of calibration drift between regression and machine learning models. While case mix shift was observed in both study populations, the dominance of this form of data shift in our 30-day mortality population allows us to link case mix shift with differences in calibration drift between across modeling methods. Synthesizing findings across both studies, we found RF and NN models are generally less susceptible to case mix and association shifts than regression models, with the exception of the L2 regression model in the presence of case mix shift. Our findings in this work inform which methods may be most useful for modeling hospital mortality in changing environments and highlight both the variable updating needs of different modeling approaches and the influence of particular combinations of data shifts on our understanding of model susceptibility to deteriorating performance. As model performance patterns emerge among different data, understanding similarities in the assessed domains and a future domain of interest can assist in calibration maintenance.
Our findings have important implications for the integration of prediction models into clinical decision support tools and the design of model updating protocols. With the exception of the NN model, calibration drift impacted all models and began shortly after model development. Miscalibration of risk predictions can be harmful, potentially leading to inappropriate changes in treatment selection, anxiety, over-confidence, or inefficient allocation of limited clinical resources1, 7, 8, 13. Lack of calibration may also mislead benchmarking assessments of facility quality14. Calibration drift must, therefore, be addressed with routine model updating through recalibration, full model revision (i.e., refitting), or even model extension with the incorporation of new predictors3, 6, 34. The form of population data shifts and performance drift should drive the timing and approach to model updating. We recommend implementation of active surveillance tools to track model performance and characterize changes in patient populations over time in order to trigger model updating and inform updating approaches. As our findings highlight, models based on different methods will have different updating requirements. We thus further recommend that the updating protocols built into such surveillance systems be tailored to modeling methodologies and support flexibility in timing of updates rather than being restricted to regularly scheduled intervals.
There were some limitations in this work. In this analysis, we consider model performance under a particular combination of data shifts; however, other combinations of data shifts in patient populations, including different forms and extents of shift, may expose other performance drift patterns. This was highlighted by the different combinations of data shifts observed in this study and prior work with AKI models33. Studies in additional populations with diverse data shift scenarios or in simulated populations with defined forms and extents of data shift would provide a more nuanced understanding of the susceptibilities of various modeling methods. Additionally, we focused on a limited number of common modeling methods, and assessment of additional modeling techniques may reveal more patterns of performance drift. Finally, while we observed significant deterioration in the calibration of most models, we note that statistically significant miscalibration may not translate to clinically relevant changes in performance. Explorations of drift across methods using clinical utility metrics or extensions of calibration metrics to incorporate clinically acceptable margins of error would be particularly informative.
Conclusion
Predictive analytics providing tailored predictions at the individual-patient level are becoming increasingly feasible and commonplace. As we continue to identify and pursue opportunities to incorporate predictive analytics into clinical decision-making, we will require well-calibrated models that consistently deliver highly accurate predictions. In this study, we explore a set of methodologies that can be implemented as an ensemble for active surveillance of clinical prediction models in order to understand potential impacts in the choice of which modeling method to use and how trends in changes in clinical data impact calibration over time in order to make decisions about periodic modeling updating. For our models of 30-day all-cause mortality after hospital admission, case mix shift had little impact on the neural network model, moderate impact on the random forest and L-2 penalized logistic regression models, and a significant impact on most variations of logistic regression. In order to maintain the utility of and user-confidence in model predictions, routine maintenance of implemented clinical prediction models will be essential moving forward. We emphasize the importance of considering the long-term performance implications of modeling methods when developing, implementing, and updating clinical prediction tools. As best practice guidelines for model updating are developed, modeling methods must be a central consideration in order to promote efficient and effective strategies.
Acknowledgements
Financial support for this study was provided entirely by grants from the National Library of Medicine (5T15LM007450-15 and 1R21LM011664-01), the Veterans Health Administration (VA HSR&D IIR 11-292, VA HSR&D IIR 13-052).
References
- 1.Amarasingham R, Patzer RE, Huesch M, Nguyen NQ, Xie B. Implementing electronic health care predictive analytics: considerations and challenges. Health Aff (Millwood) 2014;33(7):1148–54. doi: 10.1377/hlthaff.2014.0352. [DOI] [PubMed] [Google Scholar]
- 2.Ohno-Machado L, Resnic FS, Matheny ME. Prognosis in critical care. Annual review of biomedical engineering. 2006;8:567–99. doi: 10.1146/annurev.bioeng.8.061505.095842. [DOI] [PubMed] [Google Scholar]
- 3.Moons KG, Kengne AP, Grobbee DE, Royston P, Vergouwe Y, Altman DG, et al. Risk prediction models: II. External validation, model updating, and impact assessment. Heart. 2012;98(9):691–8. doi: 10.1136/heartjnl-2011-301247. [DOI] [PubMed] [Google Scholar]
- 4.Matheny ME, Miller RA, Ikizler TA, Waitman LR, Denny JC, Schildcrout JS, et al. Development of inpatient risk stratification models of acute kidney injury for use in electronic health records. Med Decis Making. 2010;30(6):639–50. doi: 10.1177/0272989X10364246. [DOI] [PMC free article] [PubMed] [Google Scholar]
- 5.Steyerberg EW, Moons KG, van der Windt DA, Hayden JA, Perel P, Schroter S, et al. Prognosis Research Strategy (PROGRESS) 3: prognostic model research. PLoS medicine. 2013;10(2) doi: 10.1371/journal.pmed.1001381. e1001381. [DOI] [PMC free article] [PubMed] [Google Scholar]
- 6.Toll DB, Janssen KJ, Vergouwe Y, Moons KG. Validation, updating and impact of clinical prediction rules: a review. J Clin Epidemiol. 2008;61(11):1085–94. doi: 10.1016/j.jclinepi.2008.04.008. [DOI] [PubMed] [Google Scholar]
- 7.Jiang X, Osl M, Kim J, Ohno-Machado L. Calibrating predictive model estimates to support personalized medicine. Journal of the American Medical Informatics Association : JAMIA. 2012;19(2):263–74. doi: 10.1136/amiajnl-2011-000291. [DOI] [PMC free article] [PubMed] [Google Scholar]
- 8.Van Calster B, Vickers AJ. Calibration of risk prediction models: impact on decision-analytic performance. Med Decis Making. 2015;35(2):162–9. doi: 10.1177/0272989X14547233. [DOI] [PubMed] [Google Scholar]
- 9.Steyerberg EW, van der Ploeg T, Van Calster B. Risk prediction with machine learning and regression methods. Biom J. 2014;56(4):601–6. doi: 10.1002/bimj.201300297. [DOI] [PubMed] [Google Scholar]
- 10.Pencina MJ, Peterson ED. Moving From Clinical Trials to Precision Medicine: The Role for Predictive Modeling. Jama. 2016;315(16):1713–4. doi: 10.1001/jama.2016.4839. [DOI] [PubMed] [Google Scholar]
- 11.Parikh RB, Kakad M, Bates DW. Integrating Predictive Analytics Into High-Value Care: The Dawn of Precision Delivery. Jama. 2016;315(7):651–2. doi: 10.1001/jama.2015.19417. [DOI] [PubMed] [Google Scholar]
- 12.Steyerberg EW. New York, NY: Spring; 2009. Clinical Prediction Models: A Practical Approach to Development, Validation, and Updating. [Google Scholar]
- 13.Hickey GL, Grant SW, Murphy GJ, Bhabra M, Pagano D, McAllister K, et al. Dynamic trends in cardiac surgery: Why the logistic euroscore is no longer suitable for contemporary cardiac surgery and implications for future risk models. European Journal of Cardio-thoracic Surgery. 2013;43(6):1146–52. doi: 10.1093/ejcts/ezs584. [DOI] [PMC free article] [PubMed] [Google Scholar]
- 14.Minne L, Eslami S, De Keizer N, De Jonge E, De Rooij SE, Abu-Hanna A. Effect of changes over time in the performance of a customized SAPS-II model on the quality of care assessment. Intensive Care Medicine. 2012;38(1):40–6. doi: 10.1007/s00134-011-2390-2. [DOI] [PMC free article] [PubMed] [Google Scholar]
- 15.Moons KG, Altman DG, Vergouwe Y, Royston P. Prognosis and prognostic research: application and impact of prognostic models in clinical practice. Bmj. 2009;338:b606. doi: 10.1136/bmj.b606. [DOI] [PubMed] [Google Scholar]
- 16.Yale New Haven Health Services Corporation Center for Outcomes Research and Evaluation. Medicare hospital quality chartbook performance report on outcome measures Centers for Medicare and Medicaid Services. 2014.
- 17.Harrison DA, Lone NI, Haddow C, MacGillivray M, Khan A, Cook B, et al. External validation of the Intensive Care National Audit & Research Centre (ICNARC) risk prediction model in critical care units in Scotland. BMC anesthesiology. 2014;14(116) doi: 10.1186/1471-2253-14-116. [DOI] [PMC free article] [PubMed] [Google Scholar]
- 18.Paul E, Bailey M, Van Lint A, Pilcher V. Performance of APACHE III over time in Australia and New Zealand: a retrospective cohort study. Anaesthesia and intensive care. 2012;40(6):980–94. doi: 10.1177/0310057X1204000609. [DOI] [PubMed] [Google Scholar]
- 19.Madan P, Elayda MA, Lee VV, Wilson JM. Risk-prediction models for mortality after coronary artery bypass surgery: application to individual patients. International journal of cardiology. 2011;149(2):227–31. doi: 10.1016/j.ijcard.2010.02.005. [DOI] [PubMed] [Google Scholar]
- 20.Taylor RA, Pare JR, Venkatesh AK, Mowafi H, Melnick ER, Fleischman W, et al. Prediction of In-hospital Mortality in Emergency Department Patients With Sepsis: A Local Big Data-Driven, Machine Learning Approach. Acad Emerg Med. 2016;23(3):269–78. doi: 10.1111/acem.12876. [DOI] [PMC free article] [PubMed] [Google Scholar]
- 21.Pirracchio R, Petersen ML, Carone M, Rigon MR, Chevret S, van der Laan MJ. Mortality prediction in intensive care units with the Super ICU Learner Algorithm (SICULA): a population-based study. Lancet Respir Med. 2015;3(1):42–52. doi: 10.1016/S2213-2600(14)70239-5. [DOI] [PMC free article] [PubMed] [Google Scholar]
- 22.Liu Y, Traskin M, Lorch SA, George EI, Small D. Ensemble of trees approaches to risk adjustment for evaluating a hospital’s performance. Health Care Manag Sci. 2015;18(1):58–66. doi: 10.1007/s10729-014-9272-4. [DOI] [PubMed] [Google Scholar]
- 23.Yale New Haven Health Services Corporation Center for Outcomes Research and Evaluation. 2015 2015 Condition- Specific Measures Updates and Specifications Report Hospital-Level 30-Day Risk-Standardized Mortality Measures - Version 4.0. [Google Scholar]
- 24.Dalton JE, Kurz A, Turan A, Mascha EJ, Sessler DI, Saager L. Risk quantification for 30-day postoperative mortality and norbidity in non-cardiac surgical patients. Anesthesiology. 2011;114(6):1336–44. doi: 10.1097/ALN.0b013e318219d5f9. [DOI] [PubMed] [Google Scholar]
- 25.Nashef SA, Roques F, Sharples LD, Nilsson J, Smith C, Goldstone AR, et al. EuroSCORE II. European Journal of Cardio-thoracic Surgery. 2012;41(4):734–44. doi: 10.1093/ejcts/ezs043. [DOI] [PubMed] [Google Scholar]
- 26.Perlin JB, Kolodner RM, Roswell RH. The Veterans Health Administration: quality, value, accountability, and information as transforming strategies for patient-centered care. The American journal of managed care. 2004;10(11 Pt 2):828–36. [PubMed] [Google Scholar]
- 27.Hastie T, Tibshirani R, Friedman J. 2nd ed. New York: Springer-Verlag; 2009. The Elements ofStatistical Learning; Data Mining, Inference, and Prediction. [Google Scholar]
- 28.Hanley JA, McNeil BJ. The meaning and use of the area under a receiver operating characteristic (ROC) curve. Radiology. 1982;143(1):29–36. doi: 10.1148/radiology.143.1.7063747. [DOI] [PubMed] [Google Scholar]
- 29.Van Hoorde K, Van Huffel S, Timmerman D, Bourne T, Van Calster B. A spline-based tool to assess and visualize the calibration of multiclass risk predictions. J Biomed Inform. 2015;54:283–93. doi: 10.1016/j.jbi.2014.12.016. [DOI] [PubMed] [Google Scholar]
- 30.Steyerberg EW, Vickers AJ, Cook NR, Gerds T, Gonen M, Obuchowski N, et al. Assessing the performance of prediction models: a framework for traditional and novel measures. Epidemiology. 2010;21(1):128–38. doi: 10.1097/EDE.0b013e3181c30fb2. [DOI] [PMC free article] [PubMed] [Google Scholar]
- 31.Debray TP, Vergouwe Y, Koffijberg H, Nieboer D, Steyerberg EW. Moons KG. A new framework to enhance the interpretation of external validation studies of clinical prediction models. J Clin Epidemiol. 2015;68(3):279–89. doi: 10.1016/j.jclinepi.2014.06.018. [DOI] [PubMed] [Google Scholar]
- 32.Minne L, Eslami S, de Keizer N, de Jonge E, de Rooij SE, Abu-Hanna A. Statistical process control for monitoring standardized mortality ratios of a classification tree model. Methods of information in medicine. 2012;51(4):353–8. doi: 10.3414/ME11-02-0044. [DOI] [PubMed] [Google Scholar]
- 33.Davis SE, Lasko TA, Chen G, Siew ED, Matheny ME. Calibration Drift in Regression and Machine Learning Models for Acute Kidney Injury. Journal of the American Medical Informatics Association. 2017 doi: 10.1093/jamia/ocx030. Forthcoming. [DOI] [PMC free article] [PubMed] [Google Scholar]
- 34.Steyerberg EW, Borsboom GJ, van Houwelingen HC, Eijkemans MJ, Habbema JD. Validation and updating of predictive logistic regression models: a study on sample size and shrinkage. Stat Med. 2004;23(16):2567–86. doi: 10.1002/sim.1844. [DOI] [PubMed] [Google Scholar]