Abstract
Unhealthy eating is the most important preventable cause of global death and disability. Effective development and evaluation of preventive initiatives and the identification of disparities in dietary patterns require surveillance of nutrition at a community level. However, nutrition monitoring currently relies on dietary surveys, which cannot efficiently assess food selection at high spatial resolution. However, marketing companies continuously collect and centralize digital grocery transaction data from a geographically representative sample of chain retail food outlets through scanner technologies. We used these data to develop a model to predict store-level sales of carbonated soft drinks, which was applied to all chain food outlets in Montreal, Canada. The resulting map of purchase patterns provides a foundation for developing novel, high-resolution nutrition indicators that reflect dietary preferences at a community level. These detailed nutrition portraits will allow health agencies to tailor healthy eating interventions and promotion programs precisely to meet specific community needs.
Introduction
Unhealthy eating is the leading preventable cause of global death and disability, responsible for 11.3 million premature deaths and the loss of 241.4 million disability adjusted life years1. Obesity and overweight are recognized as a global public health crisis due to the sharp increase in prevalence and their recognized role as risk factors for debilitating chronic diseases including various cancers, cardiovascular diseases, and type II diabetes2,3. Excess sugar intake is one of the most important contributors of weight gain, and carbonated soft drinks (soda) are the primary source of artificially added sugar in the United States 4. Soda intake is especially prevalent among individuals with low Socio-Economic Status (SES), thereby contributing to socio-economic inequalities in nutrition-related chronic illness5,6.
Effective preventive initiatives aimed at reducing nutritional inequalities and improving dietary patterns at population-level are urgently needed. Examples of such approaches include subsidization of healthy food, taxation of unhealthy food, nutrition re-formulation of food product, and increased regulation of unhealthy food marketing activities7-12. At the community level, nutrition education and health promotion programs using existing community ties play a significant role in empowering individuals and communities to adopt healthy dietary behavior 13,14
The planning and management of these interventions and providing direction to population nutrition research require a capacity to measure dietary patterns at a population scale 15,16. Dietary surveillance programs should provide up-to date information about trends in dietary patterns that will support evaluation of the effectiveness of policies and the influence of socio-economically significant events16. Such information should be available at high spatial resolution to allow the identification of community-level nutrition disparities, to evaluate neighborhood-specific responses to policy interventions, and to capture the influence of physical environment (e.g. residential availability of food stores and walkability)16,17. In addition, the information needs to provide product-specific information to track the change of nutrition formulation over time.
To date, public health surveillance of nutrition has largely relied on (often ad-hoc, non-repeated) dietary surveys, which suffer from the underreporting of food intake and inaccurate recall18,19, a lack of detailed information of consumed products (i.e., nutrition contents, packaging, and promotion such as price discounting), and which prohibit dietary assessment for small areas, especially for surveys with a small sample size. In Canada, a national nutrition survey is conducted only every 10 years 20, and it only allows dietary habits to be estimated at a low spatial resolution (e.g. provincial level). Consequently, many public health and community initiatives must be taken with little if any relevant and timely information21.
Market researchers, food manufacturers, and retail industries use scanned grocery transaction data generated by retail food outlets to guide food product development and promotional activities. The stream of retail transaction records from a sample of grocery stores and non-conventional food outlets, such as pharmacies, are routinely collected and centralized in an automated manner by marketing firms such as the Nielsen corporation22. The data contain product details including product name, purchased quantity, price and promotion status at weekly level along with time-fixed store attributes including location, chain (banner) name and unique store code. Additionally, product-specific Universal Product Code (UPC) can be linked to existing nutrition composition marketing databases to enable automated classification of healthy/unhealthy food and product marketing activities, including packaging design.
Although infrequently used in public health research and practice23, these point-of-purchase (i.e., store-level) data could provide a unique input to an automated nutrition surveillance system. Using these data, such a system could produce information on food purchasing patterns, neighborhood product affordability, and the availability and marketing of foods at a high spatio-temporal resolution. The effective application of this information would allow public health agencies and community health workers to access up-to date community nutrition status and formulate health promotion planning and intervention required at jurisdictional level.
However, generating useful information from these point-of-purchase data is a non-trivial problem. Because the transaction data are available for only a sample of food outlets, assessment of food purchase patterns at small area requires estimation of sales data for out-of sample stores. The unobserved sales from these out-of sample stores can be predicted using data from observed stores and the neighborhood and store-level features available from comprehensive government and commercial business registry data. The objective of this study is to develop a sales prediction model using the data from sampled stores, and apply this model to predict sales for out-of sample stores using store and neighborhood attributes available in the transaction data and business registry data. As an initial example, we develop and apply such a model for the prediction of soda products due to their recognized interest as the major source of artificially added sugar and highly debated product as a target for taxation to reduce population-level consumption24.
Methods and Data
The target geographic region was the Census Metropolitan Area (CMA) of Montreal, Canada, which had a population of 3,824,211 inhabitants in 201125. The Nielsen Corporation selects chain retail stores from the Montreal CMA by stratified random sampling, where strata are defined by urban/suburban status, store size, and store type (e.g. supermarkets, pharmacies, mass supercenters). Inclusion criteria for this study are supermarkets (chain grocery stores), chain pharmacies, and supercenters (e.g. Wal-Mart). Excluded store types are independent stores, Warehouse (e.g. Costco), and dollar stores. Our preliminary work indicates that the grocery market share of these target stores among all retail food outlets is 65.2 percent in the Montreal CMA. To maintain the representativeness of the sample in the face of store closures and openings, periodic partial resampling is performed. We extracted the transaction data covering the 2012 calendar year as the study period of interest.
The scanner data consist of weekly aggregated store-level sales volume and information on each food item as defined by Universal Product Code (UPC). Transactions for soda are extracted from a food category labelled as ‘Carbonated Soft Drinks’, from which diet soda is identified and excluded by terms in the product description suggestive of diet beverages. For each store, we generated the average weekly soda sales in 2012 standardized to a single serving size (240ml), resulting in 128 data points (i.e. 128 sampled stores in 2012). Relevant predictive features of soda sales are chain identification code, store type (e.g. supermarkets, pharmacies, supercenters), store size (number of employee), and neighborhood socio-demographic attributes, which are median family income, proportion of individuals who received post-secondary diplomas, proportion of immigrants, and population density as measured by the 2011 Canadian Household Survey. Using linear regression, natural log-transformed soda sales were modelled as a function of these predictive features of soda sales. Selection of the predictors and first-order interaction terms was guided by the minimization of the mean squared error (MSE) using 10-fold cross-validation.
The resulting soda sales prediction model was applied to the out-of-sample food outlets in the Montreal CMA. Predictive features of the sales were supplied by the Canadian Business Point of Interest data 26, which contain annually updated data for all business establishments in Canada. The predicted store-specific weekly average soda purchases in 2012 were spatially interpolated to provide a graphical representation of the soda sales (indicator of unhealthy purchasing) across the Montreal CMA.
Results
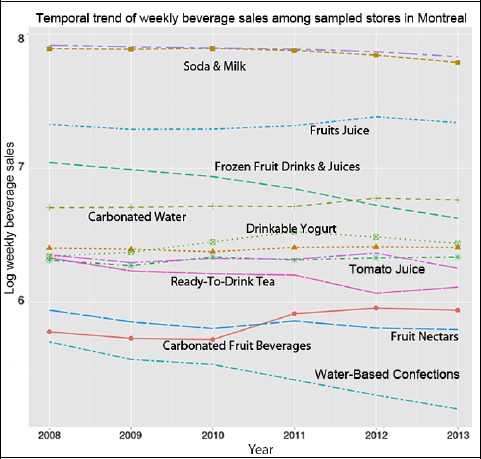
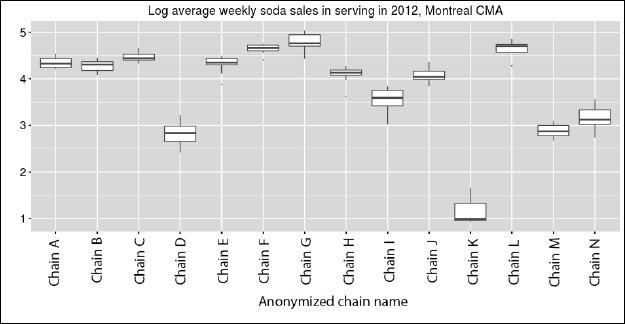
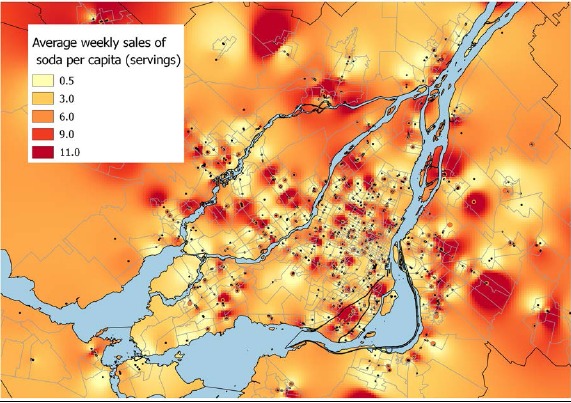
The comparison of beverage category-specific sales indicates that soda, along with milk, were the most frequently purchased beverages in the Montreal CMA (Figure 2). The resulting prediction model as selected by cross-validation demonstrated a good model fit (adjusted R square; 0.95) and prediction error (MSE: 0.20). The highly variable nature of soda sales by chain (Figure 3), and their regression coefficients in the selected prediction model (Table 1) indicate that sales are strongly associated with attributes that are differentiated across the chain, such as store size, product assortment, pricing, and promotional patterns. Interestingly, neighborhood socio-economic status (as represented by income and education in the final model) were substantially less predictive of sales as compared to store chain. The spatial distribution of predicted soda sales is presented in Figure 4.
Figure 2.

Trend of beverage category-specific transactions (servings in log base 10) observed between 2008 and 2013 in Montreal CMA
Figure 3.

Log (base10) soda sales among sampled stores by store chain in Montreal CMA, 2012
Table 1.
Selected predictive features of store-level natural log soda sales.
| Selectedvariable | Predicted change* | Lower 2.5% CI | Upper 2.5% CI |
|---|---|---|---|
| Chain B | -0.27 | -0.72 | 0.19 |
| Chain C | 0.28 | -0.22 | 0.77 |
| Chain D | -3.60 | -4.03 | -3.17 |
| Chain E | -0.13 | -0.58 | 0.32 |
| Chain F | 0.50 | 0.02 | 0.98 |
| Chain G | 0.91 | 0.45 | 1.37 |
| Chain H | -0.65 | -1.11 | -0.18 |
| Chain I | -1.86 | -2.28 | -1.43 |
| Chain J | -0.68 | -1.15 | -0.21 |
| Chain K | -7.22 | -7.82 | -6.62 |
| Chain L | 0.52 | 0.06 | 0.98 |
| Chain M | -3.58 | -4.04 | -3.12 |
| Chain N | -2.83 | -3.26 | -2.39 |
| Education± | -0.87 | -1.85 | 0.12 |
| Income‡ | 0.00002 | -0.00004 | 0.00006 |
CI: Confidence Interval.
Chain: indicator variable for retail chain, where chain A was used as a reference.
*Predicted change in natural log soda sales in standardized serving (240ml) by each predictor.
± Area-level proportion of post-secondary diploma or certificate. Thus, store-level log soda sales in an area with all residents having post-secondary education is -0.87 (95%CI: -1.85 to 0.12) lower than the store-level sales in an area with no residents attaining post-secondary education.
‡ Area-level median family income in 10,000 Canadian dollars.
Figure 4.

Predicted natural log weekly sales of soda in the Montreal CMA in 2012. Spatial interpolation (inverse distance weighted smoothing) was performed on the point quantities of predicted and observed sales at each store.
Discussions and conclusion
Our study harnessed the existing digital grocery transaction data to provide a novel indicator of neighborhood dietary patterns. This is one of the first applications of point-of purchase transaction data to generate high-resolution surveillance information on population nutrition for public health. The method we propose creates a foundation for further exploration of how scanner data can be used to improve the assessment of population nutrition. The strong predictive power of store chains indicates that the mix of chains in a neighborhood at least partially explains spatial patterns in soda purchasing. Therefore, neighborhood mix of retail chain may serve as an environmental indicator useful in characterizing communities that are prone to excess soda consumption. Because pricing, product assortment, and various food marketing activities are available in the transaction data, further investigation could identify factors across chains that drive differential sales and which may be important in-store risk factors of unhealthy food selection.
The proposed approach provides an effective and novel solution for the automated and accurate estimation of dietary patterns for small area, which is not possible with the current nutrition surveillance relying on dietary surveys. Effective analysis of grocery transaction data will therefore provide important and novel information to enable evidence-based planning and evaluation of preventive strategies aimed at dietary risk factors. Because objective data collection was achieved by scanner technology at the store-level, the purchase and promotional status are free of measurement error arising from consumption reports from participants. In addition, these data are collected on a global scale by international marketing companies. Therefore, standardization of measurements and comparison of population nutrition status across regional, provincial, international national levels can be readily achieved.
The development and evaluation of a valid sales indicator requires several ongoing and remaining steps (planned as part of primary author’s doctoral thesis);
Spatial dependency of sales is being investigated using Conditional Autoregressive Model.
Using large travel surveys conducted in the Greater Montreal region, we are characterizing the shopping-related mobility of individuals, conditional on the area of residence and socio-demographic attributes. The travel distance and shape will be used to re-parametrize the smoothing method used in this study.
Sales at point locations (stores) are being converted into an area-level measure defined by socio-economically meaningful neighborhood spatial unit, and we are investigating their correlation with the area-level health outcome, including diabetes and obesity/overweight
Finally, we intend to estimate the predictive performance of our area-level purchase indicator for person-level soda consumption records using dietary questionnaires obtained from residents through nutrition survey.
In addition to the sales measures, it is also possible to predict other store attributes, including the availability of (un) healthy food products and their affordability (food price relative to area-level income). Furthermore, these data also offer a highly time-varying view on marketing activities, such as temporary price discounting and flyer promotion, allowing measurement of neighborhood-level susceptibility to food marketing as demonstrated by our exploratory study27. Although these promotional activities are recognized as strong drivers of food selection among market researchers 28, they are prohibitively expensive to capture by manual field (in-store) investigation. Our modeling can be extended to predict store and category-level promotional activities for healthy and unhealthy food, and it allows profiling food outlets (and thus neighborhoods) based on the exposure to food marketing to identify communities at risk of unhealthy food purchasing.
Three major limitations in this initial study should be noted. Although the study focused on non-diet soda items as an initial example, purchase patterns of a single food category provide limited information for the dietary assessment. Because the transaction data provide a full range of healthy/unhealthy food categories (typically greater than 100 categories in a supermarket), our model could be extended to a multivariate approach (joint modelling of multiple response categories), which will exploit the correlation of food sales across categories. Since the Nielsen corporation does not sample independent (non-chain) stores, our transaction data and thus prediction model is only applicable to chain stores, whose market share of all grocery products is approximately 65 percent. However, because chain supermarkets are the primary location of unhealthy food purchase 29,30, we included the most important stores determining the spatial trend of soda sales. Finally, our study estimated the volume of soda, rather than the actual quantity of sugar purchased, which is a more directly relevant public health indicator. Therefore, linkage of transaction data with existing nutrition composition databases should be performed in future.
In conclusion, the current lack of neighborhood-level dietary surveillance impedes effective public health and community actions aimed at encouraging healthy food selection and subsequent reductions of chronic illness. The rapidly increasing digitalization of consumer retail activities creates opportunities for creative public health applications of these data. Our method leverages existing grocery transaction data to address an important gap in population monitoring of nutrition status and food preferences.
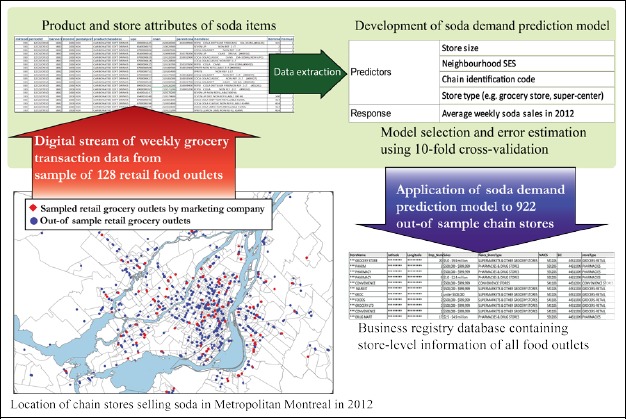
Figure 1.

Visual representation of analytical process
References
- 1.Forouzanfar MH, Alexander L, Anderson HR, et al. Global, regional, and national comparative risk assessment of 79 behavioural, environmental and occupational, and metabolic risks or clusters of risks in 188 countries, 1990-2013: a systematic analysis for the Global Burden of Disease Study 2013. The Lancet. 2015;386(10010):2287–2323. doi: 10.1016/S0140-6736(15)00128-2. [DOI] [PMC free article] [PubMed] [Google Scholar]
- 2.World Health Organization. Obesity and overweight. WHO. [Accessed December 24, 2015.]. http://www.who.int/mediacentre/factsheets/fs311/en/. Published 2015.
- 3.Finucane MM, Stevens GA, Cowan MJ, et al. National, regional, and global trends in body-mass index since 1980: systematic analysis of health examination surveys and epidemiological studies with 960 country-years and 91 million participants. Lancet Lond Engl. 2011;377(9765):557–567. doi: 10.1016/S0140-6736(10)62037-5. [DOI] [PMC free article] [PubMed] [Google Scholar]
- 4.Welsh JA, Sharma AJ, Grellinger L, Vos MB. Consumption of added sugars is decreasing in the United States. Am J Clin Nutr. 2011;94(3):726–734. doi: 10.3945/ajcn.111.018366. [DOI] [PMC free article] [PubMed] [Google Scholar]
- 5.Han E, Powell LM. Consumption patterns of sugar-sweetened beverages in the United States. J Acad Nutr Diet. 2013;113(1):43–53. doi: 10.1016/j.jand.2012.09.016. [DOI] [PMC free article] [PubMed] [Google Scholar]
- 6.Sugar-Sweetened Beverage Consumption Among Adults — 18 States, 2012. [Accessed January 3, 2016]. http://www.cdc.gov/mmwr/preview/mmwrhtml/mm6332a2.htm. [PMC free article] [PubMed]
- 7.WHO. Interventions on diet and physical activity: What Works. WHO. [Accessed February 27, 2017]. http://www.who.int/dietphysicalactivity/whatworks-community/en/
- 8.Galbraith-Emami S, Lobstein T. The impact of initiatives to limit the advertising of food and beverage products to children: a systematic review. Obes Rev. 2013;14(12):960–974. doi: 10.1111/obr.12060. [DOI] [PubMed] [Google Scholar]
- 9.Novak NL, Brownell KD. Role of Policy and Government in the Obesity Epidemic. Circulation. 2012;126(19):2345–2352. doi: 10.1161/CIRCULATIONAHA.111.037929. [DOI] [PubMed] [Google Scholar]
- 10.Sisnowski J, Handsley E, Street JM. Regulatory approaches to obesity prevention: A systematic overview of current laws addressing diet-related risk factors in the European Union and the United States. Health Policy. 2015;119(6):720–731. doi: 10.1016/j.healthpol.2015.04.013. [DOI] [PubMed] [Google Scholar]
- 11.Cohen DA, Lesser LI. Obesity prevention at the point of purchase. Obes Rev. 2016 Jan;:n/a–n/a. doi: 10.1111/obr.12387. [DOI] [PMC free article] [PubMed] [Google Scholar]
- 12.Sallis JF, Glanz K. Physical Activity and Food Environments: Solutions to the Obesity Epidemic. Milbank Q. 2009;87(1):123–154. doi: 10.1111/j.1468-0009.2009.00550.x. [DOI] [PMC free article] [PubMed] [Google Scholar]
- 13.Khan LK, Sobush K, Keener D, et al. Recommended community strategies and measurements to prevent obesity in the United States. MMWR Recomm Rep Morb Mortal Wkly Rep Recomm Rep Cent Dis Control. 2009;58(RR-7):1–26. [PubMed] [Google Scholar]
- 14.Walls HL, Peeters A, Proietto J, McNeil JJ. Public health campaigns and obesity - a critique. BMC Public Health. 2011;11:136. doi: 10.1186/1471-2458-11-136. [DOI] [PMC free article] [PubMed] [Google Scholar]
- 15.Marks GC. Nutritional surveillance in Australia: a case of groping in the dark? Aust J Public Health. 1991;15(4):277–280. doi: 10.1111/j.1753-6405.1991.tb00347.x. [DOI] [PubMed] [Google Scholar]
- 16.Government of Canada HC. Food and Nutrition Surveillance in Canada: An Environmental Scan] 2005. [Accessed October 5, 2014]. http://www.hc-sc.gc.ca/fn-an/surveill/environmental_scan-eng.php.
- 17.Rootman I, Warren R, Catlin G. Canada’s Health Promotion Survey as a Milestone in Public Health Research. Can J Public Health. 2010;101(6):436–438. doi: 10.17269/cjph.101.2567. [DOI] [PMC free article] [PubMed] [Google Scholar]
- 18.Johnson RK. Dietary Intake—How Do We Measure What People Are Really Eating? Obes Res. 2002;10(S11):63S–68S. doi: 10.1038/oby.2002.192. [DOI] [PubMed] [Google Scholar]
- 19.Rollo ME, Williams RL, Burrows T, Kirkpatrick SI, Bucher T, Collins CE. What Are They Really Eating? A Review on New Approaches to Dietary Intake Assessment and Validation. Curr Nutr Rep. 2016;5(4):307–314. doi: 10.1007/s13668-016-0182-6. [DOI] [Google Scholar]
- 20.Government of Canada HC. Canadian Community Health Survey, Cycle 2.2, Nutrition Focus - Food and Nutrition Surveillance - Health Canada. [Accessed November 18, 2015]. http://www.hc-sc.gc.ca/fn-an/surveill/nutrition/commun/cchs_focus-volet_escc-eng.php#order. Published July 20, 2009.
- 21.Government of Canada HC. Measuring the Food Environment in Canada - Health Canada. 2013. Oct, [Accessed December 12, 2014]. http://www.hc-sc.gc.ca/fn-an/nutrition/pol/som-ex-sum-environ-eng.php.
- 22.Nielsen Corporation. Retail Measurement, In-House Retail Experts. Retail Measurement. [Accessed January 2, 2016]. http://www.nielsen.com/nz/en/solutions/measurement/retail-measurements.html. Published 2015.
- 23.Tin ST, Mhurchu CN, Bullen C. Supermarket Sales Data: Feasibility and Applicability in Population Food and Nutrition Monitoring. Nutr Rev. 2007;65(1):20–30. doi: 10.1111/j.1753-4887.2007.tb00264.x. [DOI] [PubMed] [Google Scholar]
- 24.Hu FB. Resolved: there is sufficient scientific evidence that decreasing sugar-sweetened beverage consumption will reduce the prevalence of obesity and obesity-related diseases. Obes Rev Off J Int Assoc Study Obes. 2013;14(8):606–619. doi: 10.1111/obr.12040. [DOI] [PMC free article] [PubMed] [Google Scholar]
- 25.Government of Canada SC. Statistics Canada: 2011 Census Profile. [Accessed December 30, 2015]. https://www12.statcan.gc.ca/census-recensement/2011/dp-pd/prof/details/page.cfm?Lang=E&Geo1=CMA&Code1=462&Geo2=PR&Code2=01&Data=Count&SearchT ext=montreal&SearchType=Begins&SearchPR=24&B1=All&Custom=&TABID=1. Published February 8, 2012.
- 26.Product Documentation: canada business data. Pitney Bowes Software Support. [Accessed March 10, 2017]. http://www.pbinsight.com/support/product-documentation/details/canada-business-data.
- 27.Mamiya H, Moodie E, Jahagirdar D, Buckeridge D. Towards Automated Risk-Factor Surveillance: Using Digital Grocery Purchasing Data to Measure Socioeconomic Inequalities in the Impact of In-Store Price Discounts on Dietary Choice. Online J Public Health Inform. 2016;8(1) doi: 10.5210/ojphi.v8i1.6481. [DOI] [Google Scholar]
- 28.Chandon P, Wansink B. Does food marketing need to make us fat? A review and solutions. Nutr Rev. 2012;70(10):571–593. doi: 10.1111/j.1753-4887.2012.00518.x. [DOI] [PMC free article] [PubMed] [Google Scholar]
- 29.Vaughan CA, Cohen DA, Ghosh-Dastidar M, Hunter GP, Dubowitz T. Where do food desert residents buy most of their junk food? Supermarkets. Public Health Nutr. 2016 Jan;:1–9. doi: 10.1017/S136898001600269X. [DOI] [PMC free article] [PubMed] [Google Scholar]
- 30.Cohen DA, Collins R, Hunter G, Ghosh-Dastidar B, Dubowitz T. Store Impulse Marketing Strategies and Body Mass Index. Am J Public Health. 2014;105(7):1446–1452. doi: 10.2105/AJPH.2014.302220. [DOI] [PMC free article] [PubMed] [Google Scholar]


