Abstract
During the 2014 West African Ebola Virus outbreak it became apparent that the initial response to the outbreak was hampered by limitations in the collection, aggregation, analysis and use of data for intervention planning. As part of the post-Ebola recovery phase, IBM Research Africa partnered with the Port Loko District Health Management Team (DHMT) in Sierra Leone and GOAL Global, to design, implement and deploy a web-based decision support tool for district-level disease surveillance. This paper discusses the design process and the functionality of the first version of the system. The paper presents evaluation results prior to a pilot deployment and identifies features for future iterations. A qualitative assessment of the tool prior to pilot deployment indicates that it improves the timeliness and ease of using data for making decisions at the DHMT level.
Introduction
The 2014 West African Ebola Virus Disease (EVD) outbreak led to the deaths of over 11,000 people across the three worst affected countries: Guinea, Liberia and Sierra Leone1. A key factor in curbing the outbreak was data management and use in i) case management for patients, ii) operational and logistics planning for the response, and iii) community engagement for outbreak mitigation2. Knowledge of the viral transmission rate, the number and location of suspected cases and their contacts, estimated time of infection and the resources available at health facilities was vital for containing the 2014 EVD outbreak.
The Ministries of Health in the three most affected countries and the partners involved in the EVD response developed a plethora of digital and paper-based data collection solutions to provide real-time data to plan interventions. These tools produced a large number of datasets that were owned and stored by the various partners. A number of digital data collection solutions, such as KoboToolbox3 and CommCare4, as well as custom-built tools, were used to collect data in-field. Several organizations utilized existing data portals during the outbreak, such as Humanitarian Data Exchange, or developed new portals such as Ebola GeoNode and The World Health Organization Data Coordination Platform (WHO DCP), making these digitized datasets available for use across multiple partners.
The process of data collection and sharing was highly fragmented, leading to delays in data availability. For example, delays of several weeks were reported for data entry into the Centers for Disease Control’s (CDC) Viral Hemorrhagic Fever (VHF) database2, with up to 50% of confirmed cases in the database lacking outcomes data5. The delays were exacerbated by the lack of a central coordination authority for data and the high turnover of staff, leading to a loss of institutional knowledge of the data available. In addition, digital solutions could not be implemented in all areas due to limited access to power and mobile networks, resulting in duplicate paper-based and digital systems. The Fighting Ebola With Information report produced by USAID extensively discusses the challenges with using data during the EVD outbreak2. While some of these issues were due to the organization of the international response, local infrastructure and skills capacity, there were additional challenges that could potentially have been addressed by technology solutions, as discussed below.
Competing reporting requirements: District-level staff had competing reporting requirements from different agencies and donors for the same data. Manually creating multiple reports was time-consuming, and limited the time available for operational and planning tasks.
Lack of standards for data entry: This could be broken down into three areas: entity resolution, lack of standardized definitions, and lack of standardized collection formats. Entity resolution was difficult due to the large number of entities, particularly facilities and places, with the same or similar names. Lack of standardized definitions led to incompatibilities between datasets e.g. different case definitions were used for reporting EVD cases in different districts2. Finally, the lack of standardization of forms and terms between partners made it difficult to verify, collate and use data collected by different organizations.
Lack of structure and security for data sharing: The United Nations Mission for Emergency Ebola Response (UNMEER) was created to support the EVD response across affected countries. However, since it was a new organization, there were no data sharing policies established beforehand, resulting in a lack of clarity over how data could be shared. This led to data sharing delays or in some cases, data not being shared at all. Conversely, data with personally identifiable information were shared through platforms such as Dropbox, Google Drive and emails due to the lack of a secure sharing platform. Even where datasets were shared, information on metadata and version control was difficult to find or resolve.
Siloed data: Digital data collection tools deployed during the outbreak were largely set up as one-off pilots, with different applications built by different organizations to collect the same data in different regions. This resulted in over 300 new, digital solutions being deployed across Sierra Leone, Liberia and Guinea6. These data terminated in a multitude of web endpoints, making it difficult to collate similar datasets.
Timeliness and quality of data for making decisions: Digital collection of data in low-resource health settings can improve the timeliness of data collection and reporting, and the quality and completeness of data7,8. However, key information was often shared in non-machine readable formats, such as the CDC and The World Health Organization (WHO) case data that were reported as weekly Situation Reports in PDF format9. These had to be manually entered into machine readable formats, delaying decision-making processes.
Skills in the health management workforce: The high volume of digital data collected required analysis by data teams skilled in using software packages, such as QGIS and R. However, the number of personnel trained to conduct the required analyses remained consistently insufficient throughout the outbreak.
In partnership with Port Loko DHMT and GOAL Global, we have developed a system that aims to address the challenges listed above by enabling easier and faster sharing and analyses of health data, for the prevention and detection of large-scale infectious disease outbreaks. The system was designed and developed to improve epidemic preparedness in the district by enabling fast detection and response in the event of an outbreak. Port Loko district, located in the northwest of Sierra Leone, was one of the areas hit hardest by the EVD outbreak. Below, we outline the requirements gathered for the system, an overview of the initial system developed, and the formative evaluation of the system gained through feedback from users during development and a pre-deployment qualitative evaluation.
Methods
User requirements: Initial user requirements were determined in collaboration with DHMT members. Process maps were created in consultation with the DHMT for each of the three datasets used for the system: Integrated Disease Surveillance and Response (IDSR), Infection, Prevention and Control (IPC) and Alerts (district-level reports of deaths or serious disease incidents in the community). During the in-development formative evaluation, the DHMT also helped to identify the key pain points in the current processes, which informed the user requirements. Other requirements for the system were gathered from DHMT team members iteratively using Scrum10, a methodology comprising of a loop of ideation, software development, user demos, feedback from end users, and redesign over sprints for a period of six months. User requirements were classified into the following categories: 1) core functionality, 2) backend analytics, 3) usability, 4) security, and 5) network.
Systems requirements: System requirements were determined through an evaluation of the hardware available at Port Loko DHMT, and the needs for such a system beyond pilot scale deployments. These were classified into the following categories:
Hardware: What hardware is currently available at DHMTs?
Connectivity: What is the current network speed achievable at the DHMT?
Scalability: How can the system be scaled nationally and internationally?
Extensibility: Can additional functionality be added to the system without needing to redesign the architecture?
Data security regulations: Does the system comply with existing data security regulations in Sierra Leone?
Formative evaluation: In addition to the iterative feedback captured in the Scrum process, the first version of the system was evaluated through focus group discussions, one-on-one interviews, and a task completion exercise with key stakeholders in the DHMT. The focus group was conducted with DHMT members from the IDSR, IPC, and Alerts teams. It was used to identify changes in process maps and data models from those captured at the start of the design process. This ultimately provided the baseline of processes used in disease surveillance and control prior to a pilot deployment of the system. The formative evaluation was also used to ascertain how users had interacted with the system to date, as they had access to the system during the iterative development. The focus group and interviews focused on four questions:
What are the key decisions that need to be made and by whom?
Which datasets are currently used to make these decisions?
What analyses are required to inform and support these decisions?
What technologies are currently used or are available to conduct the required analyses?
Individual interviews were conducted with key personnel and managers in the DHMT to understand how they had used, or planned to use, the system as part of their workflow, and to capture detailed feedback on the design of the system. Finally, as part of the one-on-one interviews, a task completion exercise was conducted, in which the interviewees were asked to retrieve and interpret a specific piece of information using the system. The goal was to assess the ease of manipulating data using the system.
The system was piloted from October 2016 to January 2017. The results discussed in this paper are from the iterative design process and the pre-deployment baseline study (conducted in September 2016) described above. The authors plan to publish a separate report on the findings from the pilot.
Results
User and system requirements: The user requirements gathered through the focus groups and one-on-one interviews could be clustered into five categories: core system, analytics, network, usability and security. Details of specific requirements are given in Table 1. The systems requirements were determined by the existing infrastructure at the District Health office in Port Loko, and are given in Table 2.
Table 1:
User requirements identified from requirements elicitation during the development of the first version of the system.
| Category | Component | Functionality |
|---|---|---|
| Core system | Datasets | Must include 1) Integrated Disease Surveillance and Response (IDSR, received weekly) 2) Infection, Prevention and Control (IPC, received monthly), and 3) Alerts data (received daily). |
| Input | Must accept tabular data formats (e.g. Excel and CSV). Must integrate with common mobile data collection APIs (KoboToolbox and CommCare). | |
| Output | Cross-browser web interface. | |
| Analytics | IDSR, IPC | Must follow current MoHS guidelines. |
| Alerts | Use baseline mortality rates for Sierra Leone for thresholds. | |
| Reporting | Must include whether facilities reported on-time for IDSR and IPC. | |
| Risk score | Provide aggregate risk statistics for all three datasets. | |
| Smart search | Ability to geographically and semantically search over related datasets that are collected ad hoc and are not included in the district health information system (DHIS2). | |
| Network | Loading time | The initial loading of the page should take no longer than 5 seconds under normal conditions in Port Loko DHMT. |
| Usability | Data subsets | System must provide functionality to select data by district, chiefdom and section. |
| Data visualization | Data should be represented on graphs and maps, and visualizations should be exported as PDFs. | |
| Training requirements | The system should require minimal training (less than a day) and should not require specialized software skills (e.g. GIS data skills). | |
| Security | Access privileges | Due to the sensitive nature of the data stored, each user requires secure, individual access to the server. |
Table 2:
System requirements identified from requirements elicitation during the development of the first version of the system.
| Category | Functionality |
|---|---|
| Hardware | System will be access via a variety of laptop devices. |
| Connectivity | System must be functional on a 6 Mbps internet connection using a 3G modem. |
| Scalability | System should be able to store two years’ of historical data for a country-level deployment. System must be deployable remotely in an emergency situation. |
| Extensibility | System must be capable of incorporating routine datasets other than disease surveillance, and have the ability to build more advanced analytics in the future. |
| Data security regulation | Users require privileged access to data. The system must be deployable remotely or in country, depending on countries’ regulations on whether data can leave country borders. |
System Architecture: A schematic diagram of the architecture is given in Figure 1. The system comprises of four modules: i) data and data models, ii) data cleaning and curation services, iii) analytics services, and iv) visualizations. The current version of the system is built on a Python Django framework backend and AngularJS frontend deployed on a Red Hat Enterprise Linux 6.5 server. The backend was developed in Python 2.7 as established Python libraries for data manipulation, machine learning and natural language processing were available. The system is modular, and uses services exposed through Application Program Interface (API) calls. Optimization mechanisms such as minification, caching and background data processing were used to improve the performance of the system for use in areas with very low bandwidth.
Figure 1.
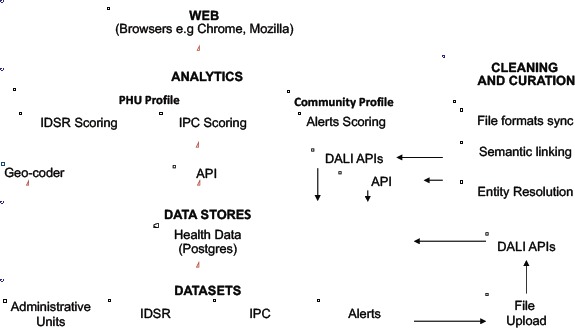
The system architecture comprises of four layers: datasets, data stores, analytics and a web application.
The system was deployed on a remote, secure server with HTTP protocols. To access and use the system, users connected to the machine via a VPN connection. Once their log-in was authenticated, they could view pages for which they had authorization.
Data and data models: In the current implementation, datasets are uploaded via APIs to a Postgres database. A Postgres database was used due to its ability to ingest relational data.
Data cleaning, curation, and analytics services: Disparity in data standards across datasets necessitates that the system can dynamically create data models. Through Data Access Linking and Integration (DALI)11, an IBM Research proprietary software, each file is processed and stored in its own schema. Relationships between schemas are created using semantic closeness between fields. Data cleaning and curation services ensure that relational formats (.xls, .csv, .dbf) can be uploaded into the system. Entities, such as health unit names, are resolved to a single identifier across datasets. These datasets are cleaned and curated using a series of API calls, utilizing new APIs for entity resolution and geocoding using OpenStreetMap place names. The backend analytics services for both health facility and community risk profiling were done using custom-built APIs.
Visualization: HTML, CSS and JavaScript were used to build the visualization dashboards.
Core functionality
The web application consists of four pages: Home, Health Units, Reports and Data Store. The charts on all pages can be exported as PDF files.
Home Page: The home page provides the DHMT management with an overview of reporting rates for the number of facilities reporting on time, late or not reporting, along with the aggregate risk levels (a description of how the risk level was calculated is given later). A screenshot of the page (Figure 2) shows the IDSR reporting rates for the district and the risk levels for a given week. The users can choose which administrative level (district, chiefdom and section) they wish to aggregate data over, and the week they wish to see.
Figure 2.
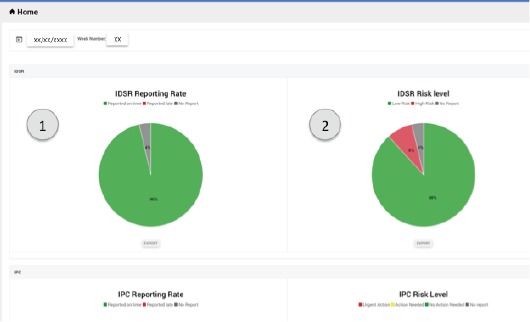
The Home page provides an overview of the aggregate reporting rate (1) and risk level (2) of facilities.
Health Units Page: The Health Units page provides a list of the peripheral health units (PHU) in the chosen administrative level, prioritized by risk level, as shown in Figure 3. The page provides the DHMT with a view of the most at-risk facilities in a given week. A description of how the risk score is calculated is provided in the Analytics section. The color coding on the page is used to indicate which dataset triggered the alarm, along with a description of the alarm. If the user requires further information about the health facility, the user can click on the menu icon to the right to see a full report, including IDSR, IPC and Alerts data over time for that facility.
Figure 3.
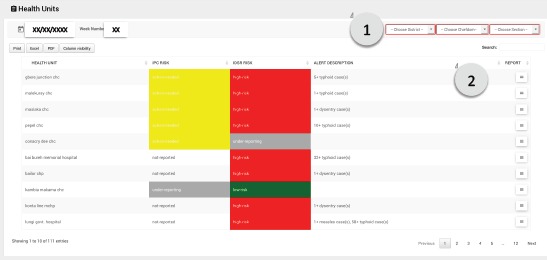
The Health Unit page provides a list of health units in a given geographic area selected by the user (1), prioritized by highest risk score. The user can click on the report icon to see a full report for each facility (2).
Reports Page: The Reports page consists of three subpages for each of the datasets: IDSR, IPC and Alerts. Each page provides a map with markers colored by risk level for each of the health facilities. In addition, it includes the reporting rates over time. For IDSR, the page also has an interactive graph of disease notifications, allowing the user to investigate trends over time. Components of the IDSR Reports page are shown in Figure 4. For IPC, the user can investigate specific measures (the assessment measures included were defined by members of the DHMT). For Alerts, the user can select specific case definitions, locations and age ranges. For all pages, the user can choose to view data for a given administrative level and over a range of dates.
Figure 4.
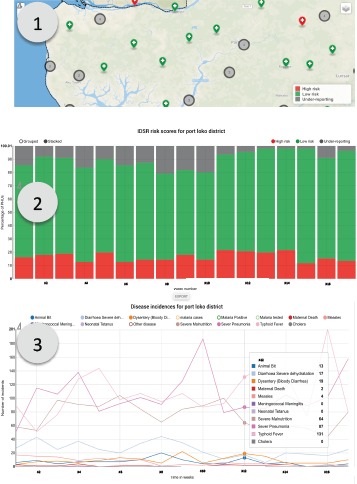
IDSR Report page showing (1) health facilities color coded by their current risk level, (2) cumulative reporting rates for the chosen geographic area and (3) disease incidence trends for the chosen geographic area.
Data Store Page: The data store accepts non-routine tabular data, such as ad hoc assessments and surveys to allow these data to be easily shared between the DHMT and partners. This page allows users to upload tabulated data and, if the data contains GIS information, to automatically map the data. Users can search across all data sets geographically, using a bounding box to select a geographic area of interest, or semantically. The semantic search utilizes the DALI semantic search API, which is based on ontologies from DBPedia11,12,13. A screenshot of the data store page is shown in Figure 5.
Figure 5.
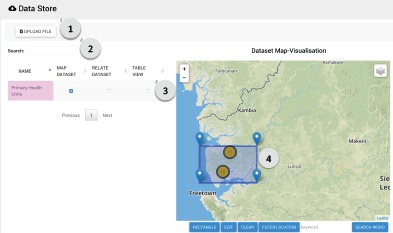
A screenshot of the Data Store Page. The user can (1) easily upload local tabulated data files, (2) map files with GIS information and search for files related to the selected file or word using semantic search, (3) view the data in a tabular view and (4) search for files by geographic area using a bounding box.
Analytics
IDSR, IPC and Alerts: The risk level for IDSR was determined by whether a disease reported was classified as immediately notifiable14, as described in Figure 6. The latest version of the IPC assessment available in November 2016 was used, which consisted of nine sections on the availability, process and knowledge around protective equipment, decontamination, water, sanitation, screening and isolation. The IPC survey consisted of 68 binary questions, which are in turn converted into a percentage score. The thresholds for the risk scoring shown in Figure 6 are based on the MoHS thresholds used in the national IPC Excel template.
Figure 6.
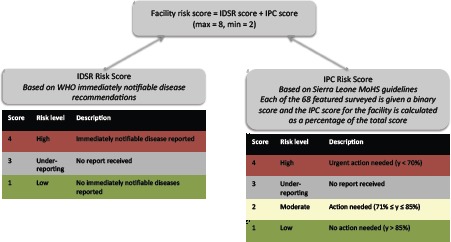
A schematic diagram of the facility risk scoring algorithm used in the deployed version of the system.
Alerts are reported by chiefdom through the national health emergency hotline, local district alerts lines or, during the outbreak, through conversations with Ebola responders. All alerts were entered into the eHealth Africa call center system15, and the risk score was calculated based on deaths per 1000 population relative to the a baseline mortality value of 17.4 deaths of per month for Sierra Leone, based on data from 201216. The risk level for Alerts was determined by using a moving window to average the deaths reported in the previous four weeks, as given by Equation 1, in which Nc is the number of deaths per week in a given chiefdom, t is the current week number, Pc is the population in a given chiefdom in thousands and M.R. is mortality rate per 1000 population. The chiefdom was said to be high risk if the monthly mortality rate was below 17.4 deaths per 1000 population, not reporting if no deaths were reported, and low risk if 0 < M.R. < 17.4 deaths per 1000 population.
| Equation 1 |
Performance
Network speeds were measured between clients in Nairobi, Freetown and Port Loko, and the remote server. Due to lower speeds and a less reliable connection, loading times for the first version of the system, which was not optimized, were considerably slower with a stable connection in Sierra Leone (80 seconds) when compared to Kenya (10 seconds). The system was optimized to meet the loading requirement for the entire website of less than 5 seconds under normal conditions in Port Loko.
Formative evaluation
The following five key themes emerged from the formative and pre-deployment evaluations.
Visually integrate multiple datasets for decision making: Prior to the deployment of the system, each DHMT team (IDSR, IPC and Alerts) analyzed only their own datasets for presentation to the rest of the DHMT on a weekly basis. Having access to all three datasets, particularly side-by-side on the Health Units page, allowed users to contextualize information and interact with other data. For example, if a given PHU had an alarm for IDSR, the team could easily check the IPC risk score to see if there were sufficient measures in place to manage the case or cases recorded in IDSR.
-
Prioritization of information: During the pre-deployment evaluation, several suggestions were made for refining the facility risk scoring. Specifically:
Use of both the absolute number of cases, as well as the population normalized notifcication rate of an immediately notifiable disease in the scoring algorithm;
Addition of a weighting factor based on reporting rates for expected death rate per chiefdom, since reporting rates have dropped significantly since the end of the EVD outbreak. The adjusted threshold could then be used to determine under-reporting more accurately. For example, Tunderreport = A.rreporting.MRbaseline, where Tunderreport is the threshold for underreporting for a given chiefdom, A is a constant chosen as the threshold below which an alarm is raised for underreporting, rreporting is the reporting rate based either from extrapolation of reporting rates over time or a value calculated during an audit, and MRbaseline is the baseline mortality for the country.
Converting decision making into action: After interacting with the system, several users suggested incorporating a means to track the completion of follow-on actions, such as case investigations by the District Rapid Response Teams (RRTs) for immediately notifiable diseases, into the platform.
Interface Omissions: From the in-development and pre-deployment evaluations, several user interface omissions were detected. A Comparison page was added as a result of user testing. The page allows IDSR data to be compared between PHUs, and Alerts data to be compared between chiefdoms to enable the DHMT to quickly assess the relationships between PHUs of interest and to visualize trends across chiefdoms.
Improvements to the timeliness of analysis and decision making: The eight key users interviewed from the DHMT team found that the first version of the system reduced the time taken for the completion of routine tasks. Depending the specific task, they reported the time taken was reduced to 5 to 15 minutes using the system, compared with 30 minutes to 8 hours using manual analysis. Overall, the system was found to be helpful by members of the DHMT for easy and quick visualization of data for making decisions. The team reported that they could use the system to generate reports and explore data in real-time for routine district health coordination meetings and partners’ meetings held at the DHMT.
Discussion
Sustainability of the platform in the face of data changes: Data structures changed significantly throughout the development process. During the 6-month scrum process, the IPC structure as provided by the MOHS/WHO changed five times, and the IDSR format was changed twice. While this affected system features, particularly in the data ingestion model, the modular architecture of the system ensured that the analytics required minimal changes for updated data formats. Our design approach accommodated changes in data structures, resulting in a flexible system that required minimal changes to ingest new formats of datasets. However, the long-term sustainability of such a system would require software development capacity within the MoHS, or an external vendor, to customize and update the system as the needs of DHMTs and the MoHS change over time.
A flexible architecture eases integration with existing systems: During the period that the first version of our system was developed, Sierra Leone’s District Health Information System (DHIS2) underwent significant development. DHIS2 provides aggregate level reporting for facilities across all MoHS indicators. At the time of writing this paper, the MoHS planned to move to fully digital data collection in Sierra Leone across all indicators in DHIS2 by the end of 2017. The system design discussed in this paper allows the source of a data stream to be easily switched from manual file uploads to APIs. This ensures that the system is flexible enough to integrate with existing systems as they transition from manual to fully digital systems. In addition, contextual data (e.g. rainfall data, road networks and community messaging) that is useful for making decisions is not always included in routine reporting systems, such as DHIS2, but can be added as a supplementary data source in the Data Store. Such data is particularly useful in a system deployed at district level when combined with health information data, as it would allow DHMTs to plan more appropriate responses. At the time this project was conceived, the immediate need was for a disease surveillance tool, although the architecture developed could be extended to other public health applications, such as child and maternal health. The modular design of the architecture ensures the flexibility of the system since the data upload, analytics and curation modules can be reused, and only the analytics and UI components would need to be edited for other applications.
Design Challenges: Design challenges occurred for both front and backend development. Common UI features, such as highlighting upon a mouse hover to indicate that a widget is clickable, were not clear for the users we tested the system with. In future iterations of the system, interaction points on the UI need to be tested and clearly communicated to users. On the backend, the key design challenge was building a system that could operate at low bandwidth. In this design, we employed caching and minification to ensure the users could access the system within a reasonable timeframe. Offline functionality was not included in the design requirements since most DHMT offices have an internet connection. However, if the system were to be used in other countries with less internet access at the district level, an offline mode would need to be included.
Building smarter epidemic preparedness systems: The initial analytics built into our system were based on the workflows described by users. However, through the formative evaluation, it became apparent that, once data were easily available and presented in such a way that it was easy to consume, users requested further analytics based on their current decision making processes. Some of these would be relatively simple to implement, such as including diseases that are not immediately notifiable in the IDSR risk calculation, and weighting the risk by the number of cases or the population normalized incidence. However, certain aspects are less clear: how should cases at referral facilities be weighted relative to primary facilities given what they are likely to see and be more prepared for more severe cases? In addition, the deployed system could allow more complex analytics, such as epidemiological models, to be run in real time, eventually allowing proactive planning for seasonal outbreaks, such as waterborne diseases during rainy season. Finally, this architecture opens up opportunities for providing further decision support, specifically around planning for potential scenarios.
Conclusions
This paper presents the design and evaluation of an epidemic preparedness system for DHMTs in low-resource settings. The system discussed in this paper was developed in partnership with, and for use by the Port Loko DHMT in Sierra Leone after the 2014 EVD outbreak. It integrates and analyzes multiple data sources and data types in near real-time. It was shown that such a system reduced the time taken for current workflows to five to fifteen minutes, compared eight hours to thirty minutes prior to the system, depending on the specific task. One of the key strengths of the deployed system was the ability for the DHMT to quickly retrieve relevant data for decision-making. For example, from the Home page, they can quickly drill down to see which facilities had not reported for that week, or which were reported as high risk. In addition, the Health Unit page allows users to quickly prioritize which data to look at. The formative evaluation indicated that a system that provides support for day-to-day operations at the DHMT across all programs, not just disease surveillance, would be valuable. Such a system would allow workflows to be tracked, and data to be automatically pushed to and pulled from systems such as DHIS2 and OpenMRS. The development and testing of the system demonstrated the feasibility of running a cloud-based health analytics service in a low-resource setting. The formative evaluation highlighted the potential of future versions of the system to enable higher level analytics and decision support to be introduced into the workflow of the DHMT, and for the integration of the system with public health information systems.
Acknowledgements
The authors would like to acknowledge USAID’s Fighting Ebola Grand Challenges (BAA-EBOLA-2014 AIDOAA- A-15-00041) fund for financially supporting this work. They would like to thank Port Loko DHMT and GOAL Global, Sierra Leone for their cooperation and technical expertise that made the project possible, particularly the GOAL Port Loko surveillance data team including Hilton Matthews, Alhassan Dumbaya and Ibrahim Yansaneh.
References
- 1.CDC. “2014 Ebola Outbreak in West Africa - Case Counts | Ebola Hemorrhagic Fever | CDC.”. 2016. [Accessed February 20 2017]. https://www.cdc.gov/vhf/ebola/outbreaks/2014-west-africa/case-counts.html.
- 2.USAID. “Fighting Ebola with Information.”. 2016. Accessed February 2017 https://www.globalinnovationexchange.org/fighting-ebola-information.
- 3.Sacks JA, Zehe E, Redick C., Bah A, Cowger K, Camara M, Liu A. Introduction of Mobile Health Tools to Support Ebola Surveillance and Contact Tracing in Guinea. Global Health: Science and Practice. 2015;3(4):646-659. doi: 10.9745/GHSP-D-15-00207. https://doi.org/10.9745/GHSP-D-15-00207. [DOI] [PMC free article] [PubMed] [Google Scholar]
- 4.DIV USAID. “Dimagi’s CommCare used in the fight against Ebola.”. 2015. [Accessed March 8, 2017]. from http://divatusaid.tumblr.com/post/112519160572/dimagis-commcare-used-in-the-fight-against-ebola.
- 5.Fitzgerald F, Awonuga W, Shah T, Youkee D. Ebola response in Sierra Leone: The impact on children. Journal of Infection. 2016;72(Supplement):S6–S12. doi: 10.1016/j.jinf.2016.04.016. https://doi.org/10.1016/jjinf.2016.04.016. [DOI] [PMC free article] [PubMed] [Google Scholar]
- 6.McDonald S. “Ebola: A Big Data Disaster.”. The Centre for Internet and Society. 2017. [Accessed February 20 2017]. http://cis-india.org/papers/ebola-a-big-data-disaster.
- 7.Dam Jv, Onyango KO, Midamba B., Groosman N, Hooper N, Spector J, Pillai G, Ogutu B. “Open-Source mobile digital platform for clinical trial data collection in low-resource settings.”. BMJ Innovations. 2017 Jan; doi: 10.1136/bmjinnov-2016-000164. bmj innov-2016-000164. [DOI] [PMC free article] [PubMed] [Google Scholar]
- 8.Innovations for Poverty Action. “Reducing Ebola Virus Transmission: Improving Contact Tracing in Sierra Leone.”. 2017. [Accessed February 20 2017]. http://www.poverty-action.org/study/reducing-ebola-virus-transmission-improving-contact-tracing-sierra-leone.
- 9.World Health Organization. “WHO | Ebola Situation Reports: Archive.”. WHO. 2016. [Accessed February 20]. http://www.who.int/csr/disease/ebola/situation-reports/archive/en/
- 10.Schwaber K. “SCRUM Development Process.”. In: Jeff Sutherland, Cory Casanave, Joaquin Miller, Philip Patel, Glenn Hollowell., editors. In Business Object Design and Implementation. London: Springer; 1997. pp. 117–34. [DOI] [Google Scholar]
- 11.Lopez V, Kotoulas S, Sbodio ML, Lloyd R. “Guided exploration and integration of urban data.”. In Proceedings of the 24th ACM Conference on Hypertext and Social Media; HT’13. New York, NY, USA. ACM; 2013. pp. 242–247. [DOI] [Google Scholar]
- 12.Lopes N, Stephenson M, Lopez V, Tommasi P, Aonghusa PM. “On-demand integration and linking of open data information.”. In: Emmanouel Garoufallou, Richard J. Hartley, Panorea Gaitanou., editors. In Metadata and Semantics Research. Vol. 544. Cham: Springer International Publishing; 2015. pp. 312–23. [DOI] [Google Scholar]
- 13.Lopez V, Stephenson M, Kotoulas S, Tommasi P. “Data Access Linking and Integration with DALI: Building a safety net for an ocean of city data.”. In: M. Arenas, O. Corcho, E. Simperl, M. Strohmaier, M. dA., K. Srinivas, P. Groth., editors. In The Semantic Web - ISWC 2015. Lecture Notes in Computer Science. Springer International Publishing; 2015. pp. 186–202. [DOI] [Google Scholar]
- 14.Centers for Disease Control. “Integrated Disease Surveillance and Response: Technical Guidelines for Integrated Disease Surveillance and Response in the African Region, 2nd Edition - 2010 | Division of Global Health Protection | Global Health.”. 2017. [Accessed February 9 2017]. https://www.cdc.gov/globalhealth/healthprotection/idsr/tools/guidelines.html.
- 15.eHealth Africa. “Using Tech to Save Lives in Sierra Leone.”. eHealth Africa. 2017. [Accessed February 20 2017]. http://www.ehealthafrica.org/latest/2016/11/29/using-tech-to-save-lives-in-sierra-leone.
- 16.UNICEF. At a Glance: Sierra Leone. 2013. [accessed March 7, 2017]. https://www.unicef.org/infobycountry/sierraleone_statistics.html.


