

Abstract
Providers today face productivity challenges including increased patient loads, increased clerical burdens from new government regulations and workflow impacts of electronic health records (EHR). Given these factors, methods to study and improve clinical workflow continue to grow in importance. Despite the ubiquitous presence of trainees in academic outpatient clinics, little is known about the impact of trainees on academic workflow. The purpose of this study is to demonstrate that secondary EHR data can be used to quantify that impact, with potentially important results for clinic efficiency and provider reimbursement models. Key findings from this study are that (1) Secondary EHR data can be used to reflect in clinic trainee activity, (2) presence of trainees, particularly in high-volume clinic sessions, is associated with longer session lengths, and (3) The timing of trainee appointments within clinic sessions impacts the session length.
Introduction
Outpatient healthcare clinics face ongoing pressures to see more patients in less time due to concerns about the accessibility and cost of healthcare.1,2 Significant challenges can impede outpatient clinic efficiency including increased patient demand with limited clinic resources, ad-hoc scheduling methods, increased clerical burdens and possible negative effects of the introduction of electronic health records (EHRs).3-6 Given these pressures and challenges, methods to study and improve clinical workflow are becoming ever more significant. In previous studies, we developed methods to improve clinic workflow through secondary use of EHR timestamps and discrete event simulation.7,8 These results showed how EHR timestamps adequately approximated clinic workflow timings for use in large scale simulations. In this study, we make use of EHR timestamps in order to address an important unanswered question: the impact of trainee providers on academic outpatient clinic workflow.
In its Common Program Requirements, The Accreditation Council for Graduate Medical Education (ACGME) states that “The specialty education of physicians to practice independently is experiential, and necessarily occurs within the context of the health care delivery system”.9 Despite this commitment to train within the health care system, there are few studies on graduate medical education’s impact on outpatient clinics, and many have been small in size and have had conflicting findings. For example, two studies found trainees improved workflow by shortening patient wait times,10,11 while a different study found trainees lengthened appointment times.12 More recently, we conducted a large scale investigation of the relationship between presence of trainees and outpatient appointment length and found that appointments with trainees were significantly longer than appointments without trainees (Goldstein, IH et al. IOVS 2017 58: ARVO E-Abstract 5060). Spurred on by the high demand for emergency physicians and the association between emergency department crowding and adverse health outcomes, a number of research groups have quantified and refined the impact trainee providers have on the workflow of emergency departments.13-15 Some groups found trainees are associated with both length of stay and the number of patients who leave without being seen, while others have found the association was negligible.16-18
This sparse and conflicting literature leaves many unanswered questions about the relationship between trainees and outpatient clinic workflow. This study utilizes EHR data to quantify the impact of residents and fellow trainees on half-day clinic sessions in an outpatient ophthalmology clinic. Our results show that trainees can impact the overall length of clinic sessions significantly, with implications for secondary use of EHR data, clinic efficiency, and provider reimbursement models.
Methods
This study was approved by the Institutional Review Board at Oregon Health & Science University (OHSU).
Study Environment
OHSU is a large academic medical center in Portland, Oregon. The department of ophthalmology includes over 50 faculty providers who perform more than 115,000 outpatient examinations annually. The department provides primary eye care, and serves as a major tertiary referral center in the Pacific Northwest and nationally. Typically, the department has 15 residents and 10 fellows per academic year.
EHR Dataset
For our study, we identified “stable faculty providers” who worked at OHSU for at least 6 months before and after the study period. This minimized bias from providers with growing or shrinking clinical practices. Providers who did not have a standard clinical practice, who did not use the EHR, who had a small number of appointments with trainees (less than 3), or who had only appointments with trainees were excluded. Demographics for study providers and trainees (gender, age, and ophthalmic sub-specialty) were gathered using publicly-available data. We queried check in and check out times, as well as the primary billing code, from OHSU’s clinical data warehouse (EpicCare; Epic Systems, Verona, WI).
Determining the involvement of a trainee in patient encounters is not straight forward given that there isn’t a standard method for recording when trainees participated in encounters. For the purposes of this study, we considered trainees to be involved in the appointment if there was a record in the EHR encounter. This record can appear in several areas; we used audit log entries as markers for trainee activity. We measured the time that trainee providers used the EHR during each patient appointment, while the patient was checked in. A trainee was considered present for an appointment if they used the EHR for more than two minutes during the patient’s appointment (sometimes called trainee appointments in this paper). Appointments were excluded if they were missing either a check-in or checkout time, if there was a non-physician trainee present, or if there were two of the same kind of trainee present. The final exclusion criteria eliminated 50 appointments and focused our data on common workflows with physician trainees.
From this data set of appointments, we aggregated the encounter data into half-day clinic sessions. Session length, the dependent variable in our models, was calculated as the first patient check-in time of the session subtracted from the last patient checkout time of the session. A trainee session was defined as a half-day clinic session with more than one patient appointment in which a trainee was present. Because volume is a big determinant of the length of a clinic session we included patient volume as a factor in our model. To simplify analysis, we categorized clinic sessions as low, medium, and high. A low patient volume session was defined as one with ≤6 patients, a medium patient volume session was defined as one with 7-14 patients, and a high patient volume session was defined as one with <14 patients.
Data Validation
To validate our method of using audit log entries to determine the presence of a trainee in an appointment, we (SRB) conducted a thorough manual chart review of 50 appointments, and determined whether or not a trainee was present for the appointment if one or more of four criteria were met:
-
1.
Attestation: The provider specifically affirmed they reviewed the activity of a trainee provider.
-
2.
Revision History: The chart’s revision history showed activity by a trainee provider during the exam.
-
3.
Edited Exam Element: The chart showed a trainee provider edited exam elements.
-
4.
Signature: A trainee provider signed the note following the exam.
We then compared the study’s method for determining the presence of trainees, as well as each of the four criteria individually, to the results of this chart review. We further tested the robustness of our method of using 2 minutes of audit log activity by creating new data sets with adjusted time cutoffs and comparing them to the original.
Exclusions
Because we are studying the effect of trainees on regularly scheduled clinic sessions, we excluded sessions whose patient volume was in the bottom quartile for that session’s provider. These low volume sessions typically represent limited clinic sessions (e.g. a few post-op appointments on a non-clinic day). Since some of our analysis involveddividing clinic session into quartiles, we excluded all sessions with fewer than four appointments. Finally, we excluded one outlier session with a session length of 16 hours, which was due to an invalid checkout time.
Data Analysis
To analyze the impact of trainees on session length, we constructed multiple linear and linear mixed models with interacting terms. Models were used to analyze the impact on session length of: (1) the presence of trainees in a session (2) the percentage of trainee appointments in a session (3) the length of trainee appointments, and (4) the timing of trainee appointments. For the linear mixed models without interacting terms, p-values were obtained through type II Wald chisquare tests, for those with interacting terms, multiple comparisons and the Holm- Bonferroni method were used. For all tests, significance was defined as p<.05. All data processing and statistical calculations were conducted in R19, models were constructed via lme420, p-values were calculated via the Anova function from the car package,21 and the glht function from the multcomp package.22
Results
Overview of providers and session
The time period of this study was from January 1, 2014 to December 31, 2014. Data regarding attending faculty providers are shown in Table 1. There were 33 faculty attending providers who met study inclusion criteria. These faculty providers had 3,764 half-day clinic sessions which met study criteria, of which 1,557 were trainee sessions.
Table 1.
Characteristics of faculty ophthalmology providers, residents and fellows.
 |
* Demographic information for the providers and trainee providers, as well as summary statistics for the study appointments and sessions.
* Providers were identified based on having worked at the study institution for 6 months before and after the study period.
† Age and length of practice are calculated based on the beginning of the study period Jan 1, 2014.
‡ Because of rounding, the percents do not add to 100
§ Trainee appointments have either residents, fellows, or both. Note the number of trainee appointments is not the sum of the resident appointments and the fellow appointments, as some appointments have both. The total number of trainee appointments was 10635
|| Trainee Sessions have two or more resident or fellow appointments per session. Note the number of trainee sessions is not the sum of the resident sessions and the fellow sessions, as some sessions have both. The total number of trainee sessions was 1557
In total 12,247 appointments and 2,197 sessions were excluded.
Low volume sessions had on average 5 appointments, medium volume sessions had on average 10 appointments, high volume sessions had on average 19.8 appointments. Low volume trainee sessions had on average 3.4 trainee appointments, medium volume trainee sessions had 5.2 trainee appointments, and high volume trainee sessions 9.8 trainee appointments. In this study, 39.4% of providers were female, and the median age was 44.0 years. Twelve different ophthalmic sub-specialties were represented, with the largest numbers in glaucoma, pediatrics, and retina (N=4 each).
During the calendar year, there were 10 Post Graduate Year (PGY) 2 and PGY-3 residents, 9 PGY-4 residents, and 23 fellows. As our data are from the calendar year 2014, these numbers represent two different classes of trainee providers: the 2013-2014 year, and the 2014-2015 year.
Validation and robustness of trainee identification method
Table 2 shows the validation results of comparing our method of using audit log entries to manual chart review. Of the methods tested, only this study’s method based on audit log entries had a sensitivity score of 1, it also was the only method with a specificity score less than 1, with a score of .97. In addition to validating our method, we also wished to test its robustness. To this end we created two additional data sets, one where a trainee was present if for more than one minute a trainee used the EHR during the exam (>1), and another where a trainee was consider present if for more than three minutes a trainee used the EHR during the exam (>3), and compared the number of appointments with trainees, number of sessions with trainees, and model impact of the presence of trainees on session length to those of the study’s data set (>2), shown in Table 3. As the definition was loosened or restricted, the appointments and sessions with trainees increased and diminished predictably, with >3 having the largest difference in trainee appointments with an 8.6% decrease compared to >2. Notably, for all three data sets, the model impact of the presence of trainees on session length (discussed below) was significant, and the size of the impact was similar.
Table 2:
Specificity and sensitivity of methods to identify the presence of trainees. Specificity and sensitivity ratios were calculated for five methods for identifying the presence of trainees in a patient appointment. The bolded method, documentation time, determined a trainee was present for an appointment if for more than two minutes a trainee provider used EHR during the exam and was used in our study. This method had the second highest specificity and the highest sensitivity of any method tested.
| Classification Method | Specificity | Sensitivity |
|---|---|---|
| Audit Log Entries | 0.97 | 1.00 |
| Attestation Only | 1.00 | 0.33 |
| Revision History Only | 1.00 | 0.95 |
| Edited Exam Elements Only | 1.00 | 0.75 |
| Signature Only | 1.00 | 0.30 |
Table 3:
Comparisons of study population and results for different definitions of the presence of trainees. Our study determined that a trainee was present in an appointment if for more than two minutes they used the EHR during the appointment (>2). To test the robustness of this definition we created new data sets and adjusted the definition to more than one minute (>1) and more than three minutes (>3) and compared the % difference in trainee appointments and trainee sessions to >2, the data used in our study. For each data set, we also tested whether the presence of trainees in a session was associated with session length.
| Minutes of EHR Activity | # Appts. w/ Trainees (Difffrom Ref) | # Sessions w/ Trainees(Diff from Ref) | Model Impacton Session Length* |
|---|---|---|---|
| >2 (Reference) | 10635 (0%) | 1557(0%) | 10.3±2.4 |
| >1 | 11457 (7.7%) | 1589 (2%) | 9.4±2.4 |
| >3 | 9717 (-8.6%) | 1529 (-1.8%) | 10.2±2.4 |
*For all tests, p<.001
Association of presence of trainees and session length
Figure 1 summarizes the session data regarding the association of presence of trainees with session length, and shows the spread of session lengths for trainee vs. non-trainee sessions, grouped by patient volume to help eliminate differences due to the number of patients seen at the clinic. For each category of patient volume, the median session length for trainee sessions is larger than the median session length of non-trainee sessions. To see when the presenceof trainees produced a significant difference in session length, we must also consider the effect of providers on this difference. We constructed a linear mixed model where half-day clinic sessions were the input and session length the output, the fixed effect was the presence of trainees, the random effect was providers. This model showed that trainee sessions were associated with an increase of 10.3±2.4 minutes compared to non-trainee sessions (p<.001). To further analyze this effect, we added patient volume as an interacting fixed effect along with the presence of trainees. This more detailed model showed that high volume sessions with trainees were associated with an increase in session length of 21.0±3.9 minutes (p<.001), but the association was not significant for medium and low volume sessions.
Figure 1:

Distribution of trainee and non-trainee session lengths. Boxplots of session length, grouped by volume and presence of trainees. In all Categories, session length varies greatly, though the median session length of sessions with trainees is larger than the median session length of sessions with no trainees.
Association of percentage of trainee appointments and session length
We next analyzed the association between the amount of trainee activity and clinic session length. Figure 2 displays the session data regarding this association with sessions grouped by their volume label. All three trend lines were significant, with low volume sessions seeing an increase of 3.5±.7 minutes per 10% increase, medium volume sessions seeing an increase of 2.8±.5 minutes per 10% increase, and high volume sessions seeing an increase of 2.8±.8 minutes per 10% increase.
Figure 2:
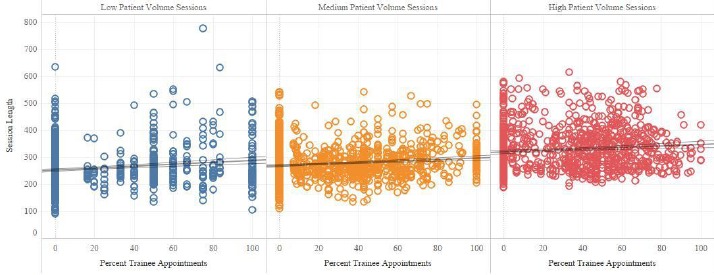
Percent trainees versus session length. We compared the percent of a session’s appointments which were trainee appointments to session length. For all volume groups, as the percentage of trainee appointments increases, so too does average session length. Trend lines are significant with p<.001. Thin lines are 95% confidence intervals.
To test this further, we developed another linear mixed model with the percentage of trainee appointments as the fixed effect, and the individual providers as the random effect. This model showed that the percentage of trainee appointments was associated with an additional .86±.4 minutes per 10% increase (p<.03). When this model was expanded to take patient volume per half-day clinic session into account, the impact of the percentage of trainee appointments was significant for high patient volumes, with an impact of an additional 2.1±.6 minutes per 10% increase (p<.004).
Trainee appointment length
Next, we investigated how the length of trainee appointments affected clinic length. To assess this, we used a ratio of a sessions’ average trainee appointment length compared to the session’s provider’s average appointment length for appointments from sessions with no trainees. Table 4 shows the results of our linear mixed models: the ratio and patient volume are interacting fixed effects and the providers are the random effect. Overall, an increase in the ratio was associated with a significant increase in session length of 7.1±.5 minutes per 10% increase, with the greatest increase for high volume sessions. This association was significant for all patient volumes (p<0.001).
Table 4:
Association of the ratio of average trainee appointment time to average provider non-trainee appointment time with session length. For trainee sessions we looked at the ratio between the session’s average trainee appointment length and the session’s provider’s average appointment time from sessions with no trainees. As the ratio increases in size, session length also increases, both overall and for all patient volumes. P-values were calculated via Wald type II chai squared tests and multiple comparisons and the Holm-Bonferroni method.
| Volume | Number of Sessions | Model Effect* | P-value |
|---|---|---|---|
| Low | 275 | 6.7±1.2 | <.001 |
| Medium | 643 | 5.3±.8 | <.001 |
| High | 639 | 8.3±.8 | <.001 |
| Overall | 1557 | 7.1±.5 | <.001 |
*Reported as minutes per 10% increase in trainee appts.
Trainee appointment timing
Finally, we analyzed the association of the timing of trainee appointments and session length. For these tests, we divided each session into quartiles (roughly representing each hour of the session) and labeled each appointment with the quartile when it occurred.
As described above, low volume trainee sessions had on average 3.4 trainee appointments, medium volume trainee sessions had 5.2 trainee appointments, and high volume trainee sessions 9.8 trainee appointments. Keeping this in mind, the first conditions we developed were based on patient volume, and tested whether it mattered when a corresponding number of minimum trainee appointments occurred. For example, there were on average 5.2 trainee appointments in each medium volume session, meaning at least one quartile had 2 trainee appointments. Thus one condition tested was “two or more trainee appointments in the first quartile”.
Our only significant result from these tests was from testing the conditions “3 or more trainees in the nth quartile” among high volume sessions (N=1068). To test these conditions we created a model where the fixed, independent effects were the true/false conditions “3 or more trainees in the 1st, 2nd, 3rd or 4th quartile” and the random effect was providers. The only condition which proved to be significant was “3 or more trainees in the 1st quartile”, which was associated with an increase in session length of 27.8±6.0 minutes (p<.001).
Moving from absolute numbers of trainees, we examined a variety of conditions concerning the percentage of overall trainee appointments that occurred in a particular quartile of the clinic. For these conditions we used the full data set and a model with a true/false rule interacting with patient volume as the fixed effects, providers again as the random effect. Our analysis showed that for high volume sessions, meeting the condition that 60% of their trainee appointments were in the first half of the session was associated with an increase in session length of 20.8±5.0 minutes, this effect was not significant for medium and low volume sessions. Without considering volume, meeting this condition was associated with an increase in session length of 10.4±3.2 minutes (p<.002).
Lastly, we tested the condition “One or more trainees in the last quartile.” The model was constructed similarly to the previous one, using the full data set and patient volume as an interactive term. For high volume sessions, meeting this criteria was associated with an increase of 20.1±3.7 minutes (p<.001), for medium and low volume clinic sessions there was no significant difference. When volume was not included in the model, meeting this criteria was associated with an increase in session length of 12.1±2.4 minutes (p<.001).
Discussion
There were three key findings from this study: (1) Secondary EHR data can be used to reflect in-clinic trainee activity, (2) presence of trainees, particularly in high-volume clinic sessions, can be associated with longer session lengths, and (3) the timing of trainee appointments within clinic sessions is associated with session length.
The first key finding is that EHR data can be used to reflect in-clinic trainee activity. For this paper we determined that a trainee was present for a patient appointment if for more than two minutes a trainee provider used the EHR during the appointment. When we tested this method for sensitivity and specificity, both scores were extremely high (Table 2). While manually reviewing a patient’s revision history proved to be nearly as sensitive and more specific, our method is considerably faster. Though some form of automation could be developed to review revision history, this would be somewhat cumbersome, and given the success of our method, we believe it to be a good choice for this kind of analysis.
While numerous papers have been written using EHR data to answer clinical questions, and a robust literature of time motion studies analyze clinic workflow, few studies have used big data repositories of EHR data to address issues of clinic workflow.23-27 It is possible that one of the reasons so few studies considering the relationship between trainees and workflow in outpatient clinics exist because determining when trainees see patients by any other means is a prohibitively resource intensive endeavor. Our study provides one way to address this issue.
The second key finding is that presence of trainees, particularly in high volume clinic sessions, can be associated with longer session lengths. Overall, the presence of trainees in a half-day clinic session was associated with a ten minute increase in session length. However, once volume was included into the model, this association was only significant for high volume clinic sessions (sessions with more than 14 patients), which were about 20 minutes longer. Additionally, our study found that, for high volume sessions, as the percentage of appointments seen by trainees increases, so too does session length, suggesting that not only the involvement of trainees, but the degree of the involvement can affect session length.
While we found on average that appointments with trainees are longer than appointments without trainees, this is certainly not always the case. We were interested in how much the length of a trainee appointment was related to session length, but wanted to account for the fact that trainee appointments are not always longer than non-trainee appointments. Thus, we developed the ratio of a session’s average trainee appointment length to the session’s provider’s average non-trainee appointment length, to focus in on what happened as the length of trainee appointments became significantly longer than non-trainee appointments. Our results found that, for all patient volumes, as this ratio increased so too did session length (Table 4).
To our knowledge, there has been little research on the relationship between trainees and session length. One paper used simulations to predict that trainees would shorten both appointment time and session length, however the simulation was never corroborated with collected data.11 We believe our large scale-retrospective study gives a more accurate sense of the relationship between trainees and session length. Our results are also consistent with our previous study concerning trainees and outpatient clinic efficiency, which found that appointments with trainees are on average longer by 25 minutes, and that in some cases even appointments where no trainee was present from a trainee session may have longer appointment times (Goldstein, IH et al. IOVS 2017 58: ARVO E-Abstract 5060). We hypothesized this was because trainees were introduced as an additional step in the workflow of an appointment, leading to lengthened times and sometimes resource bottlenecks, which would also contribute to longer session lengths.
The third key finding is that timing of trainee appointments within clinic sessions is associated with session length. One goal of this study was to investigate not only if it mattered whether trainees were present during a clinic session, but also if it mattered when they saw patients. In total we found three conditions concerning the timing of trainee appointments that, when met in high volume clinic sessions, led to increases in session length of 20-30 minutes. Our study found that concentrating trainee appointments in the first half of the session (in particular the first quarter) led to longer session lengths, probably caused by workflow bottlenecks created due to longer appointment times (Goldstein, IH et al. IOVS 2017 58: ARVO E-Abstract 5060).3 Our study also found session length increased when trainee appointments were concentrated in the last quarter of the session, this is probably because longer appointment times at the end of the day push back the final checkout time, and thus lengthen the session.
Together, these key findings tell us that trainees can be associated with a significant negative impact on clinic efficiency, and that this impact is affected by a variety of factors concerning trainee involvement, activity, and timing. While it seems unlikely that clinics could change the way trainee providers are involved in appointments due to educational factors, these findings at least help academic providers better understand how trainees affect their clinic workflow.
With MACRA, the United States is continuing to transition toward “value-based” models of provider reimbursement, which are based on a combination of quality and cost of care.28,29 Key findings 2 and 3 highlight a structural characteristic of academic outpatient clinics that should perhaps be considered as reimbursement models are refined, because presence of trainees is associated with increased time – and therefore lower efficiency. Specifically, our results suggest that, due to the presence of trainees academic outpatient providers see fewer patients in a given period of time than non-academic outpatient providers.
Limitations
There were several study limitations that should be highlighted. (1) There is a great deal of variance associated with clinic session length that is not associated with trainees. This most likely is why so many of the rules we tested failed, notable ones included: the percentage of trainee appointments in any given quartile of the clinic session, the number of trainee appointments in quarter four, and the lack of trainee appointments in quarter four. The fact that we could not establish significance for these factors does not speak to whether or not they are actually important factors in determining session length, simply that we were unable to do so with our data set and models. Further research seems warranted to help correct for this variance. (2) It is worth noting that we calculated session length using appointment checkout times, which may not be correct due to staff delays. This may also contribute to some of the variance in our models. (3) Finally, this study only considers appointments where trainees used the EHR as part of their involvement, there are training activities that do not involve the EHR which our study fails to take into account. Other research modalities would seem to be necessary to address limitations 2 and 3.
Conclusion
We have shown that secondary EHR timestamp data may be applied to arrive at important and timely conclusions about the impact of trainees on clinic workflow. Findings from this study demonstrate that presence of trainees is associated with longer clinic session lengths, and may have implications for clinical care, medical education, and policymaking regarding provider reimbursement.
Acknowledgements
Supported by grants T15LM007088, K99LM012238, and P30EY0105072 from the National Institutes of Health, (Bethesda, MD) and by unrestricted departmental support from Research to Prevent Blindness (New York, NY).
References
- 1.Blumenthal D, Collins SR. Health Care Coverage under the Affordable Care Act — A Progress Report. N Engl J Med. 2014;371(3):275–81. doi: 10.1056/NEJMhpr1405667. [DOI] [PubMed] [Google Scholar]
- 2.Hu P, Reuben DB. Effects of managed care on the length of time that elderly patients spend with physicians during ambulatory visits: National Ambulatory Medical Care Survey. Med Care. 2002;40(7):606–13. doi: 10.1097/00005650-200207000-00007. [DOI] [PubMed] [Google Scholar]
- 3.Young T, Brailsford S, Connell C, Davies R, Harper P, Klein JH. Using industrial processes to improve patient care. BMJ. 2004;328(7432):162–4. doi: 10.1136/bmj.328.7432.162. [DOI] [PMC free article] [PubMed] [Google Scholar]
- 4.Gupta D, Denton B. Appointment scheduling in health care: Challenges and opportunities. IIE Trans. 2008;40(9):800–19. [Google Scholar]
- 5.Shanafelt TD, Dyrbye LN, Sinsky C, et al. Relationship Between Clerical Burden and Characteristics of the Electronic Environment With Physician Burnout and Professional Satisfaction. Mayo Clin Proc. 2016;91(7):836–48. doi: 10.1016/j.mayocp.2016.05.007. [DOI] [PubMed] [Google Scholar]
- 6.Chan P, Thyparampil PJ, Chiang MF. Accuracy and Speed of Electronic Health Record Versus Paper-Based Ophthalmic Documentation Strategies. Am J Ophthalmol. 2013;156(1):165–172.e2. doi: 10.1016/j.ajo.2013.02.010. [DOI] [PMC free article] [PubMed] [Google Scholar]
- 7.Hribar MR, Read-Brown S, Reznick L, et al. Secondary Use of EHR Timestamp data: Validation and Application for Workflow Optimization. AMIA Annu Symp Proc. 2015;2015:1909–17. [PMC free article] [PubMed] [Google Scholar]
- 8.Hribar MR, Biermann D, Read-Brown S, et al. Clinic Workflow Simulations using Secondary EHR Data. AMIA Annu Symp Proc AMIA Symp. 2016;2016:647–56. [PMC free article] [PubMed] [Google Scholar]
- 9.ACGME Common Program Requirements [Internet] 2016. Available from: http://www.acgme.org/Portals/0/PFAssets/ProgramRequirements/CPRs_07012016.pdf.
- 10.Bestvater D, Dunn EV, Nelson W, Townsend C. The effects of learners on waiting times and patient satisfaction in an ambulatory teaching practice. Fam Med. 1988;20(1):39–42. [PubMed] [Google Scholar]
- 11.Williams KA, Chambers CG, Dada M, Hough D, Aron R, Ulatowski JA. Using Process Analysis to Assess the Impact of Medical Education on the Delivery of Pain ServicesA Natural Experiment. Anesthesiol J Am Soc Anesthesiol. 2012;116(4):931–9. doi: 10.1097/ALN.0b013e31824a88d0. [DOI] [PubMed] [Google Scholar]
- 12.Gamble JG, Lee R. Investigating whether education of residents in a group practice increases the length of the outpatient visit. Acad Med J Assoc Am Med Coll. 1991;66(8):492–3. doi: 10.1097/00001888-199108000-00019. [DOI] [PubMed] [Google Scholar]
- 13.Camargo Jr CA, Ginde AA, Singer AH, et al. Assessment of Emergency Physician Workforce Needs in the United States, 2005. Acad Emerg Med 2008. 15(12):1317–20. doi: 10.1111/j.1553-2712.2008.00264.x. [DOI] [PubMed] [Google Scholar]
- 14.Guttmann A, Schull MJ, Vermeulen MJ, Stukel TA. Association between waiting times and short term mortality and hospital admission after departure from emergency department: population based cohort study from Ontario, Canada. [cited 2017 Jan 24];The BMJ [Internet] 2011 342 doi: 10.1136/bmj.d2983. Available from: http://www.ncbi.nlm.nih.gov/pmc/articles/PMC3106148/ [DOI] [PMC free article] [PubMed] [Google Scholar]
- 15.Weiss SJ, Derlet R, Amdahl J, et al. Estimating the Degree of Emergency Department Overcrowding in Academic Medical Centers: Results of the National ED Overcrowding Study (NEDOCS) Acad Emerg Med. 2004;11(1):38–50. doi: 10.1197/j.aem.2003.07.017. [DOI] [PubMed] [Google Scholar]
- 16.DeLaney M, Zimmerman KD, Strout TD, Fix ML. The effect of medical students and residents on measures of efficiency and timeliness in an academic medical center emergency department. Acad Med J Assoc Am Med Coll. 2013;88(11):1723–31. doi: 10.1097/ACM.0b013e3182a7f1f8. [DOI] [PubMed] [Google Scholar]
- 17.Ioannides KLH, Mamtani M, Shofer FS, et al. Medical Students in the Emergency Department and Patient Length of Stay. JAMA. 2015;314(22):2411–3. doi: 10.1001/jama.2015.16476. [DOI] [PubMed] [Google Scholar]
- 18.Genuis ED, Doan Q. The effect of medical trainees on pediatric emergency department flow: a discrete event simulation modeling study. Acad Emerg Med Off J Soc Acad Emerg Med. 2013;20(11):1112–20. doi: 10.1111/acem.12252. [DOI] [PubMed] [Google Scholar]
- 19.R Core Team. R: A Language and Environment for Statistical Computing [Internet] Vienna, Austria: R Foundation for Statistical Computing; 2014. Available from: http://www.R-project.org. [Google Scholar]
- 20.Douglas Bates, Martin Mächler, Ben Bolker, Steve Walker. Fitting Linear Mixed-Effects Models Using lme4 | Bates | Journal of Statistical Software. J Stat Softw. 2015;67(1):1–48. [Google Scholar]
- 21.John Fox, Sanford Weisberg. 2nd. Sage Publications; 2011. An R Companion to Applied Regression, Second Edition. [Google Scholar]
- 22.Hothorn T, Bretz F, Westfall P. Simultaneous Inference in General Parametric Models. Biom J. 2008;50(3):346–63. doi: 10.1002/bimj.200810425. [DOI] [PubMed] [Google Scholar]
- 23.Hansen MM, Miron-Shatz T, Lau AYS, Paton C. Big Data in Science and Healthcare: A Review of Recent Literature and Perspectives. Contribution of the IMIA Social Media Working Group. Yearb Med Inform. 2014;9:21–6. doi: 10.15265/IY-2014-0004. [DOI] [PMC free article] [PubMed] [Google Scholar]
- 24.Willis JR, Vitale S, Morse L, et al. The Prevalence of Myopic Choroidal Neovascularization in the United States: Analysis of the IRIS(®) Data Registry and NHANES. Ophthalmology. 2016;123(8):1771–82. doi: 10.1016/j.ophtha.2016.04.021. [DOI] [PubMed] [Google Scholar]
- 25.Mean M, Garnier A, Wenger N, Castioni J, Waeber G, Marques-Vidal P. Computer usage and taskswitching during resident’s working day: Disruptive or not? PloS One. 2017;12(2):e0172878. doi: 10.1371/journal.pone.0172878. [DOI] [PMC free article] [PubMed] [Google Scholar]
- 26.Leafloor CW, Lochnan HA, Code C, et al. Time-motion studies of internal medicine residents’ duty hours: a systematic review and meta-analysis. Adv Med Educ Pract. 2015;6:621–9. doi: 10.2147/AMEP.S90568. [DOI] [PMC free article] [PubMed] [Google Scholar]
- 27.Zheng K, Guo MH, Hanauer DA. Using the time and motion method to study clinical work processes and workflow: methodological inconsistencies and a call for standardized research. J Am Med Inform Assoc JAMIA. 2011;18(5):704–10. doi: 10.1136/amiajnl-2011-000083. [DOI] [PMC free article] [PubMed] [Google Scholar]
- 28.Oberlander J, Laugesen MJ. Leap of Faith — Medicare’s New Physician Payment System. N Engl J Med. 2015;373(13):1185–7. doi: 10.1056/NEJMp1509154. [DOI] [PubMed] [Google Scholar]
- 29.Clough JD, McClellan M. Implementing MACRA: Implications for Physicians and for Physician Leadership. JAMA. 2016;315(22):2397–8. doi: 10.1001/jama.2016.7041. [DOI] [PubMed] [Google Scholar]