

Abstract
Healthcare organizations (HCOs) often deploy rule-based auditing systems to detect insider threats to sensitive patient health information in electronic health record (EHR) systems. These rule-based systems define behavior deemed to be high-risk a priori (e.g., family member, co-worker access). While such rules seem logical, there has been little scientific investigation into the effectiveness of these auditing rules in identifying inappropriate behavior. Thus, in this paper, we introduce an approach to evaluate the effectiveness of individual high-risk rules and rank them according to their potential risk. We investigate the rate of high-risk access patterns and minimum rate of high-risk accesses that can be explained with appropriate clinical reasons in a large EHR system. An analysis of 8M accesses from one-week of data shows that specific high-risk flags occur more frequently than theoretically expected and the rate at which accesses can be explained away with five simple reasons is 16 - 43%.
Introduction
Electronic health record (EHR) systems can improve the quality of patient care, safety and education, while reducing costs and enabling research1. To encourage the adoption and use of EHR systems by healthcare providers, the US government passed the Health Information Technology for Economic and Clinical Health (HITECH) Act of 20092 and established incentives for healthcare providers that demonstrate meaningful use of EHR system to provide better patient care3. As a result, integration of EHR systems into healthcare organizations (HCOs) has continually increased. However, the increased accessibility of protected health information (PHI) in EHR systems leads to a greater potential for misuse and abuse by the authorized users. Such events can result in penalties levied by federal and state regulators.
An EHR is fundamentally a collaborative information system, which, traditionally, is protected through proactive strategies, such as fine-grained access control technologies4. Such technology is often integrated into EHR systems; however, the dynamics of patient care, in combination with the difficulty in predicting who needs access to a patient’s medical record when, make it challenging to deploy such fine-grained control schemas without triggering a substantial quantity of false alerts and slowing care workflows5. Despite acknowledging the potential for insider threats, HCOs typically do not instantiate fine-grained controls6. This implicitly suggests that HCOs deem the losses associated with impacts on workflow and care to be greater than those brought about by employees who misuse or abuse their privileges.
Still, HCOs do not neglect insider threats entirely. In lieu of fine-grained proactive protections, HCOs tend to rely upon retrospective mechanisms, such as auditing and investigation. In the United States, the Security Rule of the Health Information Portability and Accountability of 1996 (HIPAA) requires that all HCOs maintain audit logs, analyze them for inappropriate use and report misuse7. Hospitals maintain audit log of all accesses to PHI and the audit log is often reviewed by administrative officers to detect inappropriate access. However, the sheer volume of accesses documented by large HCOs makes manual review infeasible. The number of access transactions is often over one million per day8, while officers have only one or two people at their disposal (often allocating only a portion of their time) to run investigations. As a result, many HCOs prioritize their investigations by monitoring patient records deemed to be very important persons (VIPs) 9 or upon patient complaints10. In the latter scenario, compliance officers investigate the accesses to patient records after a complaint has been registered.
More recently, there has been a push to (semi-)automate the auditing process. However, there are many challenges an HCO faces to do so. For instance, the information often required to determine if an access is inappropriate is not stored in the audit log11, 12. As a consequence, HCOs have deployed rule-based methods10,13 to capture high-risk behavior and promote them to compliance officers for review. Figure 1 shows the process associated with such a traditional rules-based auditing system. Unfortunately, rule-based flagging systems can result in high false positives9. For example, a typical rule is to flag when an employee accesses an EHR of a patient with the same last name. Yet, for individuals with a common name, clearly this rule will trigger an excessive amount of alerts.
Figure 1.
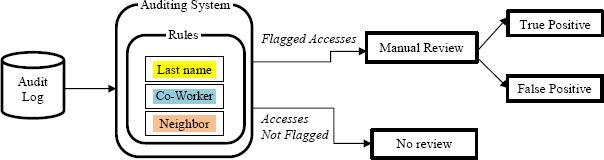
The process by which an HCO investigates accesses to EHRs deemed to be of high risk.
Given the state of affairs, we set out to assess the validity of rules for auditing accesses made in EHR systems. The goal of this study is to test, through simulation and theoretical analyses, if these flags occur at a higher rate than expected, and therefore serve as a valid means to detect inappropriate behavior. Our contributions in this work are as follows:
-
1.
Investigate the difference between observed and expected high-risk accesses. We introduce an approach to investigate the difference between the observed and expected rate of high-risk accesses in EHR systems for typical expert-specified rules. If a rule holds merit, we anticipate that the observed rate of high-risk accesses will be higher than the expected rate of high-risk accesses to the EHR system. Using one week of data from Vanderbilt University Medical Center (VUMC), we show that there are many rules for which this difference is statistically significant.
-
2.
Select and prioritize rules based on deviation between observed and expected. We introduce an approach for selection and prioritization of the high-risk rules. This approach is based on the magnitude of the deviation between the observed and expected frequency of high-risk accesses for each rule.
-
3.
Prioritize flagged high-risk accesses for investigation. To improve the manageability of a manual review process in resource constrained environments, explanation-based filtering10 can be utilized to prioritize the flagged accesses for manual review. Note that rule-based flagging and explanation-based filtering are complementary approaches to detect inappropriate behavior. While rules capture the high-risk behavior, explanations reduce the set of accesses that need to be investigated to a set of un-explained accesses. We find synergy between these two auditing approaches and introduce an explanation-based mechanism to prioritize high-risk accesses flagged by rules for manual investigation. We show that many, though not all, of the highrisk accesses can be explained away with clinically justifiable reasons.
Background
Many HCOs use modern EHR systems equipped with automatic log collection to maintain the audit log. Each time an employee accesses a patient’s record, the automatic log collection process adds a transaction to the audit log with the details of the access including user, patient, action performed (e.g., viewed reports) and time of access.
Various auditing strategies have been proposed to detect inappropriate insider accesses in EHRs. Boxwala et al. introduced an approach to automate the process of detecting suspicious access to EHRs using statistical and supervised machine-learning techniques9. In this technique, audit logs and data from EHRs were applied to construct features to learn predictive models and rank suspicious, as well as non-suspicious, accesses. Training data for such models were provided by HCO privacy officials. Recognizing that not all suspicious accesses are affiliated with a specific pattern, a variety of frameworks have been developed to detect anomalous accesses based on deviations from expected behavior14, 15.
Still, all of these methods assume that all accesses should be considered for predictive purposes, which is potentially problematic because there is substantial class imbalance. Specifically, the rate at which inappropriate accesses actually transpire is likely to be orders of magnitude smaller than the rate at which appropriate accesses are committed. Thus, to mitigate skew in the prior probabilities for such statistical models, as well as manual audits, the notion of an explanation-based auditing system (EBAS) was proposed. EBAS works by filtering out accesses to the EHR according to explanations generated automatically from the data by a mining algorithm10,16. While all of these auditing strategies offer certain benefits over the simple rule-based auditing system, currently approaches based on the latter are in common use by HCOs.
Methodology
We hypothesize that a high-risk audit rule holds merit when the observed frequency at which it fires is higher than what would occur due to routine daily behavior. To test this hypothesis, we compare the observed frequency of high-risk accesses in a large EHR audit log with what one might expect to observe at random. We apply a goodness of fit test to determine if there is a significant difference between the observed and expected frequencies. We further examine the observed high-risk accesses flagged by each rule to determine the minimum rate in that these accesses can be explained with clinical reasons.
Data overview
The data investigated in this study is drawn from the VUMC EHR system. Table 1 depicts the data investigated in this study. These data are an integration of EHR audit log, employee personal information, patient personal information (e.g., names, dates of birth, and residential addresses) with information about the department for which the employee is affiliated (e.g., the Anesthesiology department).
Table 1.
Summary of the VUMC data used in this investigation.
| Total Accesses | Repeat Accesses | Self-Accesses | Unique Non-Self Accesses(LEP) | Unique Employees(E) | Unique Patients(P) | Unique Departments |
|---|---|---|---|---|---|---|
| 7.5M | 6.9M | 21K | 710K | 13K | 152K | 2.1K |
We designate an access as a Self-access when the employee has accessed his/her own record. We assume this occurs when the first name, last name and date of birth of the employee and patient in the access are the same. We designate an access as a Repeat access when the employee accesses the record of the same patient earlier in the week. All of the accesses except the first access are considered as Repeat accesses.
Types of high-risk behavior
While there are many types of high-risk behavior, we selected the following types for our experiments through background analysis. Specifically, we investigate five high-risk rules in this study:
-
1.
HCO Co-Worker: The EHR user and patient are both employees of the VUMC.
-
2.
Department Co-Worker: The EHR user and patient work in the same VUMC department.
-
3.
Last Name: The EHR user and patient have the same last name.
-
4.
Geographic Proximity: The EHR user lives within 0.25 miles of the patient.
-
5.
Residential Street: The EHR user lives on the same street as the patient.
In addition, we added one rule to ascertain if the results of our experiments are merely an artifact of the data or if they are indicative of suspicious behavior:
-
6.
First Name: The EHR user and patient have the same first name.
Method overview
In this section we provide an overview of the method to test our hypothesis and to determine the minimum rate of high-risk accesses explained with a clinical reason, as depicted in Figure 2.
Figure 2.
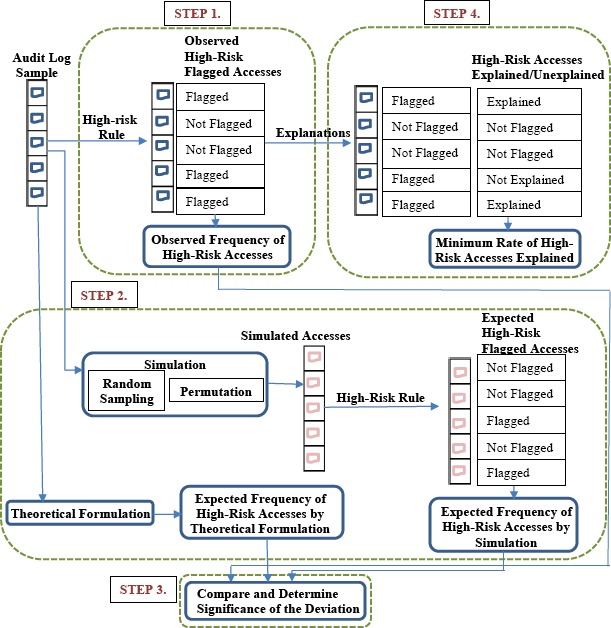
The steps to compute the observed and expected frequencies of high-risk accesses, and the minimum rates that high-risk accesses can be explained.
The steps in this method are defined broadly as follows:
-
1.
Determine the observed frequency of the high-risk accesses.
-
2.Determine the expected frequency of high-risk accesses by:
-
2.1.Using simulations with random samples of users and patients.
-
2.2.Using simulations with permutations of users and patients.
-
2.3.Using a theoretical formulation.
-
2.1.
-
3.
Using simulations with permutations of users and patients. Compare the observed frequency of high-risk accesses to the expected frequency of high-risk accesses, and determine the significance of the deviation between the observed and expected frequency.
-
4.
Use the explanation-based method to identify the observed high-risk accesses that can be explained with clinical reasons, and determine the minimum rate that observed high-risk accesses can be explained.
Observed and expected frequencies of high-risk accesses
Figure 3 depicts the method to obtain the observed accesses by sampling the audit log and simulation of the expected accesses using permutation and random sampling methods. We explain these methods in detail in the following sections.
Figure 3.
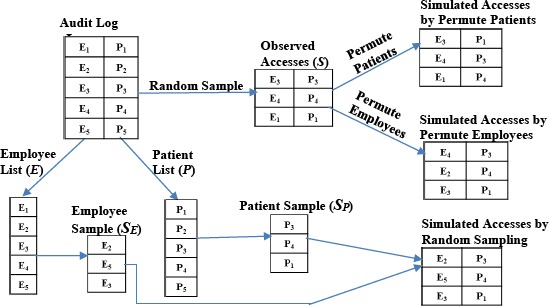
An overview of the process for sampling the observed accesses and simulation of the expected accesses.
Observed. We obtain the observed frequency of high-risk accesses empirically from the set of unique employee-patient pairs LEP, where E is the list of employees (or users) and P is the list of patients in the employee-patient access pairs LEP. These pairs are obtained from the 710,000 unique accesses in the audit log and are devoid of any self-access. We select a random sample S of 100,000 pairs from LEP, each of which is assessed for the high-risk criteria. We count the occurrence of the high-risk accesses across the sample and calculate the frequency of the high-risk accesses in the sample as \high-risk accesses| / |S|.
Expected. To simulate accesses and obtain an expected frequency distribution of high-risk behaviors we apply both permutation and random sampling methods. We use two distinct methods to confirm these simulation methods do not result in selection bias and that the sample selected by our methods are representative of the population. We compare the results of the simulations to verify if the results lead to the same conclusion.
Expected: Permutation. In this approach, we construct simulated accesses by shuffling the data points in S. We use two types of permutation methods to simulate accesses and verify that results of both the methods lead to the same conclusion. 1) Permute Patients: This method shuffles the list of patients while holding the list of employees in sample S constant. 2) Permute Employees: This method shuffles the list of employees while fixing the list of patients in sample S.
Expected: Random Sampling. We obtain the employee list E and the patient list P from the set of employee-patient pairs LEP. Next, we select a random sample of 100,000 employees SE and 100,000 patients SP (without replacement) from E and P, respectively. We then construct simulated accesses by randomly matching the records in SE and SP.
For each simulation, we calculate the frequency of high-risk accesses in sample S.
Expected: Theoretical Formulation. The expected frequency of high-risk accesses is computed empirically, using the probabilities of high-risk accesses occurring among the employees and patients in sample S. We determine the expected frequency for five of the six rules presented above.
The expected frequency of the high-risk accesses using probabilities is computed as , where, PEi = \Employee with attribute value x| / |SE|, Ppti- = \Patient with attribute value x| / \SP\, attributes: [last name, first name, residential street name, work department name] and Se and Sp are the lists of employees and patients in S, respectively.
Experimental Evaluation. We run 10 experiments each for the randomization and permutation methods to compute the observed and expected frequencies of high-risk accesses. We compute the ratio of the mean observed frequency to mean expected frequency for each of the high-risk rules. We also compute the percentage of observed and expected high-risk accesses for each high-risk type to determine the rate of observed and expected high-risk accesses.
Minimum rate of high-risk accesses explained
While there are many operational and clinical reasons that can explain the reason for accesses in an EHR, we select primary treatment, payment and healthcare operations (TPO)17 to ascertain the extent to which high-risk accesses can be explained. We specifically focus on explanations in the form of 1) scheduled appointments, 2) ordered lab results, 3) ordered medications, 4) admission, discharge, and transfer events, and 5) clinical documentation. A high-risk access can have multiple explanations (e.g., patient had a scheduled appointment with the accessing employee, and patient also had a lab order with the accessing employee). We use the explanation-based approach to prioritize the observed high-risk accesses for further investigation by administrative officers, with unexplained accesses considered as high priority for the investigation. The explained accesses can be ranked using the type and number of explanations available for the access.
Since we do not exhaust the list of possible reasons, we compute the minimum rate at which high-risk accesses can be explained for each high-risk rule. Additional plausible explanations for the access exist (e.g., user performed surgery on the patient) and could be invoked to raise the rate.
Goodness of fit chi-square test
We apply a χ2 test to determine the goodness of fit between the observed (empirical) and expected (simulated) number of occurrences of high-risk accesses. This test is designed to ascertain if there is a significant difference, such that these deviations are likely not the result of chance alone. The measure of goodness of fit is where Oi and Ei are the observed and expected high-risk event frequencies of type i, respectively.
We test this value against a χ2 distribution with 1 degree of freedom. This is because there are two categories: 1) High-risk accesses, 2) Non-high-risk accesses. We perform this test at the 0.01 significance level (i.e., we accept the alternative hypothesis when the value result is below this level).
Results
In this section, we summarize the deviation of the observed from the expected high-risk access rates obtained by four methods 1) Permute Patients, 2) Permute Employees, 3) Random Sampling and 4) Theoretical formulation, for each high-risk access rule. We begin by presenting the rate of observed and expected high-risk accesses. Next, we summarize the minimum explanation rate for the high-risk accesses. Finally, we report the statistical significance of the deviation between the observed and expected high-risk access rates.
Observed versus expected frequencies of high-risk access
Table 2 summarizes the observed to expected frequency ratios for the various high-risk access rules. It was found that the ratio of observed to expected frequencies varies from 0.99 to 4.33 for the high-risk behavior rules. The observed frequency of the high-risk accesses is higher than the expected frequency for all the high-risk rules except for the HCO Co-Worker rule, which is approximately 1 (at 0.99).
Table 2.
Observed to expected frequency ratio for the high-risk access rules.
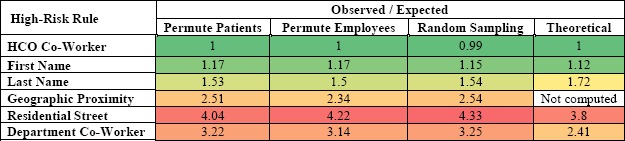 |
As expected, the ratio of observed to expected frequencies for the First Name high-risk class ranges from 1.12 to 1.17 for the four methods, suggesting there is no significant deviation between the observed and expected frequencies for this rule.
While the Geographic Proximity rule identifies if the patient and employee live within a fixed distance (0.25 miles), the Residential Street rule identifies if the patient and user live on the same street. Limiting the high-risk criteria to street name results in the higher ratio of observed to expected for the Residential Street rule than the ratio of observed to expected for Geographic Proximity rule.
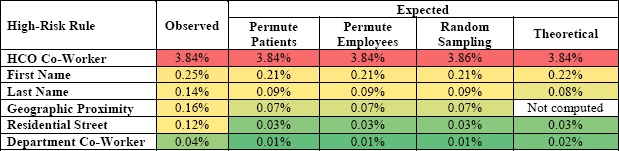
Table 3 shows the percentage of observed and expected high-risk accesses for each high-risk type in a sample of 100,000 accesses. The average percentage of observed high-risk accesses ranged from 0.03% to 3.8%. Though the percentage of high-risk accesses for HCO Co-Worker is higher than other types (by more than 3%), the observed frequency of high-risk accesses does not deviate from the expected (see Table 2). This suggests that these accesses can be assigned the lowest priority for investigation. The percentage of observed and expected high-risk accesses for the rest of the high-risk rules is less than 1%, but given that millions of accesses are committed per week, this small percentage yields non-trivial numbers of high-risk accesses.
Table 3.
The observed versus expected percentage for the high-risk access rules.
 |
Minimum rate of high-risk access explained away
Table 4 summarizes the average rate (over 10 experiments) at which the observed high-risk accesses can be explained with clinical reasons. Notably, the selected set of explanations accounted for less than 50% of the accesses.
Table 4.
The rate at which high-risk alerts would be explained away.
| High-Risk Rule | Observed Accesses ExplainedAway | Standard deviation |
|---|---|---|
| HCO Co-Worker | 38.78% | 0.67 |
| First Name | 35.59% | 2.54 |
| Last Name | 21.43% | 2.88 |
| Geographic Proximity | 24.79% | 3.13 |
| Residential Street | 16.11% | 4.88 |
| Department Co-Worker | 43.90% | 9.32 |
Table 5 summarizes the distribution of the explanations per high-risk rule. The highest number of high-risk accesses is explained with the Clinical documentation explanation for all high-risk rules, with the percentage of accesses explained in the range of 15% to 43%. Scheduled Appointment explains 2% to 8% of the high-risk accesses. The other four explanations explain less than 5% of the high-risk accesses for all high-risk rules. The Clinical Documentation explanation shows high standard deviation (9.26) for the high-risk rule Department Co-Worker because of two outlier experiments with the highest and lowest number of explained accesses, respectively.
Table 5.
Distribution of explanations per high-risk rule (STD DEV = Standard dev).
| High-Risk Rule | % Observed Accesses Explained Away | |||||||||
|---|---|---|---|---|---|---|---|---|---|---|
| Scheduled Appointment | Ordered Lab | Ordered Medications | (Admission, Discharge and Transfer events) | Clinical Documentation | ||||||
| % | STH DEV | % | STH DEV | % | STH DEV | % | STH DEV | % | STD DEV | |
| HCOCo-Worker | 7.50 | 0.30 | 1.28 | 0.22 | 0.006 | 0.01 | 0.43 | 0.05 | 37.94 | 0.67 |
| First Name | 8.76 | 1.29 | 1.59 | 0.67 | 0 | 0 | 0.85 | 0.54 | 34.60 | 2.51 |
| Last Name | 2.23 | 1.01 | 0.43 | 0.37 | 0.22 | 0.35 | 0.22 | 0.35 | 20.69 | 3.15 |
| Geographic Proximity | 6.33 | 1.47 | 1.07 | 0.65 | 0 | 0 | 0.35 | 0.49 | 24.25 | 3.38 |
| Residential Street | 2.99 | 1.50 | 0.69 | 0.37 | 0 | 0 | 0.15 | 0.33 | 15.68 | 5.06 |
| Department Co-Worker | 8.26 | 4.00 | 1.4 | 2.02 | 0 | 0 | 1.10 | 1.43 | 43.6 | 9.26 |
Hypothesis test
Table 6 shows the χ2 result for a sample S of 100,000 unique accesses that are devoid of self-accesses. The expected number of accesses for this experiment was simulated through the permutation method (i.e., shuffling the list of patients and keeping list of employee fixed in the observed accesses). It should be noted that we did not include the Co-Worker rule in the χ2 test because the results showed that there was no difference between the observed and expected accesses for this high-risk class.
Table 6.
Results of the χ2 test for goodness of fit between the observed and expected with one degree of freedom per experiment.
| High-Risk Rule | Observed | Expected | χ2 | Probability |
|---|---|---|---|---|
| First Name | 245 | 208 | 6.42 | 0.0113 |
| Non High-Risk | 99755 | 99792 | ||
| Last Name | 140 | 91 | 25.87 | <0.0001 |
| Non High-Risk | 99860 | 99909 | ||
| Geographic Proximity | 166 | 66 | 150.1 | <0.0001 |
| Non High-Risk | 99834 | 99934 | ||
| Residential Street | 115 | 28 | 267.29 | <0.0001 |
| Non High-Risk | 99885 | 99972 | ||
| Department Co-Worker | 36 | 11 | 54.58 | <0.0001 |
| Non High-Risk | 99964 | 99989 | ||
The result of the χ2 for high-risk rules Last Name, Geographic Proximity, Residential Street and Department Co-Worker indicated a probability < 0.0001. This is below the 0.01 significance level, such that we accept the alternative hypothesis for these high-risk rules (i.e., the difference between the observed and expected frequency of high-risk accesses for these rules is statistically significant). The result of the χ2 for First Name indicated a probability of 0.0113, which is above the 0.01 significance level, such that we reject the alternative hypothesis (i.e., there is no significant difference between observed and expected frequencies of high-risk accesses). This is notable because it suggests that our control rule is functioning correctly.
Discussion
This study examined the extent to which high-risk EHR access rules are plausible in practice. Our empirical investigation illustrates that the observed rate at which high-risk rules are triggered is higher, at a statistically significant level, than what one would expect at random for several typical classes of high-risk behavior. This significant deviation suggests that there may be systematic EHR user behavior that requires further investigation, implying those rules may hold merit. Still, not all rules deviate to the same degree. In this respect, we further believe that the magnitude of the deviation of the observed frequency of high-risk accesses from their expected frequency obtained from each high-risk class may be a plausible measure to assist in the prioritization of auditing rules in emerging game theoretic frameworks18.
Geographical Proximity and Residential Street rules are designed to capture the same high-risk behavior (i.e. a user accessing records of a patient living in close geographic vicinity of the user). However, these two rules yield different results in terms of number of accesses flagged and the deviation of observed frequency from expected frequency of flagged accesses. Notably, the user and patient in 15% of the accesses flagged by the Residential Street rule do not live within 0.25 miles of each other, and the Geographical Proximity rule missed 37% of the Residential Street rule accesses. Also the length of the streets in the city varies from 0.4 miles to over 10 miles leading to a nonuniform application of the geographic vicinity criteria. This result indicates that rule definitions play an important role in effectively capturing high-risk behavior.
Despite their potential, high-risk access rules often have a high false positive rate. This makes them prohibitively expensive for HCOs to systematically investigate, which is a concern given the limited budgets available to privacy officers. However, we show that high-risk access rules can be complemented through an explanation-based model, such that many accesses can be explained away by valid TPO reasons (16% to 44% depending on the high-risk rule at minimum). We believe this is notable because it suggests that high-risk rules and explanations are not correlated. Nonetheless, we believe that, in this setting, the explanations can be used to prioritize high-risk accesses for manual investigation. The unexplained accesses can be considered high priority for investigation, while the explained accesses can be ranked using the type and number of explanations available for the access.
There are, however, several limitations of this study that we wish to highlight for future investigations. First, it should be recognized that a rule-based auditing system is inherently limited by its reliance on predefined rules, which themselves are often based on domain expertise. More broadly there are many possible reasons for inappropriate access. As a result, the access coverage (i.e., proportion of accesses effectively monitored by high-risk rules) is low. Second, rule-based flagging of high-risk accesses is dependent on the correctness and completeness of EHR data. Incorrect EHR data (e.g., the wrong patient’s last name is entered into the EHR system) leads to gaps in identifying a potential high-risk access. Similarly, an incomplete address or a P.O. Box would lead to gaps in flagging a potentially high-risk access according to the Residential Proximity or Residential Street rule. Third, an explanation-based system relies solely on the data stored in the database to generate explanation for an access. Missing information (or non-documented relationships) may result in few unexplained appropriate accesses. For example, EHR systems maintain records of patient appointments with doctors, but they do not explicitly record the relationship between the doctor and the nurse working together at the appointment. Thus, the system cannot readily explain the access of patient’s record by the nurse working with the doctor, though the access in this case is appropriate. Other research has posited enhancing explanations with additional data learned from diagnosis information10. Fourth, this study does not test if a flagged access is in fact an inappropriate access. A flagged access needs to be investigated manually by a privacy officer to determine if it is a true inappropriate access. However, this manual investigation is beyond the scope of this study. Fifth, in this study we only consider simple high-risk rules. In a future investigation we plan to study more complex and nested high-risk rules. Sixth, this study suggests that different high-risk rules yield different results, but does not investigate the reasons for the differences.
Finally, we note that this investigation focused on data from only a one-week period from a single medical center. As such, it will be necessary to validate these findings with data from a broader time period and over other healthcare organizations.
Conclusions
This paper examined the rate of high-risk access rules in the electronic health record of a large healthcare organization. Specifically, we compared the observed and expected rates to ascertain the extent to which such rules are potentially useful in practice. The primary finding of this investigation was that such rules appear to detect behaviors that are statistically significantly different than what would transpire under random activities. There are many reasons why such deviation might transpire, but our investigation shows that such rules should not be dismissed.
Acknowledgements
This research was sponsored, in part, by grants 1526014 and 1536871 from the National Science Foundation and R01LM010207 from the National Institutes of Health.
References
- 1.Menachemi N, Brooks RG. Reviewing the benefits and costs of electronic health records and associated patient safety technologies. J Med Syst. 2006;30(3):159–68. doi: 10.1007/s10916-005-7988-x. [DOI] [PubMed] [Google Scholar]
- 2.U.S. Department of Health and Human Services. HITECH Act Enforcement Interim Final Rule. 2009. [Accessed February 26, 2017]. https://www.hhs.gov/hipaa/for-professionals/special-topics/HITECH-act-enforcement-interim-final-rule/
- 3.Blumenthal D, Tavenner M. The “meaningful use” regulation for electronic health records. N Engl J Med. 2010;363(6):501–504. doi: 10.1056/NEJMp1006114. [DOI] [PubMed] [Google Scholar]
- 4.Blobel B. Authorisation and access control for electronic health systems. Int J Med Inform. 2004;73:251–7. doi: 10.1016/j.ijmedinf.2003.11.018. [DOI] [PubMed] [Google Scholar]
- 5.Røstad L, Edsberg O. A study of access control requirements for healthcare systems based on audit trails from access logs. Proc Annual Computer Security Applications Conference. 2006:175–86. [Google Scholar]
- 6.Ferreira A, Cruz-Correia R, Antunes L, Chadwick DW. Access control: How can it improve patients healthcare? Stud Health Technol Inform. 2007;127:65–76. [PubMed] [Google Scholar]
- 7.U.S. Department of Health and Human Services. Modifications to the HIPAA Privacy, Security, Enforcement, and Breach Notification Rules under the Health Information Technology for Economic and Clinical Health Act and the Genetic Information Nondiscrimination Act. 2013. Mar 26, https://www.federalregister.gov/documents/2013/01/25/2013-01073/modifications-to-the-hipaa-privacy-security-enforcement-and-breach-notification-rules-under-the. [PubMed]
- 8.Malin B, Nyemba S, Paulett P. Learning relational policies from electronic health record access logs. J Biomed Inform. 2011;44(2):333–42. doi: 10.1016/j.jbi.2011.01.007. [DOI] [PMC free article] [PubMed] [Google Scholar]
- 9.Boxwala AA, Kim J, Grillo JM, Ohno-Machado L. Using statistical and machine learning to help institutions detect suspicious access to electronic health records. J Am Med Inform Assoc. 2011;18:498–505. doi: 10.1136/amiajnl-2011-000217. [DOI] [PMC free article] [PubMed] [Google Scholar]
- 10.Fabbri D, LeFevre K. Explaining accesses to electronic medical records using diagnosis information. J Am Med Inform Assoc. 2012;20(1):52–60. doi: 10.1136/amiajnl-2012-001018. [DOI] [PMC free article] [PubMed] [Google Scholar]
- 11.Asaro PV, Herting RL, Jr, Roth AC, Barnes MR. Effective audit trails--a taxonomy for determination of information requirements. Proc AMIA Symp. 1999:663–5. [PMC free article] [PubMed] [Google Scholar]
- 12.Herting RL, Jr, Asaro PV, Roth AC, et al. Using external data sources to improve audit trail analysis. Proc AMIA Symp. 1999:795–9. [PMC free article] [PubMed] [Google Scholar]
- 13.Asaro PV, Ries JE. Data mining in medical record access logs. Proc AMIA Symp. 2001:855. [Google Scholar]
- 14.Li X, Xue Y, Malin B. Detecting anomalous user behaviors in workflow-driven web applications. Proc 31st IEEE Symposium on Reliable Distributed Systems. 2012:1–10. [Google Scholar]
- 15.Zhang H, Mehotra S, Liebovitz D, Gunter CA, Malin B. Mining deviations from patient care pathways via electronic medical record system audits. ACM Transactions on Management Information Systems. 2013;4(4):17. [Google Scholar]
- 16.Fabbri D, LeFevre K. Explanation-based auditing. Proceedings of the Very Large Data Bases Endowment. 2011;5:1–12. [Google Scholar]
- 17.U.S. Department of Health & Human Services. 45 CFR 164.501. Uses and Disclosures for Treatment, Payment, and Health Care Operations. [Accessed July 6, 2017]. https://www.hhs.gov/hipaa/for-professionals/privacy/guidance/disclosures-treatment-payment-health-care-operations/index.html.
- 18.Laszka A, Vorobeychik Y, Fabbri D, Yan C, Malin B. A game-theoretic approach for alert prioritization. Proc AAAI Workshop on Artificial Intelligence for Cyber Security. 2017 [Google Scholar]