

Abstract
Many long non‐coding RNAs (lncRNAs) are expressed during central nervous system (CNS) development, yet their in vivo roles and mechanisms of action remain poorly understood. Paupar, a CNS‐expressed lncRNA, controls neuroblastoma cell growth by binding and modulating the activity of transcriptional regulatory elements in a genome‐wide manner. We show here that the Paupar lncRNA directly binds KAP1, an essential epigenetic regulatory protein, and thereby regulates the expression of shared target genes important for proliferation and neuronal differentiation. Paupar promotes KAP1 chromatin occupancy and H3K9me3 deposition at a subset of distal targets, through the formation of a ribonucleoprotein complex containing Paupar, KAP1 and the PAX6 transcription factor. Paupar‐KAP1 genome‐wide co‐occupancy reveals a fourfold enrichment of overlap between Paupar and KAP1 bound sequences, the majority of which also appear to associate with PAX6. Furthermore, both Paupar and Kap1 loss‐of‐function in vivo disrupt olfactory bulb neurogenesis. These observations provide important conceptual insights into the trans‐acting modes of lncRNA‐mediated epigenetic regulation and the mechanisms of KAP1 genomic recruitment, and identify Paupar and Kap1 as regulators of neurogenesis in vivo.
Keywords: chromatin, gene regulation, KAP1, lncRNA, neurogenesis
Subject Categories: Chromatin, Epigenetics, Genomics & Functional Genomics; Neuroscience; RNA Biology
Introduction
A subset of nuclear long non‐coding RNAs (lncRNAs) have been shown to act as transcription and chromatin regulators using various mechanisms of action. These include local functions close to the sites of lncRNA synthesis (Engreitz et al, 2016) as well as distal modes of action across multiple chromosomes (Chalei et al, 2014; Vance et al, 2014). Moreover, lncRNA regulatory effects may be mediated by the act of lncRNA transcription as well as RNA sequence‐dependent interactions with transcription factors and chromatin‐modifying proteins (Vance & Ponting, 2014; Rutenberg‐Schoenberg et al, 2016). Some lncRNAs have been proposed to act as molecular scaffolds to facilitate the formation of multicomponent ribonucleoprotein regulatory complexes (Tsai et al, 2010; Zhao et al, 2010; Ilik et al, 2013; Maenner et al, 2013; Yang et al, 2014b), whilst others may act to guide chromatin‐modifying complexes to specific binding sites genome‐wide (Vance & Ponting, 2014). Studies of cis‐acting lncRNAs such as Haunt and Hottip have shown that lncRNA transcript accumulation at their sites of expression can effectively recruit regulatory complexes (Yin et al, 2015; Pradeepa et al, 2017). LncRNAs, however, have also been reported to directly bind and regulate genes across multiple chromosomes away from their sites of synthesis (Chu et al, 2011; Chalei et al, 2014; Vance et al, 2014; West et al, 2014; Carlson et al, 2015). By way of contrast, the mechanisms by which such trans‐acting lncRNAs mediate transcription and chromatin regulation at distal bound target genes are less clear.
LncRNAs show a high propensity to be expressed in various brain regions and cell types relative to other tissues (Mercer et al, 2008, 2010; Ponjavic et al, 2009). The adult neurogenic stem cell‐containing mouse subventricular zone (SVZ) generates neurons throughout life, contributes to brain repair and can be stimulated to limit damage, but is also a source of tumours (Bardella et al, 2016; Chang et al, 2016). During SVZ lineage progression, neural stem cells give rise to transit amplifying progenitors which in turn generate neuroblasts that migrate in the rostral migratory stream (RMS) to the olfactory bulbs (OB; Doetsch et al, 1999). The neuroblasts primarily become granule neurons that differentiate by extending long branched dendritic processes towards the glomerular layer (Petreanu & Alvarez‐Buylla, 2002). There they integrate into and modulate circuitry connecting peripheral olfactory receptor neurons with the output neurons of the OB (Gheusi et al, 2000; Lledo & Saghatelyan, 2005). It has been estimated that 8,992 lncRNAs are expressed in the SVZ neurogenic system, many of which are differentially expressed during SVZ/OB neurogenesis, suggesting that at least some of these transcripts may play regulatory roles (Ramos et al, 2013). However, only a minority of SVZ expressed lncRNAs have been analysed functionally and the full scope of their molecular mechanisms of action remain poorly understood.
Kap1 encodes an essential chromatin regulatory protein that plays a critical role in embryonic development and in adult tissues. Kap1−/− mice die prior to gastrulation while hypomorphic Kap1 mouse mutants display multiple abnormal embryonic phenotypes, including defects in the development of the nervous system (Cammas et al, 2000; Herzog et al, 2011; Shibata et al, 2011). KAP1 interacts with chromatin binding proteins such as HP1 and the SETDB1 histone‐lysine N‐methyltransferase to control heterochromatin formation and to silence gene expression at euchromatic loci (Iyengar & Farnham, 2011). Despite this fundamental role in epigenetic regulation, the mechanisms of KAP1 genomic targeting are not fully understood. KAP1 does not contain a DNA binding domain but was originally identified through its interaction with members of the KRAB zinc finger (KRAB‐ZNF) transcription factor family. Subsequent studies, however, revealed that KRAB–ZNF interactions cannot account for all KAP1 genomic recruitment events. KAP1 preferentially localises to the 3′ end of zinc finger genes as well as to many promoters and intergenic regions in human neuronal precursor cells. A mutant KAP1 protein, however, that is unable to interact with KRAB‐ZNFs still binds to promoters, suggesting functionally distinct subdomains (Iyengar et al, 2011). This work points to the presence of alternative, KRAB‐ZNF‐independent, mechanisms that operate to target KAP1 to a distinct set of genomic binding sites. We reasoned that this may involve specific RNA–protein interactions between KAP1 and chromatin‐bound lncRNAs.
The CNS‐expressed intergenic lncRNA Paupar represents an ideal candidate chromatin‐enriched lncRNA with which to further define trans‐acting mechanisms of lncRNA‐mediated gene and chromatin regulation. Paupar is transcribed upstream from the Pax6 transcription factor gene and acts to control proliferation and differentiation of N2A neuroblastoma cells in vitro (Vance et al, 2014). Paupar regulates Pax6 expression locally, physically associates with PAX6 protein and interacts with distal transcriptional regulatory elements to control gene expression on multiple chromosomes in N2A cells in a dose‐dependent manner. Here, we show that Paupar directly interacts with KAP1 in N2A cells and that together they control the expression of a shared set of target genes enriched for regulators of neural proliferation and differentiation. Our findings indicate that Paupar, KAP1 and PAX6 physically associate on chromatin within the regulatory region of shared target genes and that Paupar knockdown reduces both KAP1 chromatin association and histone H3 lysine 9 trimethylation (H3K9me3) at PAX6 co‐bound locations. Genome‐wide occupancy maps further identified a fourfold enrichment in the overlap between Paupar and KAP1 binding sites on chromatin, the majority of which (73%) are also estimated to be bound by PAX6. Our results also show that both Paupar and KAP1 loss‐of‐function in vivo disrupt SVZ/OB neurogenesis. We propose that Paupar and Kap1 are novel regulators of neurogenesis in vivo and that Paupar operates as a transcriptional cofactor to promote KAP1‐dependent chromatin changes at a subset of bound regulatory elements in trans via association with non‐KRAB‐ZNF transcription factors such as PAX6.
Results
Paupar directly binds the KAP1 chromatin regulatory protein in mouse neural cells in culture
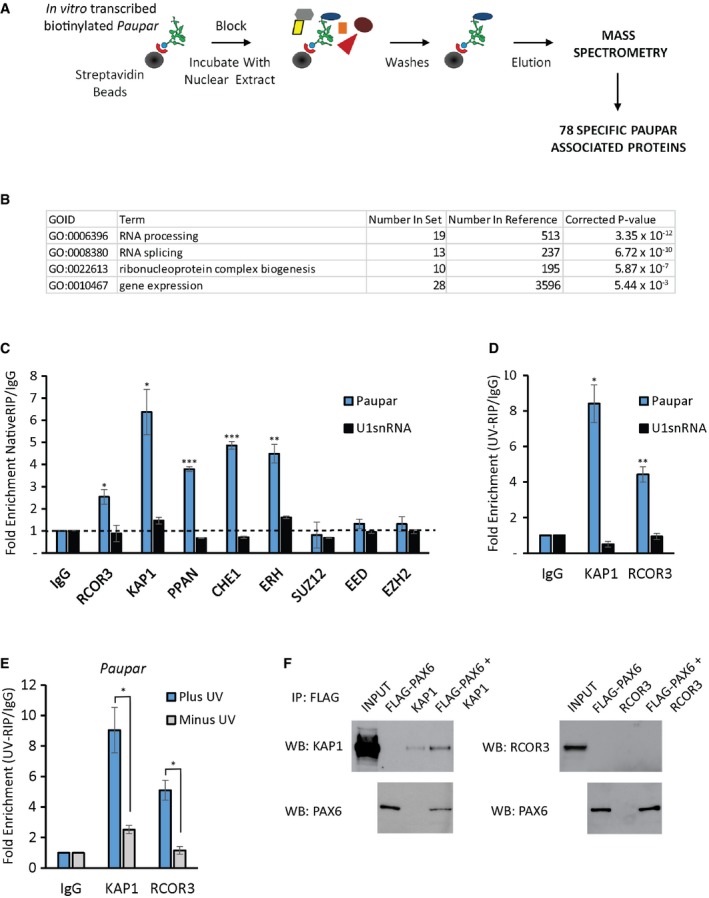
The lncRNA Paupar binds transcriptional regulatory elements across multiple chromosomes to control the expression of distal target genes in N2A neuroblastoma cells (Vance et al, 2014). Association with transcription factors such as PAX6 assists in targeting Paupar to chromatin sites across the genome. As Paupar depletion does not alter PAX6 chromatin occupancy (Vance et al, 2014), we hypothesised that Paupar may recruit transcriptional cofactors to PAX6 and other neural transcription factors to regulate gene expression. To test this, we sought to identify transcription and chromatin regulatory proteins that bind both Paupar and PAX6 in N2A cells in culture. In vitro‐transcribed biotinylated Paupar was therefore immobilised on streptavidin beads and incubated with N2A cell nuclear extract in a pulldown assay. Bound proteins were washed, eluted and identified using mass spectrometry (Fig 1A). This identified a set of 78 new candidate Paupar‐associated proteins that do not bind a control RNA of similar size, including 28 proteins with annotated functions in the control of gene expression that might function as transcriptional cofactors (Fig 1B and Dataset EV1).
Figure 1. Paupar directly binds the KAP1 chromatin regulatory protein in mouse N2A neuroblastoma cells.
-
AOverview of the pulldown assay. In vitro‐transcribed biotinylated Paupar RNA was immobilised on streptavidin beads and incubated with N2A cell nuclear extract. Bound RNA protein complexes were extensively washed and specific Paupar‐associated proteins, which do not interact with a control mRNA of a similar size, identified by mass spectrometry.
-
BGene Ontology terms were used to annotate Paupar‐associated proteins according to biological process. The Bonferroni correction was used to adjust the P‐values to correct for multiple testing.
-
CEndogenous Paupar transcript interacts with transcription and chromatin regulatory proteins in N2A cells. Paupar association with the indicated proteins was measured using native RNA‐IP. Whole cell lysates were prepared and the indicated regulatory proteins immuno‐precipitated using specific antibodies. Bound RNAs were purified and the levels of Paupar and the U1snRNA control detected in each RIP using qRT–PCR. Paupar transcript directly interacts with KAP1 and RCOR3 in N2A cells.
-
D, ENuclear extracts were prepared from UV cross‐linked (D) and untreated (E) cells and immuno‐precipitated using either anti‐KAP1, anti‐RCOR3 or a rabbit IgG control antibody. Associated RNAs were stringently washed and purified. The levels of Paupar and the U1snRNA control transcript were detected in each UV‐RIP using qRT–PCR.
-
FPAX6 associates with KAP1 in N2A cells. FLAG‐PAX6 and KAP1 or RCOR3 expression vectors were transfected into N2A cells. Lysates were prepared 2 days after transfection and FLAG‐PAX6 protein immuno‐precipitated using anti‐FLAG beads. Co‐precipitated proteins were detected by Western blotting.
We next performed native RNA‐IP experiments in N2A cells to validate potential associations between the endogenous Paupar transcript and five gene expression regulators. These candidates were as follows: RCOR3, a member of the CoREST family of proteins that interact with the REST transcription factor; KAP1, a key epigenetic regulator of gene expression and chromatin structure; PPAN, a previously identified regulator of Pax6 expression in the developing eye; CHE‐1, a polymerase II interacting protein that functions to promote cellular proliferation and block apoptosis; and ERH, a transcriptional cofactor that is highly expressed in the eye, brain and spinal cord.
The results revealed that the Paupar transcript, but not a non‐specific control RNA, was > twofold enriched using antibodies against RCOR3, KAP1, ERH, PPAN or CHE1 compared to an IgG isotype control in a native RNA‐IP experiment (Fig 1C). In addition, Paupar did not associate above background with SUZ12, EED and EZH2 Polycomb proteins used as negative controls. This served to further confirm the specificity of the Paupar lncRNA–protein interactions because Polycomb proteins associate with a large number of RNAs (Davidovich et al, 2015) and yet were not identified as Paupar interacting proteins in our pulldown assay. The endogenous Paupar transcript therefore associates with proteins involved in transcription and chromatin regulation in proliferating N2A cells.
To characterise Paupar lncRNA–protein interactions further, we used UV‐RNA‐IP to test whether Paupar interacts directly with any of these five cofactors. These data showed that Paupar, but not an U1snRNA control, is highly enriched using antibodies against KAP1 or RCOR3 compared to an IgG control (Fig 1D). A lower level of Paupar enrichment is found with CHE1, whereas ERH or PPAN does not appear to interact directly with Paupar (Fig EV1). Furthermore, the association of Paupar with either KAP1 or RCOR3 was reduced in the absence of UV treatment (Fig 1E). These results indicate that the endogenous Paupar transcript directly and specifically associates with RCOR3 and KAP1 transcriptional cofactors in neural precursor‐like cells in culture.
Figure EV1. Characterisation of Paupar lncRNA–protein interactions using UV‐RNA‐IP .
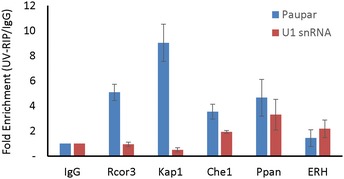
Nuclear extracts were prepared from UV cross‐linked N2A cells and immuno‐precipitated using either the indicated antibodies or a rabbit IgG control antibody. Associated RNAs were stringently washed and purified. The levels of Paupar and U1snRNA were detected in each UV‐RIP using qRT–PCR. Results are presented as fold enrichment relative to control antibody. Mean values ± SEM, N = 3.
As a first step to determine whether KAP1 or RCOR3 can act as PAX6‐associated transcriptional cofactors, we performed immunoprecipitation experiments in N2A cells using transfected FLAG‐tagged PAX6 and KAP1 or RCOR3 proteins. Immunoprecipitation of FLAG‐PAX6 using anti‐FLAG beads co‐immuno‐precipitated transfected KAP1 protein, but not RCOR3 (Fig 1F), suggesting that PAX6 and KAP1 are present within the same multicomponent regulatory complex. Consistent with this, a previous study showed that KAP1 interacts with PAX3 through the amino terminal paired domain, which is structurally similar in PAX6, to mediate PAX3‐dependent transcriptional repression (Hsieh et al, 2006). Together, these results indicate that KAP1 may regulate Paupar and PAX6‐mediated gene expression programmes.
Paupar and KAP1 control expression of a shared set of target genes that are enriched for regulators of neuronal function and cell cycle in N2A cells
KAP1 regulates the expression of genes involved in the self‐renewal and differentiation of multiple cell types, including neuronal cells (Iyengar & Farnham, 2011), and thus is an excellent candidate interactor for mediating the transcriptional regulatory function of Paupar. To investigate whether Paupar and KAP1 functionally interact to control gene expression, we first tested whether they regulate a common set of target genes. We depleted Kap1 expression in N2A cells using shRNA transfection and achieved ~90% reduction in both protein (Fig 2A) and transcript (Fig 2B) levels. Paupar levels do not change upon KAP1 knockdown, indicating that KAP1‐dependent changes in gene expression are not due to regulation of Paupar expression (Fig 2B). Transcriptome profiling using microarrays then identified 1,913 differentially expressed genes whose expression significantly changed [at a 5% false discovery rate (FDR)] greater than 1.4‐fold (log2 fold change ≈ 0.5) upon KAP1 depletion (Fig 2C and Dataset EV2). 282 of these genes were previously identified to be regulated by human KAP1 in Ntera2 undifferentiated human neural progenitor cells (Iyengar et al, 2011). Transient reduction in Kap1 expression by ~55% using a second shRNA expression vector (Kap1 shB) also induced expression changes for seven out of eight KAP1 target genes with known functions in neuronal cells that were identified in the microarray (Fig EV2). These data further validate the specificity of the KAP1 regulated gene set.
Figure 2. Paupar and KAP1 regulate shared target genes involved in neural cell proliferation and function.
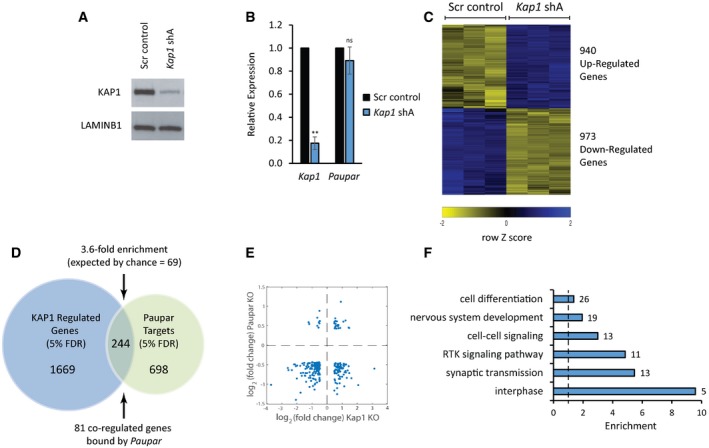
- After 7 days, Western blotting was performed to determine KAP1 protein levels. Lamin B1 was used as a loading control.
- Kap1 and Paupar transcript levels were analysed by qRT–PCR. Data were normalised using Gapdh, and expression changes are shown relative to a non‐targeting scrambled control (set at 1). Mean values ± SEM, N = 3. One‐tailed t‐test, unequal variance **P < 0.01.
- KAP1 regulated genes were identified using a GeneChip Mouse Gene 1.0 ST Array (5% FDR, log2 fold change > 0.5).
- Intersection of Kap1‐ and Paupar‐regulated genes revealed common target genes whose expression is controlled by both these factors.
- The majority (87%) of Paupar and Kap1 shared target genes are positively regulated by Paupar.
- Gene Ontology analysis of Paupar and Kap1 common target genes was performed using GOToolBox. Representative significantly enriched categories were selected from a hypergeometric test with a Benjamini–Hochberg‐corrected P‐value threshold of 0.05.
Figure EV2. Validation of the specificity of the KAP1 regulated gene set.
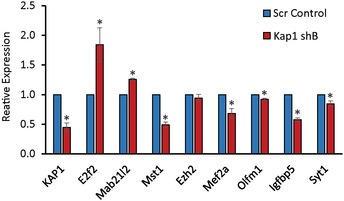
N2A cells were transfected with an additional Kap1 targeting shRNA expression vector shB‐Kap1 or a scrambled control plasmid. Three days later, cells were harvested and expression of the indicated KAP1 targets analysed using RT–qPCR. Samples were normalised using Gapdh, and the results are presented relative to the control. Results are presented as mean values ± SEM, N = 3; *P < 0.05, one‐tailed t‐test, unequal variance.
We previously showed that Paupar knockdown induces changes in the expression of 942 genes in N2A cells (Vance et al, 2014). Examination of the intersection of KAP1 and Paupar transcriptional targets identified 244 genes whose levels are affected by both Paupar and KAP1 knockdown in this cell type (Fig 2D and Dataset EV3). This represents a significant 3.6‐fold enrichment over the number expected by random sampling and is not due to co‐regulation because Kap1 is not a Paupar target (Vance et al, 2014). A large majority (87%; 212/244) of these common targets are positively regulated by Paupar and for two‐thirds of these genes (161/244) their expression changes in the same direction upon Paupar or KAP1 knockdown (Fig 2E). Furthermore, Gene Ontology enrichment analysis of these 244 genes showed that Paupar and KAP1 both regulate a shared set of target genes enriched for regulators of interphase, components of receptor tyrosine kinase signalling pathways as well as genes involved in nervous system development and essential neuronal cell functions such as synaptic transmission (Fig 2F). Genes targeted by both Paupar and KAP1 are thus expected to contribute to the control of neural stem cell self‐renewal and neural differentiation.
Paupar, KAP1 and PAX6 associate on chromatin within the regulatory region of shared target genes
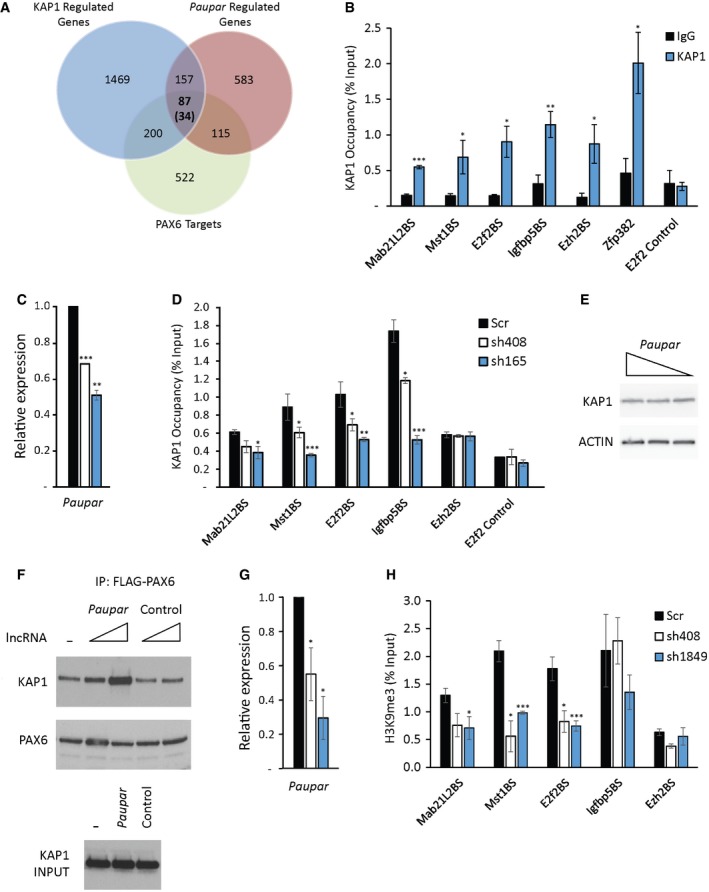
In order to investigate Paupar‐mediated mechanisms of distal gene regulation, we next sought to determine whether Paupar, KAP1 and PAX6 can form a ternary complex on chromatin within the regulatory regions of their shared target genes. To do this, we first integrated our analysis of PAX6‐regulated gene expression programmes in N2A cells (Vance et al, 2014) and identified 87 of the 244 Paupar and KAP1 common targets, which is 35.8‐fold greater than expected by random sampling, whose expression is also controlled by PAX6 (Fig 3A and Dataset EV3). We found that 34 of these genes contain a CHART‐Seq mapped Paupar binding site within their GREAT defined putative regulatory regions (Vance et al, 2014; Vance, 2016) and predicted that these represent functional Paupar binding events within close genomic proximity to direct transcriptional target genes (Fig 3A and Dataset EV3).
Figure 3. Paupar promotes KAP1 chromatin occupancy and H3K9me3 deposition at PAX6 bound sequences within the regulatory regions of common targets.
-
AIntersection of Paupar, KAP1 and PAX6 regulated genes identified 87 common target genes. 34 of these genes (in brackets) contain a Paupar binding site within their regulatory regions.
-
BChIP assays were performed in N2A cells using either an antibody against KAP1 or an isotype‐specific control.
-
CN2A cells were transfected with either a non‐targeting control or two independent Paupar targeting shRNA expression vectors. Cells were harvested for ChIP 3 days later, and Paupar depletion was confirmed using qRT–PCR.
-
DPaupar knockdown reduces KAP1 chromatin occupancy at shared binding sites. ChIP assays were performed 3 days after shRNA transfection using an anti‐KAP1 polyclonal antibody.
-
EWestern blotting showed that KAP1 proteins levels do not change upon Paupar knockdown. Actin was used as a control.
-
FPaupar promotes KAP1–PAX6 association. FLAG‐PAX6 and KAP1 expression vectors were co‐transfected into N2A cells along with increasing concentrations of Paupar or a size‐matched control lncRNA expression vector. Expression of the maximum concentration of either Paupar or control RNA in each IP does not alter KAP1 input protein levels (lower panel). Lysates were prepared 2 days after transfection and FLAG‐PAX6 protein immuno‐precipitated using anti‐FLAG beads. The amount of DNA transfected was made equal in each IP using empty vector and proteins in each complex were detected by Western blotting.
-
G, HPaupar knockdown reduces H3K9me3 at a subset of bound sequences in trans. ChIP assays were performed using an anti‐H3K9me3 polyclonal antibody 3 days after transfection of the indicated shRNA expression vectors.
ChIP‐qPCR analysis previously identified four of these Paupar bound locations within the regulatory regions of the Mab21L2, Mst1, E2f2 and Igfbp5 genes that are also bound by PAX6 in N2A cells (Vance et al, 2014). We therefore measured KAP1 chromatin occupancy at these regions as well as at a negative control sequence within the first intron of E2f2 using ChIP and identified a specific enrichment of KAP1 chromatin association at the Mab21L2, Mst1, E2f2 and Igfbp5 genes compared to an IgG isotype control (Fig 3B). KAP1 binding to these regions is only two‐ to fourfold reduced compared to the Zfp382 3′ UTR‐positive control (Fig 3B), which represents an exemplar high‐affinity KAP1 binding site (Iyengar et al, 2011). KAP1 and Paupar also co‐occupy a binding site within the Ezh2 gene. Ezh2 is regulated by Paupar and KAP1 but not by PAX6 suggesting that transcription factors in addition to PAX6 may also be involved in modulating Paupar‐KAP1 function. However, taken together these data indicate that Mab21L2, Mst1, E2f2 and Igfbp5 are co‐ordinately regulated by a ribonucleoprotein complex containing Paupar‐KAP1–PAX6.
Paupar functions as a transcriptional cofactor to promote KAP1 chromatin occupancy and H3K9me3 deposition at PAX6 bound sequences
KAP1 is recruited to its target sites within 3′ UTRs of ZNF genes through association with KRAB‐ZNF transcription factors (O'Geen et al, 2007; Iyengar et al, 2011). However, Paupar bound sequences are preferentially located at gene promoters and are not enriched for KRAB‐ZNF transcription factor binding motifs as determined using de novo motif discovery (Vance et al, 2014). This suggests that Paupar may play a role in recruiting KAP1 to a separate class of binding site in a KRAB‐ZNF‐independent manner. To test this, Paupar expression was first depleted using transient transfection of Paupar targeting shRNA expression vectors (Fig 3C). ChIP‐qPCR was then performed to measure KAP1 chromatin occupancy in control and Paupar knockdown N2A cells at the four Paupar‐KAP1–PAX6 co‐occupied binding sites within the regulatory regions of the Mab21L2, Mst1, E2f2 and Igfbp5 genes, a Paupar‐KAP1 bound sequence within the Ezh2 gene that is not regulated by PAX6, and a control sequence that is not bound by Paupar. The results show that KAP1 chromatin binding is significantly decreased at the four Paupar‐KAP1–PAX6 bound regions upon Paupar depletion and that the extent of KAP1 chromatin association appears to be dependent on Paupar transcript levels (Fig 3D). KAP1 chromatin association is also not reduced at the Ezh2 gene Paupar‐KAP1 binding site or at the control sequence that is not bound by Paupar (Fig 3D), whilst total KAP1 protein levels do not detectably change upon Paupar knockdown (Fig 3E), further confirming specificity.
These results imply that Paupar functions to promote KAP1 chromatin association at a subset of its genomic binding sites in trans and that this requires the formation of a DNA bound ternary complex containing Paupar, KAP1 and PAX6. Consistent with this, co‐expression of Paupar promotes KAP1–PAX6 association in a dose‐dependent manner in an immunoprecipitation experiment (Fig 3F). This effect is specific for the Paupar transcript because expression of a size‐matched control RNA does not alter KAP1–PAX6 association. Paupar thus functions as a transcriptional cofactor to promote the assembly of a complex containing Paupar‐KAP1–PAX6 on chromatin in trans. This ribonucleoprotein complex appears to function as a regulator of genes involved in controlling neural stem cell self‐renewal and differentiation.
We next tested whether Paupar can induce histone modification changes at bound target genes on different chromosomes away from its sites of synthesis. As KAP1 interacts with the SETDB1 methyltransferase to mediate histone H3K9me3 deposition (Schultz et al, 2002), we first determined the levels of H3K9me3 at the shared binding sites near the Mab21L2, Mst1, E2f2, Igfbp5 and Ezh2 genes using ChIP‐qPCR. This revealed an enrichment of H3K9me3‐modified chromatin at all five locations (Fig EV3), consistent with a previous study showing that many KAP1 bound promoters are marked by H3K9me3 (O'Geen et al, 2007). ChIP analysis following Paupar depletion using two different shRNAs identified a significant decrease in histone H3K9me3 at three (Mab21L2, Mst1 and E2f2) out of four shared binding sites within genes that are co‐regulated by Paupar, KAP1 and PAX6 (Fig 3G and H). No change in histone H3K9me3 was detected at the Ezh2 gene whose expression does not change upon PAX6 depletion. Together, these data show that Paupar functions to modulate KAP1 chromatin association and subsequent histone H3K9me3 deposition at a subset of its shared binding sites in trans.
Figure EV3. Paupar‐ KAP1–PAX6 bound sequences within the regulatory regions of the Mab21L2, Mst1, E2f2, Igfbp5 and Ezh2 genes are enriched in H3K9me3 modified chromatin.
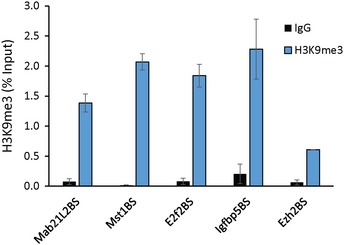
ChIP assays were performed in N2A cells using either histone H3K9me3 or anti‐rabbit IgG control antibody. DNA fragments were amplified using qPCR. % input was calculated as 100 × 2. Results are presented as mean values ± SEM, N = 4.
Surprisingly, analysis of our microarray dataset of Paupar‐mediated gene expression changes (Vance et al, 2014) showed that H3K9me3 deposition did not correlate with transcriptional repression. Mab21L2 and Mst1 were downregulated upon Paupar depletion suggesting that they are activated by the Paupar‐KAP1–PAX6 complex whilst E2f2 expression was upregulated, suggesting that it is repressed by this complex. These findings are consistent with recent work using dCas9 fusion proteins to target histone methylation to specific loci (O'Geen et al, 2017) and suggest a complex relationship between Paupar‐mediated KAP1‐dependent chromatin changes and gene expression.
Paupar co‐occupies an enriched subset of KAP1 binding sites genome‐wide
We next examined the intersection between Paupar and KAP1 bound locations genome‐wide in order to generate a more comprehensive view of the potential of Paupar for regulating KAP1 function. ChIP‐seq profiling of KAP1 chromatin occupancy showed that KAP1 associates with 5,510 genomic locations compared to input DNA in N2A cells (1% FDR; Dataset EV4). KAP1 binding sites are particularly enriched at promoter regions, over gene bodies and at the 3′ UTRs of zinc finger genes (Fig 4A), consistent with previous studies mapping human KAP1 genomic occupancy (O'Geen et al, 2007; Iyengar et al, 2011). Intersection of KAP1 bound locations with our CHART‐seq map of Paupar genomic binding in N2A cells (Vance et al, 2014) identified 46 KAP1 binding sites that are co‐occupied by Paupar and not bound in a LacZ‐negative control CHART‐seq pulldown (Fig 4B). Notably, this represents a significant (P < 0.001) fourfold enrichment of Paupar and KAP1 co‐occupied locations as estimated using Genome Association Tester (GAT; Fig 4B). Plotting the distribution of peak intensities across these co‐occupied regions revealed a precise coincidence of Paupar and KAP1 binding (Fig 4C). These data therefore show that Paupar co‐occupies a specific subset of KAP1 bound sequences genome‐wide.
Figure 4. Paupar co‐occupies a subset of KAP1 binding sites on chromatin genome‐wide.
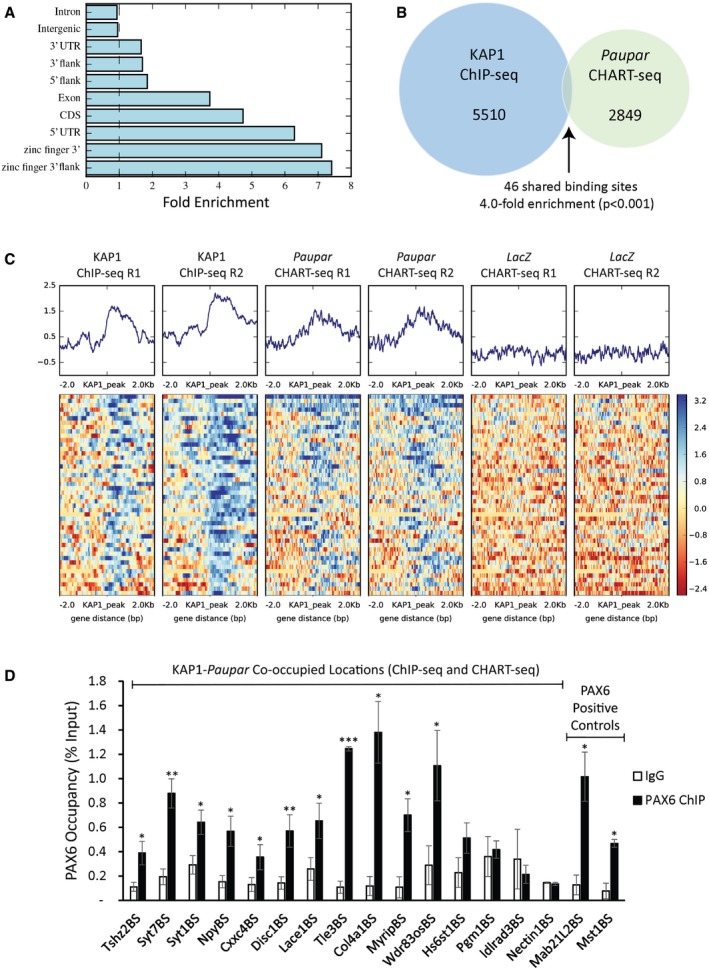
- Sites of KAP1 occupancy are particularly enriched at promoter regions (5′ UTRs), over gene bodies and over the 3′ UTR exons of zinc finger genes [q = 2 × 10⁻⁵; GAT randomisation test (Heger et al, 2013)].
- Intersection of KAP1 and Paupar binding sites in N2A cells identified 46 KAP1 bound locations that are specifically co‐occupied by Paupar. This represents a significant fourfold enrichment [P < 1 × 10⁻³; GAT randomisation test (Heger et al, 2013)].
- Sequencing read density distribution over the 46 shared binding locations was calculated and revealed a coincidence of Paupar and KAP1 binding site centrality. Colour legend indicates the base 2 logarithm of the ratio of read counts against input in bins of width 10 nt.
- ChIP in N2A cells was performed using either an antibody against PAX6 or an isotype‐specific control. Paupar‐KAP1 co‐occupied binding sites close to the indicated genes were amplified using qPCR to check for PAX6 chromatin association. % input was calculated as 100 × 2. Results are presented as mean values ± SEM, N = 3. One‐tailed t‐test, unequal variance *P < 0.05, **P < 0.01, ***P < 0.001.
We then examined the intersection between these 46 Paupar‐KAP1 co‐bound locations and the 244 Paupar‐KAP1 co‐regulated genes (Dataset EV3) and found shared binding sites within the putative regulatory regions of the Npy, Syt1, Fam92b and Plxna4 genes. However, we expect this to be an under‐representation of the total number of direct Paupar‐KAP1 co‐regulated targets given the complex cause‐and‐effect relationship between histone H3 methylation and gene expression (O'Geen et al, 2017).
Our analysis also revealed that only one of the 46 Paupar‐KAP1 co‐occupied sequences is located within the 3′ UTR of a ZNF gene (zfp68; Dataset EV4), pointing to an alternative mechanism of KAP1 genomic recruitment in addition to the well‐described KRAB‐ZNF association. To investigate this further, we performed ChIP‐qPCR to interrogate the overlap between PAX6 and Paupar‐KAP1 co‐occupied locations. PAX6 occupancy was measured at a subset of ChIP‐seq and CHART‐seq defined KAP1‐Paupar bound sequences as well as at previously identified Paupar‐KAP1–PAX6 binding sites close to the Mab21L2 and Mst1 genes as positive controls. The results identified statistically significant PAX6 enrichment at 11 out of 15 (73%) locations tested compared to an IgG control (Fig 4D). These include PAX6 binding sites within the regulatory regions of four neuronal genes (Npy, Syt1, Tshz2 and Syt7) whose expression changes when PAX6 expression is depleted in N2A cells (Vance et al, 2014). Taken together, these results indicate that PAX6 is likely to play a regulatory role at a large proportion of Paupar‐KAP1 co‐occupied sequences genome‐wide. The absence of PAX6 from some of the tested locations further suggests that Paupar‐KAP1 can associate with other transcription factors in addition to PAX6.
Paupar and Kap1 regulate olfactory bulb neurogenesis
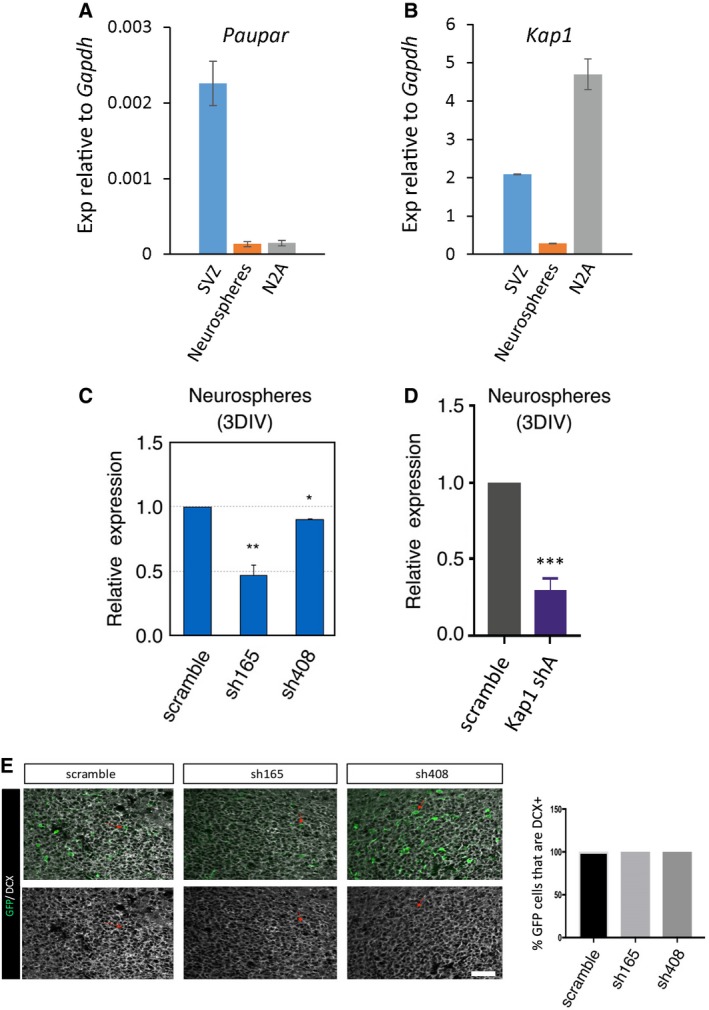
Our results indicate that Paupar and KAP1 regulate the expression of shared target genes important for proliferation and neuronal differentiation in N2A cells. We next expanded this observation and tested whether Paupar and Kap1 can regulate mouse SVZ/OB neurogenesis in vivo. In this system, neurogenesis can be monitored by electroporating neonatal SVZ neural stem cells and analysing differentiated neurons that have migrated into the OB 7 days post electroporation (dpe; Boutin et al, 2008; Chesler et al, 2008). RT–qPCR first showed that Paupar and Kap1 are expressed in the SVZ and in neurospheres cultured from postnatal day 4 (P4) SVZ (Fig EV4A and B), consistent with Kap1 expression data in the Allen Brain Atlas. Similar to N2A cells, shRNA expression vectors depleted Paupar and Kap1 transcript in P4 SVZ neurospheres (Fig EV4C and D). Nucleofection of shRNA expression vectors targeted ~60% of cells, as measured using GFP, but we determined transcript levels in all cells. Thus, on a cell‐by‐cell basis the relative level of knockdown of both Paupar and Kap1 is predicted to be greater than shown.
Figure EV4. Paupar and Kap1 SVZ analysis.
-
A, BPaupar and Kap1 transcript levels were determined using RT–qPCR in the P4 SVZ and in tertiary neurospheres prepared from the P4 SVZ.
-
C, DNeurosphere cultures were transfected with the indicated Paupar or Kap1 targeting shRNA expression vectors or a non‐targeting control. Paupar and Kap1 expression was quantified using qRT–PCR 3 days later and normalised using Gapdh. The results are presented relative to the scrambled control (set at 1).
-
EGFP and DCX co‐labelling in the OB 7 dpe. Small red arrows show examples of co‐labelled cells. Data information: Data are shown as mean ± SEM. N = 3. In (E), there are no error bars because 100% of all GFP+ cells in the OB were DCX+. Scale bar represents 30 μm. The same scale is used for all images. *P < 0.05, **P < 0.01, ***P < 0.001, one‐tailed t‐test, unequal variance.
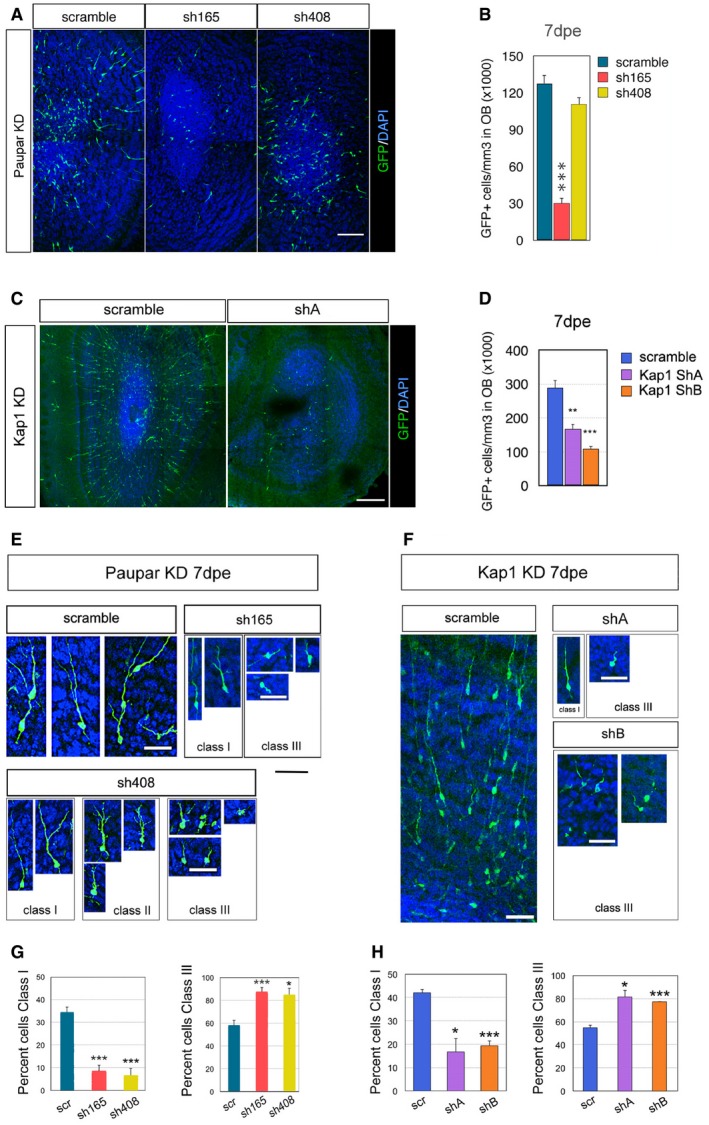
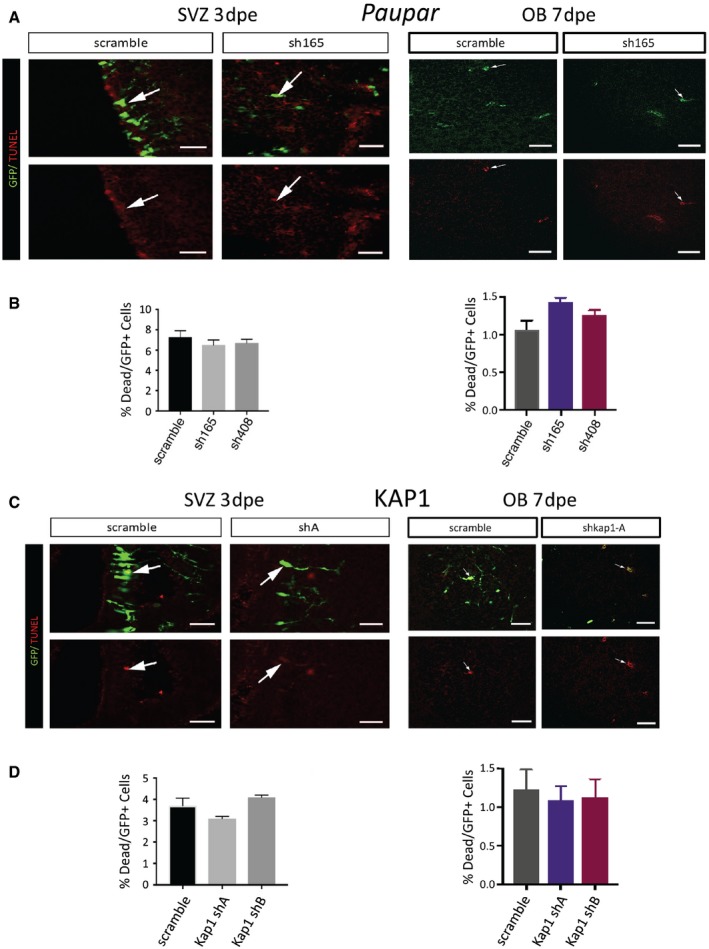
We then electroporated P1 pups with Paupar and Kap1 shRNA expression constructs or a scrambled control and examined the number and morphology of neurons that migrated into the OB 7 dpe. The results showed that there were significantly fewer GFP+ cells in the OB after Paupar knockdown (KD) using sh165 KD compared to control whilst KD with sh408 caused a slight but statistically non‐significant decrease in OB GFP+ cell numbers (Fig 5A and B). As sh165 more efficiently depletes Paupar expression compared to sh408 in N2A cells (Fig 3C) and in neurospheres (Fig EV4C), this result is suggestive of dose‐dependent effects mediated by the Paupar transcript. Co‐staining with the immature neuroblast marker DCX (Yang et al, 2004) showed that all GFP+ cells in the OB were DCX+, and this was not altered by Paupar KD (Fig EV4E). Similar to Paupar, at 7 dpe of either Kap1 shRNA expression construct, there was a significant reduction in the number of GFP+ cells that had migrated from the SVZ into the OB (Fig 5C and D). We controlled for apoptosis as this may lead to reduced cell numbers and did not detect changes in the percentage of GFP+ cells that are TUNEL+ at 3 or 7 dpe between scrambled control and any of the Paupar or Kap1 shRNA expression vectors in the SVZ, RMS or OB (Fig EV5). These results therefore suggest that both Paupar and Kap1 are required for the production of newborn OB neurons.
Figure 5. Paupar and Kap1 loss‐of‐function alters OB neuron number and morphology.
-
A, BImmunostaining and quantification of GFP+ cells that were electroporated in the SVZ and migrated to the OB, Paupar KD, 7 dpe. N ≥ 3.
-
C, DGFP+ cells that have migrated to the olfactory bulb 7 dpe decrease after Kap1 KD. Quantification of the density of electroporated cells in the OB after Kap1 KD. N = 3.
-
EHigh magnification showing different morphologies in GFP+ granule layer OB neurons 7 dpe, Paupar KD. For ease of comparison, neuronal orientations were aligned to vertical. The cells shown in the scr control group are class I.
-
FHigh magnification showing different morphologies in GFP+ granule layer OB neurons 7 dpe, Kap1 KD. Neuronal orientations rendered vertical. The scr control image shows several class I as well as class III neurons.
-
GQuantification of the percentage of cells with Class I and Class III morphology 7 days after Paupar KD. N ≥ 3.
-
HQuantification of the percentage of cells with Class I and Class III morphology 7 days after Kap1 KD. N = 3.
Figure EV5. Paupar‐ and Kap1‐mediated decrease in neuronal numbers is not due to increased cell death.
-
A–DQuantification of TUNEL+ cells after Paupar (A, B) or KAP1 (C, D) depletion to detect apoptosis in the SVZ at 3 dpe and OB at 7 dpe. Arrows show examples of co‐labelled TUNEL+ and GFP+ cells. N = 3. Data are presented as mean ± SEM and analysed by one‐way ANOVA. Scale bars represent 30 μm.
Interestingly, Paupar as well as Kap1 knockdown altered the morphology of newborn neurons in the OB (Fig 5E–H). As expected (Petreanu & Alvarez‐Buylla, 2002), in scrambled controls many GFP+ neurons in the OB granule layer had begun morphological differentiation with processes extending radially towards the pial surface, some of which were branched. These cells were classified as class I (Fig 5E and F; Boutin et al, 2010). By contrast, after Paupar KD, a variety of abnormal morphologies were observed, which we classified as class II or class III (Fig 5E). Class II cells were rare but were distinguished by many short branched processes. Class III cells exhibited only short or no processes, suggesting they were still migrating or had not substantially differentiated (Fig 5E). Quantification revealed that after electroporation the percentage of cells with Class I morphology was 34 ± 2% in scrambled controls but only 8 ± 3% after Paupar KD with sh165 and 6 ± 3% in the sh408 group (P = 0.0005 and P = 0.0009, respectively; Fig 5G). Conversely, after Paupar KD there were significantly more class III neurons in the sh165 group (87 ± 4%) as well as in the sh408 group (85 ± 6%) compared to controls (58 ± 5%; P = 0.003 and P = 0.02, respectively). Kap1 KD showed similar effects (Fig 5F and H); shA and shB resulted in 16.7 ± 5.6 and 19.3 ± 2.0% of Class I neurons versus 42.0 ± 1.5% in controls (P = 0.012 and P = 0.013, respectively). Again, the number of Class III neurons increased from 54.7 ± 2.2% in controls to 81.3 ± 5.6% after shA KD and 77.3 ± 0.3% after shB KD (P = 0.0009 and P = 0.0005, respectively). These data further suggest that Kap1 and Paupar affect postnatal neurogenesis by disrupting both migration into the OB and morphological differentiation of newborn neurons.
Discussion
LncRNAs can bind and regulate target genes on multiple chromosomes away from their sites of transcription. The number of lncRNAs that function in this way is steadily increasing suggesting that nuclear lncRNAs could exert a wide range of currently uncharacterised, trans‐acting functions in transcription and chromatin regulation. Moreover, loss‐of‐function studies using animal model systems are needed to identify and characterise lncRNA regulatory roles during embryonic development and in adult tissue homeostasis to clarify the importance of this class of transcript in vivo.
To gain novel insights into lncRNA gene regulation, we investigated the mode of action of the CNS‐expressed lncRNA Paupar at chromosomal binding sites away from its site of synthesis in N2A cells. We show that Paupar directly binds the KAP1 epigenetic regulatory protein and thereby regulates the expression of shared target genes important for proliferation and neuronal differentiation. Our data indicate that Paupar modulates histone H3K9me deposition at a subset of distal bound transcriptional regulatory elements through its association with KAP1, including at a binding site upstream of the E2f2 gene. These chromatin changes are consistent with our previous report that this E2f2 bound sequence functions as a transcriptional enhancer whose activity is restricted by Paupar transcript levels (Vance et al, 2014). Our results therefore suggest a model in which Paupar‐directed histone modification changes in trans alter the activity of bound regulatory elements in a dose‐dependent manner.
Several other lncRNAs have also been shown to alter the chromatin structure of target genes in trans. These include the human PAUPAR orthologue which can inhibit H3K4 trimethylation of the Hes1 promoter in eye cancer cell lines, as well as lncRNA‐HIT which induces p100/CBP‐mediated changes in histone H3K27ac at bound sequences to regulate genes involved in chondrogenesis (Carlson et al, 2015; Ding et al, 2016). The lncRNA Hotair is one of the most studied trans‐acting lncRNAs. Whilst Hotair has been proposed to guide PRC2 to specific locations in the genome to induce H3K27me3 and silence gene expression (Chu et al, 2011), recent conflicting studies report that PRC2 associates with low specificity to lncRNAs and suggest that HOTAIR does not directly recruit PRC2 to the genome to silence gene transcription (Kaneko et al, 2013; Davidovich et al, 2015; Portoso et al, 2017). Mechanistic studies on individual trans‐acting lncRNAs such as Paupar are therefore needed to further define general principles of genome‐wide lncRNA transcription and chromatin regulation.
It is proposed that lncRNAs may guide chromatin‐modifying complexes to distal regions in the genome through RNA–RNA associations at transcribed loci, or either directly through RNA–DNA base pairing or indirectly through RNA–protein–DNA associations (Vance & Ponting, 2014; Rutenberg‐Schoenberg et al, 2016). We show here that Paupar acts to increase KAP1 chromatin association by promoting the formation of a DNA binding regulatory complex containing Paupar, KAP1 and PAX6 within the regulatory regions of shared target genes in trans, as illustrated in the model in Fig 6. This suggests that Paupar functions as a cofactor for transcription factors such as PAX6 to modulate target gene expression across multiple chromosomes. In a similar manner, Prncr1 and Pcgem1 lncRNAs interact with the androgen receptor (AR) and associate with non‐DNA binding cofactors to facilitate AR‐mediated gene regulation (Yang et al, 2013). LncRNA‐mediated recruitment of chromatin regulatory proteins to DNA bound transcription factors may represent a common mechanism of trans‐acting lncRNA gene regulation, in line with their suggested role as molecular scaffolds (Tsai et al, 2010).
Figure 6. Schematic detailing possible Paupar mode of action at distal bound regulatory regions.
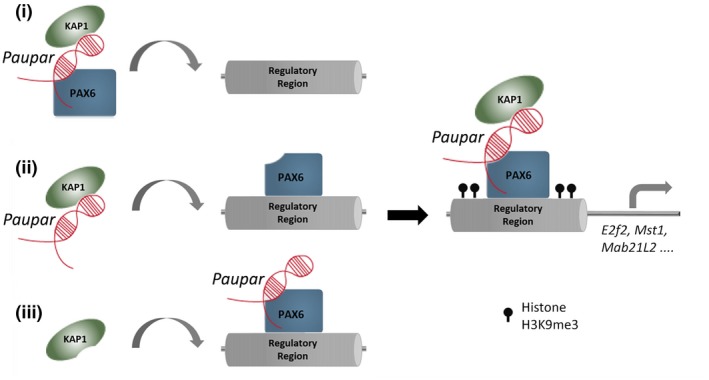
Paupar promotes KAP1 chromatin association and H3K9me3 deposition through the assembly of a DNA bound ribonucleoprotein complex containing Paupar, KAP1 and PAX6 within the regulatory regions of direct target genes such as Mab21L2, Mst1 and E2f2. We propose three potential (non‐mutually exclusive) scenarios to describe the order of assembly of this complex: (i) A ternary complex forms in the nucleoplasm before binding DNA; (ii) Paupar interacts with KAP1 and guides it to DNA bound PAX6; or (iii) KAP1 is recruited to a DNA bound PAX6‐Paupar complex. This leads to local H3K9me3 modification changes at these bound sequences in trans. The model was generated taking into consideration the discovery that Paupar genome‐wide binding sites contain an enrichment of motifs for neural transcription factors but are not enriched for sequences that are complementary to Paupar itself (Vance et al, 2014). This suggests that Paupar does not bind DNA directly but is targeted to chromatin indirectly through RNA–protein interactions with transcription factors such as PAX6. Moreover, KAP1 is a non‐DNA binding chromatin regulator that is also targeted to the genome through interactions with transcription factors.
KAP1 is guided to the 3′ UTR of zinc finger genes in the genome through association with KRAB‐ZNF transcription factors (O'Geen et al, 2007). However, the mechanisms of KAP1 genome‐wide recruitment are not fully understood (Iyengar et al, 2011). Our data identify KAP1 as a novel RNA binding protein and show that Paupar plays a role in modulating the recruitment of KAP1 to specific PAX6 bound locations in the genome. We further assessed the extent to which Paupar may be able to modulate KAP1 genome‐wide recruitment and identified 46 shared binding sites on chromatin, only one of which was within a 3′ UTR of a zinc finger gene. We measured PAX6 occupancy at a subset of these locations and identified significant PAX6 enrichment at 11 out of 15 Paupar‐KAP1 co‐occupied regions. These results raise the possibility that additional chromatin‐enriched lncRNAs may operate to recruit KAP1 to specific locations in the genome and that this may involve context‐specific interactions with both KRAB‐ZNF and non‐KRAB‐ZNF containing transcription factors such as PAX6.
Our knockdown studies indicate that Paupar and Kap1 are required for normal postnatal OB neurogenesis in vivo. At 7 dpe of the SVZ most cells would be migrating from the RMS into the OB with only a minority differentiating and our quantification supported this. In accordance with the KAP1‐Paupar physical association, both Paupar and Kap1 loss‐of‐function reduced the number of newborn neurons in the OB. Although the decrease in neuronal numbers could have been due to increased apoptosis caused by Paupar or KAP1 knockdown, we found no evidence of altered cell death in the SVZ, RMS or OB with TUNEL staining. Another possibility is that Paupar and KAP1 knockdown attenuated migration through the RMS. Reduced migration is sufficient to decrease rates of OB neurogenesis (Comte et al, 2011) and could explain the reduced number of cells in the OB 7 dpe. There is precedence for such an effect as reduction in either lncRNA ncRNA‐7a or HNF1A‐AS1 decreased cell migration (Orom et al, 2010; Yang et al, 2014a), and reduced migration into the OB could also cause a delay in differentiation. Consistent with this, fewer newborn neuroblasts had differentiated morphology and more had immature morphology after Paupar or KAP1 depletion. Additionally, it may be that Paupar and KAP1 affect the rate of OB interneuron differentiation in a manner similar to NeuroD1 (Boutin et al, 2010; Pataskar et al, 2016).
This study identifies Paupar and Kap1 as novel regulators of OB neurogenesis in vivo and provides important conceptual insights into the distal modes of lncRNA‐mediated gene regulation. Given the widespread role played by Kap1 in genome regulation and chromatin organisation, we anticipate that further chromatin‐associated lncRNAs will be found to functionally interact with KAP1.
Materials and Methods
Plasmid construction
Kap1 and Paupar targeting short hairpin RNAs (shRNAs), designed using the Whitehead Institute siRNA selection programme, were synthesised as double‐stranded DNA oligonucleotides and ligated into pBS‐U6‐CMVeGFP as shown previously (Vance et al, 2014). The Paupar targeting sh165 and sh408 expression constructs, the non‐targeting scrambled control shRNA and pCAGGS‐Paupar expression vector, are also detailed in (Vance et al, 2014). To generate the PAX6 expression vector, Pax6 coding sequence was PCR amplified from mouse N2A cell cDNA as a NotI‐XhoI fragment and inserted into pcDNA3.1(+) (Invitrogen). The forward primer incorporated a DNA sequence to insert the DYKDDDDK FLAG epitope tag in frame at the amino terminal end of PAX6. Rcor3 coding sequence was also PCR amplified from mouse N2A cell cDNA and cloned into pcDNA3.1(+) to generate pcDNA3‐RCOR3. pcDNA3‐HA‐KAP1 was a kind gift from Colin Goding (Ludwig Institute, Oxford). The sequences of the oligonucleotides used in this study are listed in Table EV1.
Cell culture
N2A mouse neuroblastoma cells (ATCC CCL‐131) were grown in DMEM supplemented with 10% foetal bovine serum. All transfections were performed using FuGENE 6 (Promega) following the manufacturer's instructions. To generate Kap1 knockdown cells, ~2 × 10⁵ cells were plated per well in a six‐well plate. 16–24 h later, cells were transfected with 1.5 μg Kap1 shRNA expression construct and 300 ng (5:1 ratio) pTK‐Hyg (Clontech). Three days after transfection, cells were trypsinised, resuspended in growth medium containing 200 μg/ml Hygromycin B and plated onto a 6‐cm dish. Drug‐resistant cells were grown for 7 days and harvested as a pool.
Immunoprecipitation
1 × 10⁶ N2A cells were seeded per 10‐cm dish. The next day, cells were transfected with different combinations of pcDNA3‐FLAG‐PAX6, pcDNA3‐HA‐KAP1, pcDNA3‐RCOR3, pCAGGS‐Paupar, pCAGGS‐AK034351 control transcript or pcDNA3.1 empty vector. 6 μg plasmid DNA was transfected in total. Two days later, cells were washed twice with ice‐cold PBS, transferred to 1.5‐ml microcentrifuge tubes and lysed in 1 ml ice‐cold IP Buffer (IPB; 50 mM Hepes pH 7.5, 350 mM NaCl, 1 mM MgCl2, 0.5 mM EDTA and 0.4% IGEPAL CA‐630) for 30 min, 4°C with rotation. Lysates were pelleted at 16,000 g, 20 min, 4°C in a microfuge, supernatant was added to 30 μl anti‐FLAG M2 Magnetic Beads (#M8823, Sigma) and incubated overnight at 4°C with rotation. Beads were washed three times with IPB and eluted in 20 μl Laemmli sample buffer for 5 min at 95°C. Bound proteins were detected by Western blotting using anti‐FLAG M2 (F3165, Sigma), anti‐KAP1 (ab10483, Abcam), anti‐RCOR3 (A301‐273A, Bethyl Laboratories) and Protein A HRP (ab7456, Abcam).
RNA pulldown assay
Sense RNA was in vitro‐transcribed from pCR4‐TOPO‐Paupar using T7 RNA polymerase, according to manufacturer's instructions (New England Biolabs). Transcribed RNA was concentrated and purified using the RNeasy MinElute Cleanup kit (Qiagen). Purified RNA was then 5′ end labelled with biotin‐maleimide using a 5′ EndTag nucleic acid labelling system (Vector Laboratories). Streptavidin‐coated Dynabeads M‐280 (Invitrogen) were washed, prepared for RNA manipulation and the 5′ biotinylated RNA bound according to manufacturer's instructions. N2A cell nuclear extract was diluted in affinity binding/washing buffer (150 mM NaCl, 50 mM HEPES, pH 8.0, 0.5% Igepal, 10 mM MgCl2) in the presence of 100 μg/ml tRNA, 40 U/ml RNaseOUT (Invitrogen) and a protease inhibitor cocktail (Roche). RNA‐coated beads were incubated with nuclear extract at room temperature for 2 h with rotation. The supernatant was then removed, the beads washed six times (10 min) with affinity/binding washing buffer, and bound protein eluted by heating to 95°C in the presence of Laemmli sample buffer for 5 min. Samples were loaded onto a 10% Tris‐glycine polyacrylamide gel (Bio‐Rad) and subjected to denaturing SDS–PAGE until they just entered the resolving gel. Protein samples were then excised, diced and washed three times with nanopure water. Tryptic digest and mass spectrometry were performed by the Central Proteomics Facility (Dunn School of Pathology, University of Oxford).
RNA‐IP
Approximately 1 × 10⁷ N2A cells were used per RNA‐IP. Native RNA‐IP experiments were performed using the Magna RIP Kit (Millipore) according to the manufacturer's instructions. UV‐RIP was carried out as described in Vance et al (2014). We used the following rabbit polyclonal antibodies: anti‐RCOR3 (A301‐273A, Bethyl Laboratories), anti‐CoREST (07‐455, Millipore), anti‐KAP1 (ab10483, Abcam), anti‐ERH (ab96130, Abcam), anti‐PPAN (11006‐1‐AP, Proteintech Group) and rabbit IgG (PP64B, Millipore).
Chromatin immunoprecipitation
For knockdown experiments, 4 × 10⁶ N2A cells per ChIP were seeded in 15‐cm plates. The next day, cells were transfected with either 15 μg Paupar targeting shRNA expression vectors or a non‐targeting scr control. Three days later, cells were harvested for ChIP using either 5 μg anti‐KAP1 (ab10483, Abcam), anti‐histone H3K9me3 (39161, Active Motif) or normal rabbit control IgG (#2729, Cell Signalling Technology) antibodies. ChIP was performed as described in Vance et al (2014). 5 μg anti‐PAX6 (#AB2237, Millipore) was used for PAX6 ChIP. For KAP1 ChIP‐seq, the following modifications were made to the protocol: ~2 × 10⁷ N2A cells per ChIP were double‐cross‐linked, first using 2 mM disuccinimidyl glutarate (DSG) for 45 min at room temperature, followed by 1% formaldehyde for 15 min at room temperature, as described in Nowak et al (2005). Chromatin was sheared to ~200 bp using a Bioruptor Pico (Diagenode) and ChIP DNA and matched input DNA from two independent KAP1 ChIP experiments were sequenced on an Illumina HiSeq 4000 (150‐bp paired‐end sequencing).
ChIP‐seq analysis
The Babraham Bioinformatics fastqscreen (https://www.bioinformatics.babraham.ac.uk/projects/fastq_screen/) and fastQC (https://www.bioinformatics.babraham.ac.uk/projects/fastqc/) tools were used to screen the raw reads for containments and to assess quality. We removed traces of the adapter sequence from the raw reads using the Trimmomatic tool (Bolger et al, 2014). Trimmomatic was also used to trim by quality with the options: LEADING:3 TRAILING:3 SLIDINGWINDOW:4:15 MINLEN:50. The trimmed reads were aligned to the mm10 reference genome, using the Burrows‐Wheeler Aligner (Li & Durbin, 2010) with the command: > bwa mem mm10 <pair_1.fq> <pair_2.fq>. Alignment quality was assessed with the Qualimap 2.2.1 tool (Okonechnikov et al, 2016). The aligned reads were filtered to exclude reads with a MAPQ alignment quality < 20. Furthermore, we excluded reads aligning to blacklisted regions identified by the ENCODE consortium (ENCODE Project Consortium, 2012). MACS2 version 2.1.1.20160309 was used to identify genomic regions bound by KAP1. We further filtered the aligned reads to retain only those with length 150 and called peaks relative to the input controls using the options “–gsize = 1.87e9 –qvalue = 0.01 ‐B –keep‐dup auto”. To examine the read density distribution in the vicinity of KAP1 peaks, we used deepTools (Ramirez et al, 2016). Read density was calculated with respect to input using the bamCompare tool from deepTools, with the option “–binSize 10”. The matrix of read densities in the vicinity of KAP1 peaks was calculated using “computeMatrix reference‐point”, and heatmaps plotted with “plotHeatmap”. The Genomic Association Test tool GAT (Heger et al, 2013) was used to characterise KAP1 binding sites and the relationship between KAP1 and Paupar. Coordinates with respect to the mm10 reference genome for characteristic genomic regions (exons, introns, 3′ UTRs, etc.) were downloaded from the UCSC Genome Table Browser (https://genome.ucsc.edu/cgi-bin/hgTables). The enrichment of KAP1 peaks and the intersection of KAP1 and Paupar peaks with respect to these genomic regions was assessed using GAT with the options “–ignore‐segment‐track –num‐samples = 100,000” and using the complement of the blacklist regions as the workspace. To test for significance coincidence of KAP1 and Paupar peaks, we use GAT with the same options. The Paupar CHART‐Seq peakset from Vance et al (2014) was used for comparison.
Transcriptomic analysis
Total RNA was isolated from triplicate control and KAP1 knockdown cells using the Qiagen Mini RNeasy kit following the manufacturer's instructions. RNA samples with a RNA Integrity Number greater than 8, as assessed on a BioAnalyzer (Agilent Technologies), were hybridised to Mouse Gene 1.0 ST Arrays as detailed in (Chalei et al, 2014). Microarray data were Robust Multi‐array Average (RMA) normalised using GeneSpring GX12.6 (Agilent). Differentially expressed genes (fold change difference ≥ 1.4) were identified using a false discovery rate of ≤ 0.05 with a Benjamini and Hochberg multiple testing correction (Limma). Gene Ontology analysis was performed as previously (Vance et al, 2014).
Neurosphere assay
Neurospheres were cultured according to standard protocols as previously described (Dizon et al, 2006). In brief, age P3‐P6 CD1 mice pups were anesthetised by hypothermia and decapitated, and the brains were immediately dissected out and sectioned in the coronal plane with a McIlwain tissue chopper. The SVZ was then dissected out in ice‐cold HBSS in a sterile laminar flow hood. Accutase was used for 15 min for cell dissociation. Cells were cultured in defined Neurobasal media supplemented with 20 ng/ml EGF (Sigma) and 20 ng/ml bFGF (R&D). Cells were seeded at a density of 100 cells/μl and passaged every 3–4 days.
Neural stem cell nucleofection
3–4 × 10⁶ dissociated neurosphere cells were nucleofected according to the protocol of LONZA (VPG‐1004). Cells were mixed with 100 μl nucleofection solution (82 μl of Nucleofector Solution + 18 μl of supplement) and 5–10 μg DNA and transferred into cuvettes. 500 μl of culture medium was added into the cuvette, and the sample was then transferred into 1 ml medium and centrifuged at 250 g for 5 min. Cells were resuspended with fresh medium and plated at 200,000 cells/2 ml in a PolyHeme‐coated 6‐well plate.
Postnatal electroporation
Electroporation was performed as published (Boutin et al, 2008; Chesler et al, 2008). DNA plasmids were prepared with Endofree Maxi kit (Qiagen) and mixed with 0.1% fast green for tracing. DNA concentrations were matched in every individual experiment. P1 CD1 pups were anesthetised with hypothermia, and 1–2 μl of plasmids was injected with glass capillary. Electrical pulses (100 V, 50 ms ON with 850‐ms intervals for five cycles) were given with tweezer electrodes (CUY650P5). Pups were recovered, then returned to dam and analysed at the indicated time.
Immunohistochemistry and imaging
Immunohistochemistry was as previously described (Young et al, 2014) using Chicken anti‐GFP (1:500, Aves) and goat anti‐DCX (1:100, Santa Cruz) primary and Alexafluor‐conjugated (Invitrogen) secondary antibodies. TUNEL method was performed using the In situ cell death detection kit, TMR red (Roche‐12156792910) to detect apoptosis. Sections were imaged with Zeiss 710 Laser Scanning Microscopy. For co‐localisation in GFP+ cells, a 20× or 40× oil immersion objective was used and Z stacks were generated at 2‐μm intervals. Confocal images were analysed with ImageJ.
Morphological evaluation
All GFP+ neuroblasts in the granule layer of the OB were binned into Class I, II or III groups similar to a previous study (Boutin et al, 2010). Only cells with obvious cell bodies and that were entirely found in the field were included. Cells in the rostral migratory stream in the core of the OB, and in OB layers outside of the granule layer, were not included. N = 3–5 mice per group.
Ethics
All mouse experiments were performed in accordance with institutional and national guidelines and regulations under UK Home Office Project Licence PPL 3003311.
Data availability
The ChIP‐Seq and microarray data have been deposited in the GEO database https://www.ncbi.nlm.nih.gov/geo/) under the following accession numbers: GSE110032 and GSE110033.
Author contributions
KWV conceived the study. IP, FA, BS, TS, SL, FGS and KWV designed and performed the experiments. IP, FGS and KWV analysed and interpreted the data. NC, SL and DJW carried out computational analysis of the microarray and ChIP‐seq data. KWV and FGS wrote the manuscript with input from IP and CPP who reviewed and edited the drafts. CPP, FGS and KWV supervised the research and acquired funding.
Conflict of interest
The authors declare that they have no conflict of interest.
Supporting information
Expanded View Figures PDF
Table EV1
Dataset EV1
Dataset EV2
Dataset EV3
Dataset EV4
Review Process File
Source Data for Figure 1
Source Data for Figure 3
Acknowledgements
This project has been funded by a Biotechnology and Biological Sciences Research Council grant to KWV (BB/N005856/1; KWV, IP), a Medical Research Council (MR/M010554/1; FGS, BS, FA) grant to FGS, and European Research Council (Project Reference 249869, DARCGENs), Medical Research Council (MC_UU_12008/1; CPP, NC) and Wellcome Trust (106956/Z/15/Z; CPP, TS) grants to CPP.
The EMBO Journal (2018) 37: e98219 29661885
References
- Bardella C, Al‐Dalahmah O, Krell D, Brazauskas P, Al‐Qahtani K, Tomkova M, Adam J, Serres S, Lockstone H, Freeman‐Mills L, Pfeffer I, Sibson N, Goldin R, Schuster‐Boeckler B, Pollard PJ, Soga T, McCullagh JS, Schofield CJ, Mulholland P, Ansorge O et al (2016) Expression of Idh1R132H in the murine subventricular zone stem cell niche recapitulates features of early gliomagenesis. Cancer Cell 30: 578–594 [DOI] [PMC free article] [PubMed] [Google Scholar]
- Bolger AM, Lohse M, Usadel B (2014) Trimmomatic: a flexible trimmer for Illumina sequence data. Bioinformatics 30: 2114–2120 [DOI] [PMC free article] [PubMed] [Google Scholar]
- Boutin C, Diestel S, Desoeuvre A, Tiveron MC, Cremer H (2008) Efficient in vivo electroporation of the postnatal rodent forebrain. PLoS One 3: e1883 [DOI] [PMC free article] [PubMed] [Google Scholar]
- Boutin C, Hardt O, de Chevigny A, Core N, Goebbels S, Seidenfaden R, Bosio A, Cremer H (2010) NeuroD1 induces terminal neuronal differentiation in olfactory neurogenesis. Proc Natl Acad Sci USA 107: 1201–1206 [DOI] [PMC free article] [PubMed] [Google Scholar]
- Cammas F, Mark M, Dolle P, Dierich A, Chambon P, Losson R (2000) Mice lacking the transcriptional corepressor TIF1beta are defective in early postimplantation development. Development 127: 2955–2963 [DOI] [PubMed] [Google Scholar]
- Carlson HL, Quinn JJ, Yang YW, Thornburg CK, Chang HY, Stadler HS (2015) LncRNA‐HIT functions as an epigenetic regulator of chondrogenesis through its recruitment of p100/CBP complexes. PLoS Genet 11: e1005680 [DOI] [PMC free article] [PubMed] [Google Scholar]
- Chalei V, Sansom SN, Kong L, Lee S, Montiel JF, Vance KW, Ponting CP (2014) The long non‐coding RNA Dali is an epigenetic regulator of neural differentiation. eLife 3: e04530 [DOI] [PMC free article] [PubMed] [Google Scholar]
- Chang EH, Adorjan I, Mundim MV, Sun B, Dizon ML, Szele FG (2016) Traumatic brain injury activation of the adult subventricular zone neurogenic niche. Front Neurosci 10: 332 [DOI] [PMC free article] [PubMed] [Google Scholar]
- Chesler AT, Le Pichon CE, Brann JH, Araneda RC, Zou DJ, Firestein S (2008) Selective gene expression by postnatal electroporation during olfactory interneuron neurogenesis. PLoS One 3: e1517 [DOI] [PMC free article] [PubMed] [Google Scholar]
- Chu C, Qu K, Zhong FL, Artandi SE, Chang HY (2011) Genomic maps of long noncoding RNA occupancy reveal principles of RNA‐chromatin interactions. Mol Cell 44: 667–678 [DOI] [PMC free article] [PubMed] [Google Scholar]
- Comte I, Kim Y, Young CC, van der Harg JM, Hockberger P, Bolam PJ, Poirier F, Szele FG (2011) Galectin‐3 maintains cell motility from the subventricular zone to the olfactory bulb. J Cell Sci 124: 2438–2447 [DOI] [PMC free article] [PubMed] [Google Scholar]
- Davidovich C, Wang X, Cifuentes‐Rojas C, Goodrich KJ, Gooding AR, Lee JT, Cech TR (2015) Toward a consensus on the binding specificity and promiscuity of PRC2 for RNA. Mol Cell 57: 552–558 [DOI] [PMC free article] [PubMed] [Google Scholar]
- Ding X, Wang X, Lin M, Xing Y, Ge S, Jia R, Zhang H, Fan X, Li J (2016) PAUPAR lncRNA suppresses tumourigenesis by H3K4 demethylation in uveal melanoma. FEBS Lett 590: 1729–1738 [DOI] [PubMed] [Google Scholar]
- Dizon ML, Shin L, Sundholm‐Peters NL, Kang E, Szele FG (2006) Subventricular zone cells remain stable in vitro after brain injury. Neuroscience 142: 717–725 [DOI] [PubMed] [Google Scholar]
- Doetsch F, Caille I, Lim DA, Garcia‐Verdugo JM, Alvarez‐Buylla A (1999) Subventricular zone astrocytes are neural stem cells in the adult mammalian brain. Cell 97: 703–716 [DOI] [PubMed] [Google Scholar]
- ENCODE Project Consortium (2012) An integrated encyclopedia of DNA elements in the human genome. Nature 489: 57–74 [DOI] [PMC free article] [PubMed] [Google Scholar]
- Engreitz JM, Haines JE, Perez EM, Munson G, Chen J, Kane M, McDonel PE, Guttman M, Lander ES (2016) Local regulation of gene expression by lncRNA promoters, transcription and splicing. Nature 539: 452–455 [DOI] [PMC free article] [PubMed] [Google Scholar]
- Gheusi G, Cremer H, McLean H, Chazal G, Vincent JD, Lledo PM (2000) Importance of newly generated neurons in the adult olfactory bulb for odor discrimination. Proc Natl Acad Sci USA 97: 1823–1828 [DOI] [PMC free article] [PubMed] [Google Scholar]
- Heger A, Webber C, Goodson M, Ponting CP, Lunter G (2013) GAT: a simulation framework for testing the association of genomic intervals. Bioinformatics 29: 2046–2048 [DOI] [PMC free article] [PubMed] [Google Scholar]
- Herzog M, Wendling O, Guillou F, Chambon P, Mark M, Losson R, Cammas F (2011) TIF1beta association with HP1 is essential for post‐gastrulation development, but not for Sertoli cell functions during spermatogenesis. Dev Biol 350: 548–558 [DOI] [PubMed] [Google Scholar]
- Hsieh MJ, Yao YL, Lai IL, Yang WM (2006) Transcriptional repression activity of PAX3 is modulated by competition between corepressor KAP1 and heterochromatin protein 1. Biochem Biophys Res Comm 349: 573–581 [DOI] [PubMed] [Google Scholar]
- Ilik IA, Quinn JJ, Georgiev P, Tavares‐Cadete F, Maticzka D, Toscano S, Wan Y, Spitale RC, Luscombe N, Backofen R, Chang HY, Akhtar A (2013) Tandem stem‐loops in roX RNAs act together to mediate X chromosome dosage compensation in Drosophila . Mol Cell 51: 156–173 [DOI] [PMC free article] [PubMed] [Google Scholar]
- Iyengar S, Farnham PJ (2011) KAP1 protein: an enigmatic master regulator of the genome. J Biol Chem 286: 26267–26276 [DOI] [PMC free article] [PubMed] [Google Scholar]
- Iyengar S, Ivanov AV, Jin VX, Rauscher FJ III, Farnham PJ (2011) Functional analysis of KAP1 genomic recruitment. Mol Cell Biol 31: 1833–1847 [DOI] [PMC free article] [PubMed] [Google Scholar]
- Kaneko S, Son J, Shen SS, Reinberg D, Bonasio R (2013) PRC2 binds active promoters and contacts nascent RNAs in embryonic stem cells. Nat Struct Mol Biol 20: 1258–1264 [DOI] [PMC free article] [PubMed] [Google Scholar]
- Li H, Durbin R (2010) Fast and accurate long‐read alignment with Burrows‐Wheeler transform. Bioinformatics 26: 589–595 [DOI] [PMC free article] [PubMed] [Google Scholar]
- Lledo PM, Saghatelyan A (2005) Integrating new neurons into the adult olfactory bulb: joining the network, life‐death decisions, and the effects of sensory experience. Trends Neurosci 28: 248–254 [DOI] [PubMed] [Google Scholar]
- Maenner S, Muller M, Frohlich J, Langer D, Becker PB (2013) ATP‐dependent roX RNA remodeling by the helicase maleless enables specific association of MSL proteins. Mol Cell 51: 174–184 [DOI] [PubMed] [Google Scholar]
- Mercer TR, Dinger ME, Sunkin SM, Mehler MF, Mattick JS (2008) Specific expression of long noncoding RNAs in the mouse brain. Proc Natl Acad Sci USA 105: 716–721 [DOI] [PMC free article] [PubMed] [Google Scholar]
- Mercer TR, Qureshi IA, Gokhan S, Dinger ME, Li G, Mattick JS, Mehler MF (2010) Long noncoding RNAs in neuronal‐glial fate specification and oligodendrocyte lineage maturation. BMC Neurosci 11: 14 [DOI] [PMC free article] [PubMed] [Google Scholar]
- Nowak DE, Tian B, Brasier AR (2005) Two‐step cross‐linking method for identification of NF‐kappaB gene network by chromatin immunoprecipitation. Biotechniques 39: 715–725 [DOI] [PubMed] [Google Scholar]
- O'Geen H, Squazzo SL, Iyengar S, Blahnik K, Rinn JL, Chang HY, Green R, Farnham PJ (2007) Genome‐wide analysis of KAP1 binding suggests autoregulation of KRAB‐ZNFs. PLoS Genet 3: e89 [DOI] [PMC free article] [PubMed] [Google Scholar]
- O'Geen H, Ren C, Nicolet CM, Perez AA, Halmai J, Le VM, Mackay JP, Farnham PJ, Segal DJ (2017) dCas9‐based epigenome editing suggests acquisition of histone methylation is not sufficient for target gene repression. Nucleic Acids Res 45: 9901–9916 [DOI] [PMC free article] [PubMed] [Google Scholar]
- Okonechnikov K, Conesa A, Garcia‐Alcalde F (2016) Qualimap 2: advanced multi‐sample quality control for high‐throughput sequencing data. Bioinformatics 32: 292–294 [DOI] [PMC free article] [PubMed] [Google Scholar]
- Orom UA, Derrien T, Beringer M, Gumireddy K, Gardini A, Bussotti G, Lai F, Zytnicki M, Notredame C, Huang Q, Guigo R, Shiekhattar R (2010) Long noncoding RNAs with enhancer‐like function in human cells. Cell 143: 46–58 [DOI] [PMC free article] [PubMed] [Google Scholar]
- Pataskar A, Jung J, Smialowski P, Noack F, Calegari F, Straub T, Tiwari VK (2016) NeuroD1 reprograms chromatin and transcription factor landscapes to induce the neuronal program. EMBO J 35: 24–45 [DOI] [PMC free article] [PubMed] [Google Scholar]
- Petreanu L, Alvarez‐Buylla A (2002) Maturation and death of adult‐born olfactory bulb granule neurons: role of olfaction. J Neurosci 22: 6106–6113 [DOI] [PMC free article] [PubMed] [Google Scholar]
- Ponjavic J, Oliver PL, Lunter G, Ponting CP (2009) Genomic and transcriptional co‐localization of protein‐coding and long non‐coding RNA pairs in the developing brain. PLoS Genet 5: e1000617 [DOI] [PMC free article] [PubMed] [Google Scholar]
- Portoso M, Ragazzini R, Brencic Z, Moiani A, Michaud A, Vassilev I, Wassef M, Servant N, Sargueil B, Margueron R (2017) PRC2 is dispensable for HOTAIR‐mediated transcriptional repression. EMBO J 36: 981–994 [DOI] [PMC free article] [PubMed] [Google Scholar]
- Pradeepa MM, McKenna F, Taylor GC, Bengani H, Grimes GR, Wood AJ, Bhatia S, Bickmore WA (2017) Psip1/p52 regulates posterior Hoxa genes through activation of lncRNA Hottip. PLoS Genet 13: e1006677 [DOI] [PMC free article] [PubMed] [Google Scholar]
- Ramirez F, Ryan DP, Gruning B, Bhardwaj V, Kilpert F, Richter AS, Heyne S, Dundar F, Manke T (2016) deepTools2: a next generation web server for deep‐sequencing data analysis. Nucleic Acids Res 44: W160–W165 [DOI] [PMC free article] [PubMed] [Google Scholar]
- Ramos AD, Diaz A, Nellore A, Delgado RN, Park KY, Gonzales‐Roybal G, Oldham MC, Song JS, Lim DA (2013) Integration of genome‐wide approaches identifies lncRNAs of adult neural stem cells and their progeny in vivo . Cell Stem Cell 12: 616–628 [DOI] [PMC free article] [PubMed] [Google Scholar]
- Rutenberg‐Schoenberg M, Sexton AN, Simon MD (2016) The properties of long noncoding RNAs that regulate chromatin. Annu Rev Genomics Hum Genet 17: 69–94 [DOI] [PubMed] [Google Scholar]
- Schultz DC, Ayyanathan K, Negorev D, Maul GG, Rauscher FJ III (2002) SETDB1: a novel KAP‐1‐associated histone H3, lysine 9‐specific methyltransferase that contributes to HP1‐mediated silencing of euchromatic genes by KRAB zinc‐finger proteins. Genes Dev 16: 919–932 [DOI] [PMC free article] [PubMed] [Google Scholar]
- Shibata M, Blauvelt KE, Liem KF Jr, Garcia‐Garcia MJ (2011) TRIM28 is required by the mouse KRAB domain protein ZFP568 to control convergent extension and morphogenesis of extra‐embryonic tissues. Development 138: 5333–5343 [DOI] [PMC free article] [PubMed] [Google Scholar]
- Tsai MC, Manor O, Wan Y, Mosammaparast N, Wang JK, Lan F, Shi Y, Segal E, Chang HY (2010) Long noncoding RNA as modular scaffold of histone modification complexes. Science 329: 689–693 [DOI] [PMC free article] [PubMed] [Google Scholar]
- Vance KW, Ponting CP (2014) Transcriptional regulatory functions of nuclear long noncoding RNAs. Trends Genet 30: 348–355 [DOI] [PMC free article] [PubMed] [Google Scholar]
- Vance KW, Sansom SN, Lee S, Chalei V, Kong L, Cooper SE, Oliver PL, Ponting CP (2014) The long non‐coding RNA Paupar regulates the expression of both local and distal genes. EMBO J 33: 296–311 [DOI] [PMC free article] [PubMed] [Google Scholar]
- Vance KW (2016) Mapping long non‐coding RNA chromatin occupancy using Capture Hybridization Analysis of RNA Targets (CHART). Methods Mol Biol 1468: 39–50 [DOI] [PubMed] [Google Scholar]
- West JA, Davis CP, Sunwoo H, Simon MD, Sadreyev RI, Wang PI, Tolstorukov MY, Kingston RE (2014) The long noncoding RNAs NEAT1 and MALAT1 bind active chromatin sites. Mol Cell 55: 791–802 [DOI] [PMC free article] [PubMed] [Google Scholar]
- Yang HK, Sundholm‐Peters NL, Goings GE, Walker AS, Hyland K, Szele FG (2004) Distribution of doublecortin expressing cells near the lateral ventricles in the adult mouse brain. J Neurosci Res 76: 282–295 [DOI] [PubMed] [Google Scholar]
- Yang L, Lin C, Jin C, Yang JC, Tanasa B, Li W, Merkurjev D, Ohgi KA, Meng D, Zhang J, Evans CP, Rosenfeld MG (2013) lncRNA‐dependent mechanisms of androgen‐receptor‐regulated gene activation programs. Nature 500: 598–602 [DOI] [PMC free article] [PubMed] [Google Scholar]
- Yang X, Song JH, Cheng Y, Wu W, Bhagat T, Yu Y, Abraham JM, Ibrahim S, Ravich W, Roland BC, Khashab M, Singh VK, Shin EJ, Yang X, Verma AK, Meltzer SJ, Mori Y (2014a) Long non‐coding RNA HNF1A‐AS1 regulates proliferation and migration in oesophageal adenocarcinoma cells. Gut 63: 881–890 [DOI] [PMC free article] [PubMed] [Google Scholar]
- Yang YW, Flynn RA, Chen Y, Qu K, Wan B, Wang KC, Lei M, Chang HY (2014b) Essential role of lncRNA binding for WDR5 maintenance of active chromatin and embryonic stem cell pluripotency. eLife 3: e02046 [DOI] [PMC free article] [PubMed] [Google Scholar]
- Yin Y, Yan P, Lu J, Song G, Zhu Y, Li Z, Zhao Y, Shen B, Huang X, Zhu H, Orkin SH, Shen X (2015) Opposing roles for the lncRNA Haunt and its genomic locus in regulating HOXA gene activation during embryonic stem cell differentiation. Cell Stem Cell 16: 504–516 [DOI] [PubMed] [Google Scholar]
- Young CC, Al‐Dalahmah O, Lewis NJ, Brooks KJ, Jenkins MM, Poirier F, Buchan AM, Szele FG (2014) Blocked angiogenesis in Galectin‐3 null mice does not alter cellular and behavioral recovery after middle cerebral artery occlusion stroke. Neurobiol Dis 63: 155–164 [DOI] [PubMed] [Google Scholar]
- Zhao J, Ohsumi TK, Kung JT, Ogawa Y, Grau DJ, Sarma K, Song JJ, Kingston RE, Borowsky M, Lee JT (2010) Genome‐wide identification of polycomb‐associated RNAs by RIP‐seq. Mol Cell 40: 939–953 [DOI] [PMC free article] [PubMed] [Google Scholar]
Associated Data
This section collects any data citations, data availability statements, or supplementary materials included in this article.
Supplementary Materials
Expanded View Figures PDF
Table EV1
Dataset EV1
Dataset EV2
Dataset EV3
Dataset EV4
Review Process File
Source Data for Figure 1
Source Data for Figure 3
Data Availability Statement
The ChIP‐Seq and microarray data have been deposited in the GEO database https://www.ncbi.nlm.nih.gov/geo/) under the following accession numbers: GSE110032 and GSE110033.