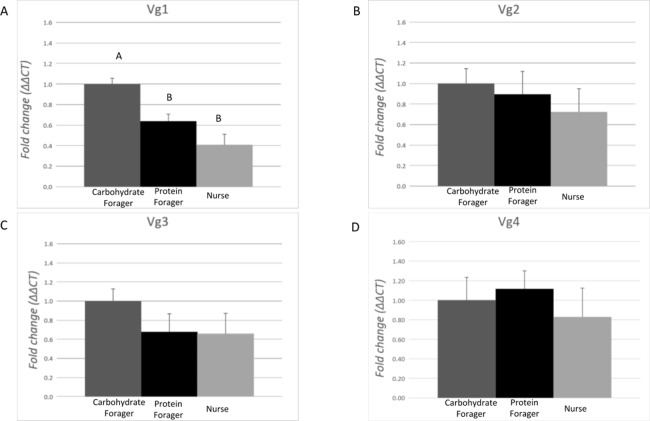
Figure 4. Expression analysis of the vitellogenin transcripts among medium workers performing different tasks.
Each bar represents the mean ± SEM (n = 5). (A) Vg1 transcript expression. (B) Vg2 transcript expression. (C) Vg3 transcript expression. (D) Vg4 transcript expression. Vg mRNA expression level was normalized relative to RP18 mRNA expression level. Statistical relationships between groups were assessed using one-way ANOVA with Tukey–Kramer post hoc test (p < 0.05), where different letters indicate statistical differences among the different task-allocated insects.

