

Abstract
The abilities of infants to perceive basic acoustic differences, essential for language development, can be studied using auditory event-related potentials (ERPs). However, scalp-channel averaged ERPs sum volume-conducted contributions from many cortical areas, reducing the functional specificity and interpretability of channel-based ERP measures. This study represents the first attempt to investigate rapid auditory processing in infancy using independent component analysis (ICA), allowing exploration of source-resolved ERP dynamics and identification of ERP cortical generators. Here, we recorded 60-channel EEG data in 34 typically developing 6-month-old infants during a passive acoustic oddball paradigm presenting ‘standard’ tones interspersed with frequency-or duration-deviant tones. ICA decomposition was applied to single-subject EEG data. The best-fitting equivalent dipole or bilaterally symmetric dipole pair was then estimated for each resulting independent component (IC) process using a four-layer infant head model. Similar brain-source ICs were clustered across subjects. Results showed ERP contributions from auditory cortex and multiple extra-auditory cortical areas (often, bilaterally paired). Different cortical source combinations contributed to the frequency- and duration-deviant ERP peak sequences. For ICs in an ERP-dominant source cluster located in or near the mid-cingulate cortex, source-resolved frequency-deviant response N2 latency and P3 amplitude at 6 months-of-age predicted vocabulary size at 20 months-of-age. The same measures for scalp channel F6 (though not for other frontal channels) showed similar but weaker correlations. These results demonstrate the significant potential of ICA analyses to facilitate a deeper understanding of the neural substrates of infant sensory processing.
Keywords: Event-related potential, Rapid auditory discrimination, Infants, Independent component analysis, Source localization, EEG
Introduction
During the first year of life infants are already able to decode the incoming speech stream and gradually tune their brain to their native language (Kuhl, 2004; Ortiz-Mantilla et al., 2013). This involves establishing the phonemic brain maps fundamental for language acquisition and ongoing linguistic development. Converging evidence suggests that lower-level sensory processing mechanisms include the ability to perform fine-grained acoustic analysis in the tens of millisecond range (i.e., Rapid Auditory Processing or “RAP”), and that these abilities play crucial and foundational roles in acquiring language abilities (e.g., Benasich et al., 2002; Kuhl, 2004; Tallal & Piercy, 1973). Moreover, an increasing number of longitudinal studies show predictive correlations between early basic acoustic discrimination abilities and later language learning outcomes (e.g. Benasich et al., 2006; Choudhury & Benasich, 2011; Leppänen et al., 2010; Cantiani et al., in press), implying that deficits in perceiving brief acoustic differences (e.g., in stimulus frequency, intensity, duration, particularly at short inter-stimuli intervals [ISIs]) can underlie language impairments that impact later speech production, language comprehension and reading ability. For these reasons, there has been increasing interest in the study of auditory information processing abilities in infancy. A common and useful method for this purpose is electroencephalography (EEG) and in particular EEG-derived auditory brain event-related potentials (ERPs).
In the first year of life, average scalp-channel ERPs to auditory stimulus presentations are characterized by two early peaks, often referred to as ‘obligatory responses’, consisting of a positive peak (P1) at about 150 ms after stimulus onset followed by a negative deflection (N2) at 200–250 ms (e.g., Ceponiene et al., 2002; Kushnerenko et al., 2002b). During early childhood the P1, the earlier and larger of these peaks, is thought to be associated with auditory stimulus detection, whereas the size of the N2 deflection seems to be related to sensory memory and feature processing (e.g., Ceponiene et al., 2008). When auditory discrimination is involved (e.g., in “oddball” paradigms in which ‘deviant’ stimuli, most often at a somewhat different pitch or duration, are occasionally and randomly introduced into a sequence of more frequent ‘standard’ stimuli), this early ERP pattern is generally followed by a large positivity peaking about 300–350 ms after presentation of the deviant stimuli (e.g., Kushnerenko et al., 2002a). This third peak is thought to reflect change detection and possibly an orienting process. Since the production of this later peak does not appear to require mindful or active attention to the auditory stimulus stream, it can provide a measure of acoustic discrimination ability even in infants whose focus of attention is elsewhere. In the ‘difference ERP’ obtained by calculating the difference between responses evoked by infrequent (deviant) versus frequent (standard) stimuli, the resultant positive peak produced is labeled the mismatch response (MMR) in infant data (Näätänen et al., 2014). Since in the present paper the analyses are not performed on the difference (deviant minus standard) waveforms, this peak will be referred to as P3, labeled to reflect its polarity and average time of onset. The term “Auditory Deviance Response” (ADR) will be used instead when referring to the whole response complex characterizing the stimulus processing, taking into account a broader process that also captures the same information as the MMR/P3 (Rissling et al., 2014).
There is much controversy concerning the MMR/P3 in the first years of life, since differences in its polarity and latency profile emerge across studies. Compared to the typical mismatch negativity (MMN) elicited within the same paradigms in older children and adults, the infant MMR is often characterized by different polarity (positive instead of negative) and later latency. The debate around physiological and functional similarities and differences between adult MMN and infant MMR is still open. In addition, more clarity regarding what the MMR reflects in infant brain is therefore called for (Näätänen et al., 2014). A few studies have tried to address this issue by investigating cortical sources of the MMR in infancy. Dehaene-Lambertz and Baillet (1998) examined a mismatch-like response in 3-to-4 month infants using speech sound stimuli and reported sources in the posterior and dorsal temporal areas. Hämäläinen et al. (2011) as well as Ortiz-Mantilla et al. (2012) studied EEG-derived source localization of the MMR in the first year of life using non-linguistic deviants (tone pitch changes) and linguistic deviants (consonant–vowel syllables differing in voice onset time) respectively. In both cases a bilateral activation in or near auditory cortex and an additional activation near anterior cingulate cortex were reported.
There are no studies that have investigated the cortical substrates of the MMR as defined by a change in stimulus duration, rather than in pitch or loudness, in a population of infants. Moreover, no one has examined the relationship between source-resolved auditory ERP measures and language development, though some studies have supported associations between scalp-channel ERP measures and later language learning outcomes (e.g. Benasich et al., 2006; Choudhury & Benasich, 2011; Leppänen et al., 2010; Cantiani et al., in press). In the present paper, we tested the use of an EEG source decomposition approach based on Independent Component Analysis (ICA) (Makeig et al., 1996) to further investigate the brain processes supporting information processing of different auditory features, aiming by this means to delineate more specifically the brain cortical areas involved in auditory deviance processing and to evaluate more sensitively the brain dynamics supporting the observed relationship between auditory perception and language development.
In the last twenty years, a growing amount of research has applied ICA to EEG data to better model and assess the complex spatiotemporal dynamics underlying ERP phenomena. ICA decomposition of the unaveraged recorded data allows the separation of brain and non-brain artifact source processes as well as the identification of cortical generators that contribute to scalp ERPs, plus quantification of their individual time courses (Makeig et al., 2002, 2004; Makeig & Onton, 2009; Rissling et al., 2014). Moreover, ICA-derived ERPs are less sensitive to inter-trial variability than traditional scalp averaged ERPs (Johnson et al., 2001) and at the same time may be more highly related to clinical measures (Lenartowicz et al., 2014; Loo et al., 2015; Rissling et al., 2014) than the mixtures of brain and non-brain source signals that constitute single scalp channel recordings.
It is quite plausible, therefore, that ERP measures that directly index local field activity patterns in relevant cortical areas would be more robust and useful than measures derived from scalp channel mixtures. Despite the fact that ICA has become widely used in neuroscience, very few studies have applied this technique to investigate infant cognitive brain function and to examine the reliability of the resulting ERP measures in predicting later development. To our knowledge only Reynolds and coworkers (Reynolds & Richards, 2005, 2009; Reynolds et al., 2010) used ICA decomposition to study infant visual attention and recognition memory by deriving ERP brain sources.
This study aimed to gather more detailed functional information about rapid auditory processing and discrimination in infancy by studying responses to both frequency and duration deviants, by exploring source-resolved ERPs derived by ICA decomposition, first identifying their primary cortical source areas using a realistic head model for 6-month-old infants and then investigating the relation between the source-resolved ERPs and later language development.
Material and methods
Participants
The subject group consisted of 39 typically developing infants, who had no reported family history of language-learning impairment (LLI), sensorial, neurological or intellectual disorders, attention-deficit disorder, or autism. Participants were recruited by local advertisement from three hospitals in Northern Italy (Lecco and Monza-Brianza area). The study protocol was approved by the Ethical and Scientific Committees of all the clinical institutes involved in the project. Informed consent was obtained from parents prior to their child's inclusion in the study. Families were contacted prior to the child's 6-month birthday and a visit to the laboratory was scheduled at 6 months and 15 days (M = 6.4, SD = 0.4). During the visit, EEG data were recorded and the cognitive subscale of the Bayley Scales of Infant Development (Bayley, 1993) was administered. In addition, socio-demographic, prenatal and perinatal information were collected using a parental report questionnaire. The following inclusion criteria were adopted: (1) all first-degree relatives had an absence of certified diagnosis of LLI, sensorial, neurological and/or intellectual disorders, attention-deficit disorder, and/or autism; (2) both parents were native Italian speakers; (3) gestational age ≥ 37 weeks; (4) birth-weight ≥ 2500 g; (5) APGAR scores at birth at 1 and at 5 min ≥ 9; (6) Bayley Cognitive Score ≥ 7. Five subjects were excluded due to an insufficient amount of good EEG data available; data from 34 infants (16 males and 18 females) were analyzed. Demographic and clinical subject characteristics are reported in Table 1.
Table 1.
Demographic and clinical characteristic of the subject group (N = 34).
| Mean | Standard deviation | Minimum | Maximum | |
|---|---|---|---|---|
| Age (days) | 193.1 | 12.9 | 175.0 | 233.0 |
| Gestational week | 39.6 | 1.2 | 37.0 | 42.0 |
| Birth weight (g) | 3295.3 | 475.5 | 2590.0 | 4240.0 |
| SESa | 67.6 | 14.4 | 40.0 | 90.0 |
| APGAR 1′ | 9.7 | 0.5 | 9.0 | 10.0 |
| APGAR5′ | 9.9 | 0.4 | 9.0 | 10.0 |
| Bayley cognitive scale | 12.6 | 1.7 | 8.0 | 16.0 |
Socio-economic status (SES) was scored using the Hollingshead 9-point scale (1975).
Stimuli
RAP was assessed by means of an electrophysiological task. A non-speech multi-feature auditory task paradigm was used (Fig. 1) in which pairs of brief complex tones were presented with an interstimulus interval (ISI) of 70 ms. The tones had a fundamental frequency of 100 or 300 Hz with 15 harmonics (6 dB toll-off per octave) and a duration of 70 ms or 200 ms (5 ms rise and fall times). Standard tone pairs (STD stimuli) were composed of two identical tones (F0 = 100 Hz, duration = 70 ms). Two deviant tone pairs differing with respect to the second tone were presented: in stimuli ‘deviant for frequency’ (FDEV) the second tone had a fundamental frequency of 300 Hz; in stimuli ‘deviant for duration’ (DDEV) the second tone duration was 200 ms. The stimuli were presented in a passive oddball paradigm in which 1200 stimuli (80% STD, 10% FDEV, 10% DDEV) were delivered in a pseudo-random order, with the constraint of at least three STD stimuli occurring between deviant pairs. A temporal jitter of ± 100 ms was added to the inter-trial interval (offset-to-onset, ITI) and thus varied randomly from 700 ms to 900 ms. All stimuli were presented free field via speakers located on either side and equidistant (95 cm) from the subject's head at an intensity of 75 dB.
Fig. 1.
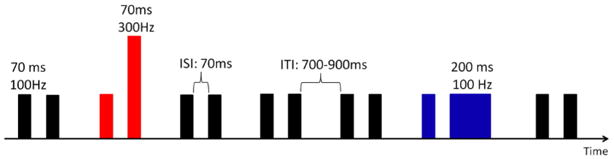
Schematic representation of the non-speech multi-feature oddball paradigm. The standard (STD) stimulus is represented in black (STD), the frequency deviant (FDEV) stimulus in red, and the duration deviant (DDEV) stimulus in blue.
EEG data acquisition
EEG signals were acquired while children were seated on their caregiver's lap in a sound-attenuated and electrically-shielded room. Age-appropriate silent movies/cartoons were played on a video monitor placed in front of the infants. In addition, an experimenter was present in the room to entertain the children with silent toys to keep them engaged and to minimize their movement.
Auditory ERPs were recorded from 60 scalp sites using a dense-array EGI recording system (Electric Geodesic, Inc., Eugene, Oregon). The vertex was used as the online reference. EEG data were sampled at 250 Hz and bandpass filtered online (0.1–100 Hz). After recording, data were exported to a Matlab (Mathworks, Natick, MA) compatible format and processed within the EEGLAB (v13.4.3b) signal processing environment (Delorme & Makeig, 2004) running under Matlab R2014a.
EEG data processing
Symmetric 1-Hz high pass and then 40-Hz low pass FIR filters were applied to the continuous EEG data. Artifact-laden channels and data periods were identified and removed using the EEGLAB plug-in clean_rawdata. In particular, channels with a flat-line duration higher than 5 s and those poorly correlated with their interpolated reconstruction based on neighboring channels (correlation thresholds = 0.85) were considered abnormal and were rejected. No more than 15% (≤9) of the channels were discarded (mean number of rejected channels = 3, SD = 2, range = 0–8). Data periods in which more than the 50% of the channels were contaminated by artifacts were also removed. The EEG signals were then re-referenced to average reference and 900 ms epochs (from 100 ms before to 800 ms after stimulus onset) were extracted. STD stimuli that immediately followed a deviant pair were excluded. To improve subsequent ICA decomposition, epochs containing artifacts were rejected. Two different criteria were used for artifact identification: an abnormal amplitude test (threshold = ±250 μV) and a data improbability test (SD > 5 for each channel; mean SD > 2 for all channels) (Delorme et al., 2007). As a result, a mean of 465 STD epochs (SD = 73, range = 330–612), 77 FDEV epochs (SD = 13, range = 53–103) and 76 DDEV epochs (SD = 13, range = 59–105) remained. Before ICA decomposition, channel POz was discarded to compensate for the data rank reduction caused by average re-referencing.
Adaptive Mixture Independent Component Analysis (AMICA) (Palmer et al., 2006, 2008) was applied to the remaining concatenated EEG epochs, independent of the type of stimulus. AMICA convergence was assured by performing 2000 iterations and the do_reject option was used. Thus, in early iterations, more data points that did not fit the source independence model used for EEG source separation (SD > 5) were excluded from further AMICA computation. The mean rejection rate was 4.7% (SD = 1.2%, range= 2.2%–7.5%). This process produced a total of 1919 independent components (ICs) across the 34 subjects. The AMICA algorithm was chosen, among the several available ICA methods, because of its reported superior performance in reducing mutual information among scalp channels and finding individual physiologically plausible brain source signals (Delorme et al., 2012).
Infant head model generation and independent component equivalent dipole estimation
The Neuroelectromagnetic Forward Head Modeling (NFT) toolbox (Acar & Makeig, 2010) was used to generate a realistic four-layer head model for 6-month-old infants using an averaged template MR image provided by the Montreal Neurologic Institute (MNI) for the age group five-to-eight months (Fig. 2). The model was generated employing the Finite Element Method (FEM) to obtain a more accurate calculation of the electrical field compared to a simpler spherical head model (Wolters et al., 2002). The whole head volume was represented using tetrahedral elements and the digitized electrode locations were aligned to the head mesh. For the numerical solution of the forward problem the following conductivity values were used: 0.33 S/m for brain and scalp, 1.79 S/m for cerebrospinal fluid (CSF), and 0.0581 S/m for the skull. For each IC the inverse problem was solved using the NFT toolbox facility based on Fieldtrip toolbox functions (Oostenveld et al., 2011), and the 3-D location of the best fitting equivalent current dipole was estimated. ICs showing a clear left–right symmetric activity that could not be accurately modeled using a single equivalent dipole were identified visually and fit using two position-symmetric (but direction-independent) equivalent dipoles.
Fig. 2.
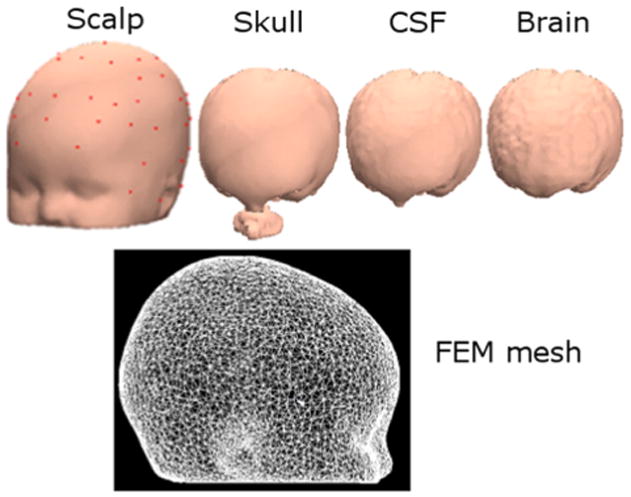
(top) The four BEM model layers of the template electrical forward problem head model for 6-month old infants. Electrode locations are shown on the scalp surface. (bottom) The FEM model mesh derived from the BEM layer meshes, modeling the whole head volume and used to localize the IC sources.
Independent component clustering
First, ICs whose equivalent dipole model was estimated to be outside the brain were rejected, leaving 1596 ICs. An initial clustering procedure was applied to these ICs to identify and reject ICs accounting for non-brain (artifactual) activities. This clustering used k-means clustering as implemented in EEGLAB. The clustering approach allows subject group analysis by identifying similar components across subjects. It assumes that functionally equivalent ICs are present across most subjects in similar spatial position and that these ICs have similar responses to experimental conditions across the measures used as clustering criteria. The following IC measures were selected: mean log power spectra (dimension: 30, relative weighting: 5, frequency range: 1–40 Hz) and scalp maps (dimension: 30, relative weighting: 3). Since the aim of this clustering process was the identification of artifact ICs (e.g., ICs accounting for scalp EMG and eye movement artifacts) we used measures that mark these types of artifacts. First, the algorithm computed a cluster position vector for each component based on the selected measures. Next, these dimensions were weighted based on a priori considerations and were then compressed using Principal Component Analysis (PCA). The resulting ‘cluster position’ vectors, taken to measure the ‘effective distance’ of components from each other, were then used in the iterative k-means clustering algorithm. In this preliminary clustering procedure, we decided to use a large number of clusters to increase the probability of isolating artifact ICs from brain ICs. 60 clusters were created, and then those clearly related to non-EEG activity or noise sources were rejected, thus, eliminating ICs associated with artifacts. Moreover, ICs whose equivalent dipole model, when projected to the scalp, had a residual variance from the IC scalp map greater than 25% were excluded from further analysis. This is because, low residual variance of the equivalent dipole model may indicate a physiologically plausible IC brain source signal (Delorme et al., 2012). The 25% threshold was empirically assessed (for the full description of this procedure see the Supplementary material). After this reduction, 824 ICs remained for analysis (on average, 24.2 ICs per subject, SD = 5.2, range = 15–37).
A second clustering procedure was performed on the remaining 824 ICs, using the same algorithm previously explained. The following measures were used in this clustering: equivalent dipole location (dimension: 3, relative weighting: 10) and (STD, FDEV and DDEV) ERPs in the 700 ms following the stimulus onset (dimension: 17, relative weighting: 5). The highest weight was given to IC equivalent dipole locations so as to accentuate the spatial compactness of the resulting IC source clusters. As on average 24.2 (SD = 5.2) ICs per subject were used in the clustering procedure, we created 20 clusters, enhancing the chance for each cluster to include at least one IC from each subject. The clusters were then manually inspected and some remaining ‘cluster-outlier’ ICs were identified visually by their scalp maps and were excluded from further analysis. On average 1.2 (SD = 0.2) ICs per subject were contained in each cluster.
Source cluster contributions to the ERPs
For each IC in each source cluster, the three trial-averaged ERPs (STD, FDEV, DDEV) were computed. Data epochs from 100 ms before to 800 ms following stimulus onsets were averaged; the 100 ms pre-stimulus data segments were used for baseline correction. Grand-average IC cluster ERPs for each stimulus category were then computed and the five IC clusters contributing most strongly to the grand-mean scalp ERPs were identified based on the cluster-mean pvaf calculated for each source cluster across the 0 ms to 700 ms time window (Rissling et al., 2014). The decision to use such a large time window was related to our interest in taking into account the IC cluster contribution to the whole response complex for each stimulus type.
ERP peak amplitude and latency measures were computed for the most strongly contributing source clusters. Specifically, since P1 and N2 peaks are considered ‘obligatory’ auditory response features (Ceponiene et al., 2002) they were analyzed only for the IC clusters that contributed most strongly to the STD response. Whereas, the P3 peak, which is thought to index sensory discrimination processes (Kushnerenko et al., 2002a), was measured in the IC clusters that contributed most strongly to the ERPs for the deviant stimuli. P1 and N2 peak measures were extracted in the time window 130 ms–330 ms and 250 ms–450 ms respectively. P3 peak measures were extracted in the time window 350 ms–550 ms for the STD and FDEV waveforms, and in the window 420 ms–620 ms for DDEV waveforms. ERP peak latencies were calculated using an automated peak detection routine beginning at the onset of the first tone in the pair. Peak amplitudes were measured as mean voltage in the 20 ms surrounding the identified peak latency. Since N2 peak amplitude is strongly related to P1 peak amplitude, the difference between the two values (ΔP1–N2) was computed and considered a measure of the P1–N2 complex.
To localize the most strongly contributing clusters, a translation from the infant template MRI coordinates to the MNI standard brain was performed and Talairach coordinates were extracted. Then the cortex areas closest to cluster centroids were identified using the Talairach Applet (Lancaster et al., 2000). Moreover, cluster IC equivalent dipole positions projected on the MNI infant template brain were visually inspected by to check for consistency.
Linguistic outcome measure
Expressive vocabulary for the same subjects at 20 months-of-age was assessed via the Language Development Survey (LDS), a 310-word parental-report screening tool for toddlers. The inventory provides a total vocabulary score for which norms are available from ages 18-35 months (Rescorla & Alley, 2001) along with percentile ranks and age-equivalent scores. The LDS has recently been standardized on an Italian population (Rescorla et al., 2014).
Before the child's 20-month birthday, caregivers were mailed packets containing the LDS to fill-in at home. Parents were asked to bring the forms to a scheduled laboratory visit at 20 months, 15 days ± two weeks. At the time of this writing, these outcome measures were available for 28 of the 34 subjects (82.4% of the sample).
The results of the LDS questionnaire were used to analyze the association between language outcome and ERP measures. To investigate whether source-resolved and traditional scalp-channel ERP measures have a different sensitivity to the linguistic outcome, the ERP measures described in the previous section were also computed for three representative scalp channels. Since the ADR is typically measured at one or more mid-frontal scalp electrode channels, for this comparison we used channels F5, Fz, and F6.
Statistical analysis
To check the distribution of each variable of interest the Kolmogorov-Smirnov test was used. Since some variables showed a distribution significantly different from the normal one (p < .050), we decided to use a non-parametric statistic, which make no assumptions about the probability distribution of the analyzed variables.
First, the reliability of the source-resolved ERP peaks was investigated. A one-sample Wilcoxon signed rank test was used to evaluate P1 and P3 median peak amplitude differences from zero. As previously stated, since N2 peak amplitude is related to P1 peak amplitude, the reliability of the N1–P2 complex was tested using a paired Wilcoxon signed rank test to confirm that the median difference between the two peak amplitude values was not zero.
Next, two different analyses were performed: the investigation of ERP stimulus-type effect (STD vs. FDEV vs. DDEV) within-clusters (repeated measures analysis) and the investigation of the differences among clusters (not related measures analysis) regarding ERP measures (peak latencies and amplitudes).
The ERP stimulus-type effect was investigated for only P3 peak amplitude and latency. This choice is related to the fact that P3 peak is known to reflect discrimination processes in infants. For each IC cluster which contributed to the FDEV or DDEV response, a Friedman test was applied separately to the P3 peak amplitude and latency measures, assessing differences related to the stimulus type (STD vs. FDEV vs. DDEV). Significant interactions were investigated using Wilcoxon pairwise comparisons in which adjusted significance levels were set conservatively applying the Bonferroni correction, so that overall, across all of the tests, the Type I error rate remained at 5%.
Differences among cluster regarding peak amplitudes and latencies were analyzed separately for both P3 and the earlier (P1, N2, P1–N2 delta) response features. In this case the Kruskal–Wallis test was used, followed by Mann–Whitney pairwise comparisons in which the Bonferroni correction was applied adjusting the significance levels conservatively, so that overall, across all of the tests, the Type I error rate remains at 5%.
Finally, Spearman's non-parametric correlation coefficients were used to examine the relationship between (both source-resolved and scalp-channel) ERP peak measures and language outcome measures. A 1000-step bootstrap technique was applied (Field, 2013), to obtain more robust results. Confidence intervals (CIs) that did not contain the value 0 were taken to indicate significant correlation effects. In computing CIs false coverage statement rate (FCR) adjustment (Benjamini & Yekutieli, 2005) was applied to correct for multiple comparisons. To further evaluate the predictive capability of source-resolved and scalp-channel ERP measures, multiple regression models, with blockwise entry method, were constructed including relevant ERP measures as independent variables and linguistic outcome as dependent variable.
All statistical analyses were conducted using IBM SPSS (‘Statistics 21’) software, except for the FCR adjustment which was performed using the freely available Matlab function fdr_bh.m (Groppe, 2015).
Results
Primary contributing source cluster response
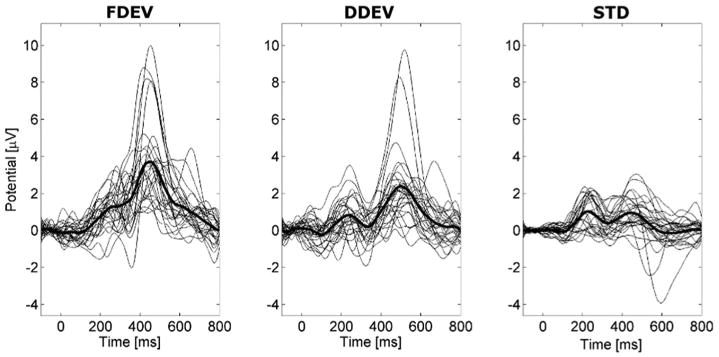
The five cortical source clusters that contributed the most to the scalp grand-mean ERP for the three different stimulus types are shown in Fig. 3 which depicts the envelopes (the max and min values at each latency) of the summed scalp-channel contributions of the contributing source clusters (outer black traces), and the envelopes of the projections of the individual contributing clusters (colored traces), with their scalp topographies and their pvaf values. For each stimulus category, the five largest contributing clusters together accounted for at least 90% of the respective grand mean ERP variance. Four source clusters contributed to the ERPs for all types of stimuli; they were located in or near the mid-cingulate cortex, transverse temporal gyrus, and dorsal and ventral posterior cingulate cortices. One additional cluster contributed to the response for each type of stimulus: a cluster in or near the middle occipital gyrus contributed to the FDEV response; a cluster in or near the subgenual anterior cingulate cortex contributed to the DDEV response; and a cluster in or near the postcentral gyrus contributed to the STD response. The Mid Cingulate cluster contribution was dominant, with a pvaf near 60%.
Fig. 3.
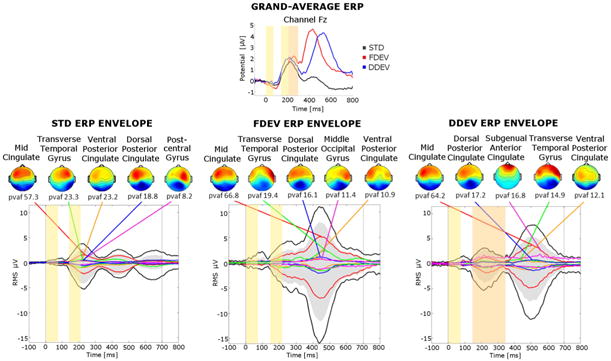
(top) Grand-average ERP waveforms at scalp channel Fz. The standard stimulus response waveform (STD, black trace) is plotted against the responses to frequency deviants (FDEV, red trace) and to duration deviants (DDEV, blue trace). (bottom) Scalp topographies of the summed ERP projections of the most strongly contributing IC source clusters for each stimulus type (from left to right: STD, FDEV and DDEV). For each cluster, the percent variance accounted for (pvaf) in the scalp channel ERP is shown below its scalp map. Black traces in each graph show the envelope (the most positive and negative single-channel values at each latency) of the grand-average scalp channel ERP. Upper and lower edges of the gray areas represent the envelope of the summed contributions of the five contributing clusters. Colored traces show the envelopes of the summed cluster-IC scalp projections. Yellow and orange panels represent the durations of the tone pair stimuli (yellow panels: for first and second both STD or STD and FDEV tones; orange panel: for a DDEV second tone).
Three-dimensional locations of the equivalent model dipoles for the ICs of the seven identified clusters are shown in Fig. 4. Transverse Temporal Gyrus, Middle Occipital Gyrus and Postcentral Gyrus clusters were characterized by a pronounced bilateral scalp projection. In fact, among the 824 ICs used in the clustering procedure 135 ICs (16.4%) showed a clear symmetric left–right projection and were therefore modeled using two symmetric dipoles. On average 72.7%of subjects were included in each source cluster (Table 2).
Fig. 4.
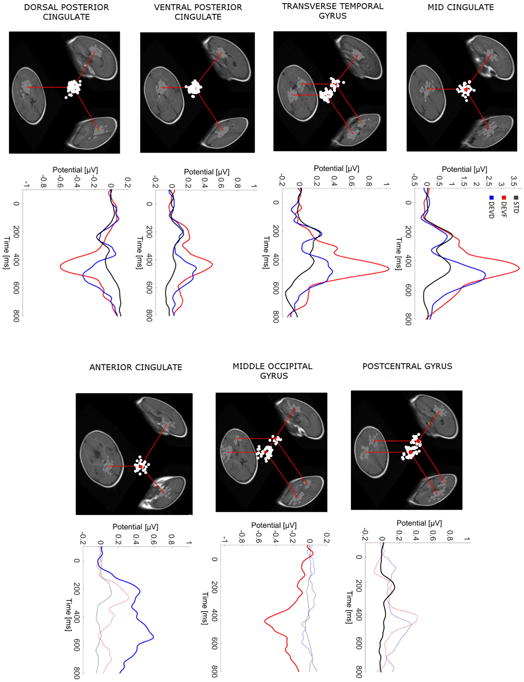
For each source cluster: (1) three-dimensional equivalent dipole model locations of the ICs contributing to the cluster. Dipole projections are shown in the sagittal, coronal and transverse planes of the MNI infant template brain model. Cluster dipole centroids are shown in red. For the clusters characterized by a bilateral activation two centroids are shown, one in each hemisphere. (2) Grand-average ERP waveforms. The standard stimulus response (STD, black trace) is overplotted on the frequency deviant (FDEV, red trace) and duration deviant (DDEV, blue trace) responses. Dotted traces show responses from source clusters not among the five largest contributing clusters.
Table 2.
The numbers of subjects and independent components (ICs) contributing to each IC cluster.
| Source cluster | # of subjects | # of ICs |
|---|---|---|
| Mid Cingulate | 21 | 28 |
| Transverse Temporal Gyrus | 29 | 51 |
| Dorsal Posterior Cingulate | 27 | 63 |
| Ventral Posterior Cingulate | 23 | 54 |
| Middle Occipital Gyrus | 24 | 38 |
| Anterior Cingulate | 25 | 32 |
| Postcentral Gyrus | 24 | 37 |
| Mean | 24.7 (72.7%) | 43.3 |
ERP waveform morphologies
As it is evident from the grand-average responses for the frontocentral scalp channel Fz and from the response envelopes shown in Fig.3, scalp-channel ERP waveforms were characterized by two positive peaks (P1 and P3) separated by a negative deflection (N2). The P1 component peaked near 220 ms in responses to both STD and deviant stimuli. The N2 peak occurred near 350 ms; in the FDEV condition it was truncated by the following large positivity. The P3 peak appeared larger in response to deviant stimuli than to STDs and its latency depended on condition: near 450 ms for FDEV and STD and 520 ms for DDEV.
Fig. 4 shows grand-average source cluster waveforms for the seven identified clusters. Waveforms for four clusters (Mid Cingulate, Transverse Temporal Gyrus, Dorsal Posterior Cingulate and Ventral Posterior Cingulate) contributing to the scalp ERPs in all conditions (STD, FDEV and DDEV) were similar to the scalp response (Fig. 3). The three clusters that contributed most to a particular stimulus response exhibited dominant features. For the Middle Occipital Gyrus cluster the FDEV P3 peak was most evident, the Subgenual Anterior Cingulate cluster P3 peak was largest in response to DDEV P3. The Dorsal Mid Cingulate cluster had a well-defined P1 peak in response to standard stimuli.
It is relevant to notice that the Mid Cingulate cluster accounted for the largest part of scalp ERP variance and was much larger than the other cluster responses (Fig. 4), although it also displayed marked inter-subject variability (Fig. 5).
Fig. 5.
Thin black traces are ERP waveforms for individual ICs in the Mid Cingulate cluster in the three response conditions: FDEV, DDEV and STD (from left to right respectively). Superimposed thick traces show the grand average Mid Cingulate cluster ERP waveforms.
Cortical source ERP component amplitudes and latencies
Table 3 shows median ERP peak amplitudes and latencies for the seven contributing clusters. P3 peak measures were calculated for all stimulus types (STD, FDEV and DDEV) for the cluster (Mid Cingulate, Transverse Temporal Gyrus, Ventral Posterior Cingulate and Dorsal Posterior Cingulate) that contributed to all the ERPs. Since the Middle Occipital Gyrus cluster contributed only to the FDEV response and the Subgenual Anterior Cingulate cluster contributed only to the DDEV response, for these clusters P3 peak measures were computed for the corresponding deviant and STD stimulus responses. P3 peak was not measured for the Postcentral Gyrus cluster, which contributed only to the STD stimulus response. For this cluster P1,N2 and ΔP1–N2 measures were calculated. P1 and N2 amplitudes and latencies, as well as the ΔP1–N2, were also computed for the Mid Cingulate, Transverse Temporal Gyrus, Ventral Posterior Cingulate, and Dorsal Posterior Cingulate clusters, that also contributed to the STD stimulus response.
Table 3.
ERP peak measures (P3, P1, N2 amplitude and latency) of the ICs contributing to the each source cluster, median values and inter-quartile intervals (IQR) are shown.
| Stimulus type | P3 amplitude | P3 latency | P1 amplitude | P1 latency | N2 amplitude | N2 latency | |
|---|---|---|---|---|---|---|---|
|
|
|
|
|
|
|
||
| Median (IRQ) [μV] | Median (IRQ) [ms] | Median (IRQ) [μV] | Median (IRQ) [ms] | Median (IRQ) [μV] | Median (IRQ) [ms] | ||
| STD | 1.05 (1.25)* | 452 (54) | 1.2 (1.32)* | 228 (53) | −0.01 (0.66)# | 334 (85) | |
| Mid Cingulate | FDEV | 3.78 (1.47)* | 440 (65) | – | – | – | – |
| DDEV | 2.37 (1.69)* | 506 (49) | – | – | – | – | |
| STD | 0.36 (0.52)* | 440 (92) | 0.36 (0.84)* | 232 (114) | −0.08 (0.38)# | 320 (134) | |
| Transverse Temporal Gyrus | FDEV | 1.27 (1.33) | 456 (56) | – | – | – | – |
| DDEV | 0.75 (0.84)* | 496 (110) | – | – | – | – | |
| STD | 0.18 (0.37)* | 450 (126) | 0.20 (0.42)* | 216 (92) | −0.09 (0.29)# | 364 (124) | |
| Ventral Posterior Cingulate | FDEV | 0.69 (0.90)* | 440 (67) | – | – | – | – |
| DDEV | 0.47 (0.73)* | 492 (103) | – | – | – | – | |
| STD | −0.19 (0.32)* | 420 (108) | −0.25 (0.41)* | 232 (66) | 0.08 (0.26)# | 356 (100) | |
| Dorsal Posterior Cingulate | FDEV | −0.60 (1.04)* | 448 (58) | – | – | – | – |
| DDEV | −0.45 (0.74)* | 476 (86) | – | – | – | – | |
| STD | −0.18 (0.29)* | 440 (109) | |||||
| Middle Occipital Gyrus | FDEV | −0.49 (1.02)* | 444 (115) | – | – | – | – |
| STD | 0.14 (0.34) * | 480 (132) | – | – | – | – | |
| Anterior Cingulate | DDEV | 0.73 (0.98) * | 526 (114) | – | – | – | – |
| Postcentral Gyrus | STD | – | – | 0.18 (0.40)* | 212 (96) | −0.07 (0.20)# | 380 (144) |
Indicates one-sample Wilcoxon signed-rank test p <.001.
Indicates paired Wilcoxon signed-rank test p <.001.
P3 amplitude in the considered clusters was significantly above zero in response to all types of stimuli (all ps < .001). P1 amplitude was also significantly above zero in all the clusters contributing to the STD response (all ps < .001). For the same clusters, the P1 peak amplitude resulted significantly different from the N2 amplitude (all ps < .001) (Table 3). These results show the reliability of the source resolved ERP components identified.
Table 4 summarizes statistical results related to the stimulus type effect on the source-resolved P3 measures. In the four clusters contributing to all experimental conditions, the Friedman test applied to P3 measures indicated a stimulus-type effect for both amplitude and latency (all ps < .001). Post hoc comparisons showed that for all the clusters P3 amplitudes in the DDEV and FDEV responses were larger than in the STD response (p values in Table 4). The largest P3 amplitude occurred in response to the FDEV stimulus. In the Transverse Temporal Gyrus and Dorsal Posterior Cingulate clusters a significant difference in P3 amplitude between FDEV and DDEV response emerged.
Table 4.
Summary of the stimulus-type effect on P3 peak amplitudes and latencies in the contributing IC clusters. Statistics and p-values for the Friedman test and for selected pairwise comparisons are shown. Significant p-values are bolded.
| Friedman test | Wilcoxon pairwise comparisons | ||||
|---|---|---|---|---|---|
|
|
|
||||
| Cluster | F(2) | p | Pairs | Z | Adjusted p |
| Mid Cingulate | |||||
| Amplitude | 40.786 | <.001 | STD vs. FDEV | 6.281 | <.001 |
| STD vs. DDEV | 4.143 | <.001 | |||
| FDEV vs. DDEV | 2.138 | .098 | |||
| Latency | 18.505 | <.001 | STD vs. FDEV | .947 | >.999 |
| STD vs. DDEV | 3.675 | .001 | |||
| FDEV vs. DDEV | −3.742 | .001 | |||
| Transverse Temporal Gyrus | |||||
| Amplitude | 48.510 | <.001 | STD vs. FDEV | 6.931 | <.001 |
| STD vs. DDEV | 4.060 | <.001 | |||
| FDEV vs. DDEV | 2.871 | .012 | |||
| Latency | STD vs. FDEV | .961 | >.999 | ||
| STD vs. DDEV | 4.258 | <.001 | |||
| FDEV vs. DDEV | −4.208 | <.001 | |||
| Ventral Posterior Cingulate | |||||
| Amplitude | 29.778 | <.001 | STD vs. FDEV | 5.196 | <.001 |
| STD vs. DDEV | 4.041 | <.001 | |||
| FDEV vs. DDEV | .248 | .745 | |||
| Latency | 27.712 | <.001 | STD vs. FDEV | −.144 | >.999 |
| STD vs. DDEV | 4.474 | <.001 | |||
| FDEV vs. DDEV | −4.619 | <.001 | |||
| Dorsal Posterior Cingulate | |||||
| Amplitude | 38.984 | <.001 | STD vs. FDEV | −6.236 | <.001 |
| STD vs. DDEV | −2.851 | .013 | |||
| FDEV vs. DDEV | −3.385 | .002 | |||
| Latency | 18.271 | <.001 | STD vs. FDEV | 1.649 | .298 |
| STD vs. DDEV | 4.232 | <.001 | |||
| FDEV vs. DDEV | −2.584 | .029 | |||
| Middle Occipital Gyrus | |||||
| Amplitude | STD vs. FDEV | 4.662 | <.001 | ||
| Latency | STD vs. FDEV | −.283 | .777 | ||
| Anterior Cingulate | |||||
| Amplitude | STD vs. DDEV | −4.432 | <.001 | ||
| Latency | STD vs. DDEV | 3.292 | .001 | ||
As expected, the P3 peak was significantly later in response to the DDEV stimulus than for either the STD or FDEV stimuli (p values in Table 4). In fact, the deviation of the DDEV stimulus from the STD stimulus appears only after 70 ms, whereas the stimulus deviation of the FDEV from the STD appears at stimulus onset (0 ms).
The Middle Occipital Gyrus and Subgenual Anterior Cingulate clusters exhibited a larger P3 in the FDEV and DDEV responses, respectively, than in response to STDs (both ps < .001). For the Subgenual Anterior Cingulate cluster, P3 peak latency in response to the DDEV stimulus was larger than in the STD stimulus response (p = .001).
Statistical analysis results of the ERP measure comparisons among clusters are summarized in Table 5. No differences in peak latencies were found. By contrast, significant differences emerged for peak amplitudes (all ps < .001). In particular, the Mid Cingulate cluster responses contained larger P3, P1 peaks and ΔP1–N2 than for all the other clusters (see p values in Table 5). Significant differences were confirmed between P1, N2 and P3 amplitude measures in clusters with opposite response polarities (all ps ≤ .001), with the exception of N2 peak amplitude in the Mid Cingulate and Dorsal Posterior Cingulate clusters (p > .999). Finally, the ΔP1–N2 was larger in Transverse temporal Gyrus cluster than in either the Dorsal Posterior Cingulate and Postcentral Gyrus clusters (p = .029 and .047 respectively).
Table 5.
IC cluster differences in source-resolved ERP peak measures. Statistics and p-values for the Kruskal–Wallis test and for significant pairwise comparisons are shown. Significant p-values are bolded.
| Kruskal–Wallis test | Mann–Whitney pairwise comparisons | ||||
|---|---|---|---|---|---|
|
|
|
||||
| Peak measure | X2 | p | Pairs | Z | Adjusted p |
| P3 FDEV amplitude | 185.523 | <.001 | Mid Cing. vs. Transverse Temporal Gyrus | 3.131 | .017 |
| Mid Cing. vs. Ventral Posterior Cing. | 4.559 | <.001 | |||
| Mid Cing. vs. Dorsal Posterior Cing. | 10.657 | <.001 | |||
| Mid Cing. vs. Mid Occipital Gyrus. | 9.576 | <.001 | |||
| Transverse Temporal Gyrus vs. Dorsal Posterior Cing. | 8.941 | <.001 | |||
| Transverse Temporal Gyrus vs. Mid Occipital Gyrus. | 7.692 | <.001 | |||
| Ventral Posterior Cing. vs. Dorsal Posterior Cing. | 7.327 | <.001 | |||
| Ventral Posterior Cing. vs. Mid Occipital Gyrus. | 6.249 | <.001 | |||
| Latency | 3.179 | .528 | / | ||
| 147.152 | <.001 | Mid Cing. vs. Transverse Temporal Gyrus | 4.454 | <.001 | |
| Mid Cing. vs. Ventral Posterior Cing. | 5.304 | <.001 | |||
| Mid Cing. vs. Dorsal Posterior Cing. | 11.051 | <.001 | |||
| Mid Cing. vs. Anterior Cing. | 3.546 | .004 | |||
| Transverse Temporal Gyrus vs. Dorsal Posterior Cing. | 7.763 | <.001 | |||
| Ventral Posterior Cing. vs. Dorsal Posterior Cing. | 6.874 | <.001 | |||
| Dorsal Posterior Cing. vs. Anterior Cing. | −7.335 | <.001 | |||
| Latency | 5.489 | .241 | / | ||
| P3 STD amplitude | 127.371 | <.001 | Mid Cing. vs. Transverse Temporal Gyrus | 2.966 | .045 |
| Mid Cing. vs. Ventral Posterior Cing. | 4.325 | <.001 | |||
| Mid Cing. vs. Dorsal Posterior Cing. | 8.898 | <.001 | |||
| Mid Cing. vs. Mid Occipital Gyrus. | 8.382 | <.001 | |||
| Mid Cing. vs. Anterior Cing. | 4.235 | <.001 | |||
| Transverse Temporal Gyrus vs. Dorsal Posterior Cing. | 7.026 | <.001 | |||
| Transverse Temporal Gyrus vs. Mid Occipital Gyrus. | 6.487 | <.001 | |||
| Ventral Posterior Cing. vs. Dorsal Posterior Cing. | 5.467 | <.001 | |||
| Ventral Posterior Cing. vs. Mid Occipital Gyrus. | 5.103 | <.001 | |||
| Dorsal Posterior Cing. vs. Anterior Cing. | −4.262 | <.001 | |||
| Mid Occipital Gyrus vs. Anterior Cing. | −4.134 | .001 | |||
| Latency | 4.662 | .458 | / | ||
| P1 STD amplitude | 131.827 | <.001 | Mid Cing. vs. Transverse Temporal Gyrus | 2.881 | .040 |
| Mid Cing. vs. Ventral Posterior Cing. | 4.320 | <.001 | |||
| Mid Cing. vs. Dorsal Posterior Cing. | 10.086 | <.001 | |||
| Mid Cing. vs. Postcentral Gyrus. | 4.183 | <.001 | |||
| Transverse Temporal Gyrus vs. Dorsal Posterior Cing. | 8.564 | <.001 | |||
| Ventral Posterior Cing. vs. Dorsal Posterior Cing. | 6.928 | <.001 | |||
| Dorsal Posterior Cing. vs. Postcentral Gyrus. | −6.001 | <.001 | |||
| Latency | 4.257 | .372 | / | ||
| N2 STD amplitude | 27.891 | <.001 | Transverse Temporal Gyrus vs. Dorsal Posterior Cing. | −4.357 | <.001 |
| Ventral Posterior Cing. vs. Dorsal Posterior Cing. | −4.271 | <.001 | |||
| Dorsal Posterior Cing. vs. Postcentral Gyrus. | 3.490 | .005 | |||
| Latency | 7.947 | .094 | / | ||
| ΔP1–N2 | 48.685 | <.001 | Mid Cing. vs. Transverse Temporal Gyrus | 3.522 | .004 |
| Mid Cing. vs. Ventral Posterior Cing. | 5.461 | <.001 | |||
| Mid Cing. vs. Dorsal Posterior Cing. | 6.118 | <.001 | |||
| Mid Cing. vs. Postcentral Gyrus. | 5.746 | <.001 | |||
| Transverse Temporal Gyrus vs. Dorsal Posterior Cing. | 2.979 | .029 | |||
| Transverse Temporal Gyrus vs. Postcentral Gyrus. | 2.828 | .047 | |||
Associations between cortical source responses and linguistic outcome measures
Overall, the results of the LDS questionnaire (Rescorla et al., 2014) showed great variability within the sample. The mean number of produced words was 79 (SD = 66, range = 0–227), corresponding to the following population percentile scores: mean = 44, SD = 28, range = 5–90. Predictions of performance on 20-month language measures based on the 6-month source-resolved ERPs were assessed for the Mid Cingulate cluster peak measures (P1, N2, P3 latencies; P1, P3, ΔP1– N2 amplitudes) since this was the dominant cluster. Percentile scores based on gender-specific norms were used in the correlations. Outcome measures were available for 81% of the subjects who contributed to the Mid Cingulate cluster.
Results suggested that infants with an earlier STD N2 response peak and/or a larger FDEV P3 peak amplitude for an IC in this cluster produced more words at 20 months-of-age (N2 latency: r = −.579, 95% CI [−0.827, −0.188], FCR adj CI [−0.891, −0.011], p = .015;P3 amplitude: r = .768, 95% CI [0.446, 0.941], FCR adj CI [0.256, 0.977], p < .001) (Fig. 6). Similar, correlations between vocabulary outcome and ERP measures were found in the scalp-channel data for electrode F6 (N2 latency: r = −.507, 95% CI [−0.837, −0.102], p = .006; P3 amplitude: r = .402; 95% CI [0.004, 0.701], p = .034), but they were statistically weaker and did not survive FCR adjustment for multiple comparison. No such relationships were found for channels F5 or Fz. Since, two subjects were outliers with respect to source-resolved P3 amplitude in the FDEV condition, the correlation between this variable and the LDS score was recalculated excluding these two subjects. The source-resolved results were confirmed, further attesting their reliability (P3 amplitude: r = .722, 95% CI [0.299, 0.963], adj 99% CI [0.035, 0.988], p = .002). No such predictive correlations were found for either source-resolved or scalp-channel DDEV responses.
Fig. 6.
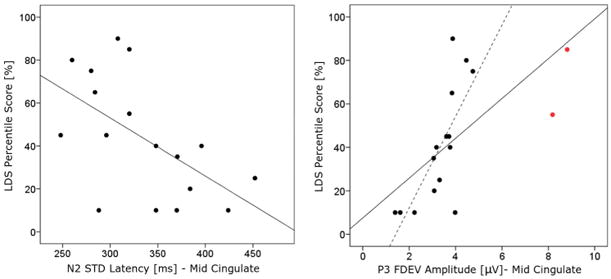
Significant Spearman product–moment correlations between 6-month ERP measures extracted from the Mid Cingulate cluster ICs and 20-month expressive language (LDS percentile scores) for the same subjects. Significant ERP predictors include: (left) STD N2 peak latency (shorter latencies are associated with better language scores); (right) FDEV P3 peak amplitude (higher amplitudes are associated with better language scores). Red points in the right panel are outliers in the FDEV P3 amplitude distribution. The same correlation between LDS percentile scores and DEVF P3 amplitude calculated excluding these points also gave significant result (continuous line total fit line, dotted line fit line with the exclusion of outliers).
The multiple regression model indicated that the two source-resolved ERP measures (STD N2 peak latency and FDEV P3 peak amplitude of the Mid Cingulate cluster) accounted for significant variance in the linguistic outcome (r2 adj = 0.510, F(2,16) = 9.32, p = .003). A significant but smaller amount of variance was also accounted for the two scalp-channel data measures for electrode F6 (r2 adj =0.377, F(2,27) = 9.16, p = .001).
Discussion
Increasing attention has been devoted to the study of central auditory processing in infancy as a research tool for better understanding the nature of language and cognitive development and correlated disorders. Nonetheless, auditory deviance discrimination mechanisms in infants are still not well understood. This study represents the first attempt to investigate these mechanisms in a group of typically developing infants using an EEG source decomposition approach based on ICA, considering both frequency and duration deviances and studying the relation between source-resolved ERPs and language development. Both acoustic features were embedded in a rapidly-presented (70-ms ISI) acoustic stimulus stream to test RAP abilities. The changes in fundamental frequency closely replicated previous paradigms (Benasich et al., 2006; Choudhury & Benasich, 2011), whereas the presented changes in sound duration represent a novel manipulation for this population.
Cortical generators of rapid auditory processing/discrimination
Previous infant MMR studies reported sources mainly located bilaterally close to the auditory cortex (Hämäläinen et al., 2011; Musacchia et al., 2013; Ortiz-Mantilla et al., 2012), sometimes with an additional activation in or near the anterior cingulate cortex (Hämäläinen et al., 2011; Ortiz-Mantilla et al., 2012). Similar results have been found in adult studies in which, using different neuroimaging techniques (e.g., fMRI, PET, and EEG), generators of the MMN have been reported to be broadly distributed across primary and secondary auditory cortices with some extra-auditory cortical activations (e.g. Belin et al., 2002; Jemel et al., 2002; Milner et al., 2014; Molholm et al., 2005; Rissling et al., 2014). Different activation pathways were also reported to be active depending on the deviant acoustic feature (e.g., Jemel et al., 2002; Molholm et al., 2005). Moreover some studies have reported a larger ADR contribution from right versus left hemisphere (e.g. Fulham et al., 2014; Liebenthal et al., 2003; Rissling et al., 2014).
The present study confirms and extends the results of previous works. As in both infant and adult studies, we found generators that contribute to both frequency and duration deviance responses, as well as to obligatory auditory responses, located close to auditory cortex (Transverse Temporal Gyrus cluster). This activation was most consistently present across subjects; the Transverse Temporal Gyrus cluster had the highest subject penetration (85.3%). As in previous infant studies (Hämäläinen et al., 2011; Musacchia et al., 2013; Ortiz-Mantilla et al., 2012) the auditory cortex involvement appeared to be strongly bilateral, with a slight larger contribution from the right hemisphere. About 45% of the ICs in this cluster had a bilaterally symmetrical scalp map and were thus modeled using two equivalent dipoles symmetrically located in the left and right hemispheres. Thus, these source activities may be generated by two physiologically (or functionally) coupled source patches.
Extra-auditory cortical activations were found mainly across the left cingulate cortex. In particular the posterior and mid portions of the cingulate cortex (Ventral Posterior Cingulate cluster, Dorsal Posterior Cingulate cluster and Mid Cingulate cluster) contributed to the responses of all types of stimuli and the Mid Cingulate cluster explained the greatest part of the scalp ERP variance. The cingulate cortex has been associated with cognitive functions such as attention, working memory and also conflict monitoring (Lin et al., 2015; Nyberg et al., 2003; Parvaz et al., 2014), all involved in auditory discrimination. This finding is in agreement with previous adult studies that have reported activation of the cingulate cortex in response to auditory deviance processing (Hämäläinen et al., 2011; Jemel et al., 2002; Rissling et al., 2014). The noteworthy contribution that the Mid Cingulate cluster provides to the overall ERP response could be related to the greater involvement of attentional and memory functions as part of auditory discrimination mechanisms for infants as compared to adults, who have already developed automated and thus non-attentive processing of auditory deviance. Moreover, the cingulate cortex receives input from the thalamus, which recent findings have shown to be highly involved in auditory deviance detection (Cacciaglia et al., 2015). Our exploratory results from a limited population sample restrict extensive interpretation. Further investigations are needed in order to better characterize the role of the cingulate cortex in infant auditory processing.
The present work also confirms that differing combinations of cortical sources can contribute to the ADR and therefore to cortical processing of different acoustic features. Among the five most highly contributing source clusters we identified for each stimulus type (STD, FDEV, DDEV) we found one distinct contributing cluster. Cortical sources in or near the middle occipital gyrus were bilaterally activated mainly in response to the FDEV, whereas the DDEV induced a more anterior response, activating cortical sources near the subgenual anterior cingulate. Molholm et al. (2005) conducted an fMRI study using a pitch and duration MMN paradigm in adults and reported several extra-auditory cortical activations related to the change-detection processes. Among these activations were the right middle occipital gyrus in response to pitch changes and the right anterior cingulate for duration deviance processing. A more anterior contribution involved in duration processing emerged also in a PET study (Belin et al., 2002), which analyzed the neuroanatomical substrate of sound duration discrimination, identifying a network specifically related to duration processing that involved right prefrontal cortex. In agreement with these studies in older populations, we found similar cortical sources and a slightly larger contribution of the right hemisphere to the duration deviant ADR. Finally, our results showed bilateral involvement of the cortex near the somatosensory area (Postcentral Gyrus cluster) in processing the STD stimuli. This cortical source has not been commonly reported in studies that investigated auditory discrimination processing. Nevertheless, Thaut et al. (2014) demonstrated that somatosensory cortex is involved in the processing of rhythm. This is also supported by the “action simulation for auditory prediction” (ASAP) hypothesis, formulated by Patel and Iversen (2014), that suggests connections between auditory and motor-planning cortical regions. In the present study the Postcentral Gyrus cluster contributed only to the STD response and taking into account these prior findings, we can speculate that the somato-sensory cortical generators were specifically involved in processing the rhythm produced by repeating STD stimuli in this rapid oddball paradigm.
It should be noted that the precise source locations reported here should be regarded with some caution. Although we used a realistic four-layer head model, allowing a more accurate estimation of source locations than simpler geometric (e.g., spherical or spheroidal models) and three-layer head models, our results suffer from necessary inaccuracies related to the unavailability of subject-specific head models based on subject MR images, and to the fact that MNI image-derived models are truncated below the brain (Acar & Makeig, 2013). Another source of error that may likely have affected our results is skull conductivity estimation. We selected the conductivity value used in the age-specific template electrical head model from the available literature (brain-to-skull conductivity ratio, 5.7), but we know that it varies from person to person and across developmental changes (Hoekema et al., 2003). Some individual IC equivalent dipoles seemed to be improbably deeply localized; this effect could be related to the use of an imprecise skull conductivity value, since Akalin Acar and Makeig (2013) showed that increasing the assumed brain-to-skull conductivity ratio moves estimated dipole locations outwards. Another important factor not included in our head model is the likelihood of differing conductivity values for the fontanelles, which may not yet be calcified at six months of age. Moreover, it should be noted that the clustering method we used have some limitations, first of all the fact that it depends on the measure subset used as clustering criteria. Many different clustering solutions can be produced by changing the measure subset. Thus, IC clustering has no single correct solution and interpreting results needs caution.
Finally, we think it is important to point out that, since few studies have investigated cortical substrates of auditory deviance processing in infancy, the functional interpretations to source clusters we suggested above are mainly based on previous adult studies. As the infant brain is under rapid development, with maturational changes taking place both in brain structure and function, we cannot be sure of the correspondence between the roles played by particular brain regions in adults and infants. This work thus represents a promising first step toward inferring more information about evolving infant cognitive processes across brain maturation from readily and non-invasively obtained ERP data.
Source resolved ERP and outcome measures
Overall, our auditory deviance response results for a cohort of typically developing 6-month-old infants show the expected electrophysiological pattern: the ‘obligatory’ response peaks (P1, N2) followed by a large positive response (P3) (Ceponiene et al., 2002; Kushnerenko et al., 2002a; Choudhury & Benasich, 2011). This ERP morphology is evident both in scalp channel and source-resolved data, especially for source ERPs generated by sources in source clusters contributing to responses to all stimulus types.
Visual inspection of response waveforms as well as ERP peak measures indicate that both acoustic features are easily discriminable to infants at this early age (e.g., Aslin, 1989; Kushnerenko et al., 2001). The difference, here, between FDEV and DDEV response P3 peak latencies corresponded to the difference in the within-stimulus latencies at which these acoustic differences were first present. Other differences in frequency-deviant and duration-deviant ADR morphologies, amplitudes, and source distributions indicate that frequency and duration deviances are probably processed in distinguishable and perhaps discrete cortical networks in 6-month-old infants (Cantiani et al., in press). We also noted marked inter-subject variability in ERP responses at the source level, possibly arising from inter-subject developmental differences in brain and head structures.
The study of the largest contributing source clusters revealed that at least four cortical generator areas participated in the processing of all three types of auditory stimuli. The Mid Cingulate cluster provided a markedly larger contribution to the infant scalp-recorded ERPs than other source cluster areas. This is in agreement with previous literature (discussed above) pointing to the involvement of the cingulate cortex in rapid auditory discrimination. During stimulus delivery, the infants were entertained by silent movies and as needed with quiet toys shown to the infant by a researcher within the testing booth. However, we could not control the amount of attention they paid to the presented sounds. A recent study on the role of attention in RAP (Choudhury et al., 2015) showed an enhancement of the early MMN response in both adults and children when they were asked to “attend” to versus “ignore” the sound stimuli. Thus the large variation in response strengths produced by the Mid Cingulate cluster might reflect differences in the infants' degree of auditory attention.
The role of rapid auditory processing and discrimination in language acquisition and development was assessed measuring expressive language (number of words used via parental report) at 20 months, a reliable measure of linguistic outcome (Lee et al., 2011). Our results confirm the predictive value of RAP ERP analysis for language development. In particular, consistent correlations with later (20-months) vocabulary size were found for the Mid Cingulate cluster N2 response peak latency and for the amplitude of the FDEV P3, suggesting that more robust non-linguistic rapid auditory detection and stronger sensitivity to frequency differences may boost subsequent language development in line with previous cross-linguistic findings (Benasich et al., 2006; Choudhury & Benasich, 2011; Guttorm et al., 2005; van Zuijen et al., 2012; Cantiani et al., in press). This is the first time that the impact of source-resolved ERPs on language development has been investigated. We think it is particularly relevant that statistically robust correlations emerged between the linguistic outcome at 20 months and the ADR response generated by the cortical source area that seems to be most involved in RAP. Moreover, the outcome prediction was stronger and withstood correction for multiple comparisons only for source-resolved ERP measures but not for ERP measures extracted from the supervening scalp-channel signals, thus showing the utility of ICA approach for identifying and interpreting neurophysiological biomarkers. No correlations were found between subsequent (20-months) language ability and ERP measure in responses to longer (duration deviant) stimuli. In Italian, however, sound duration is an essential cue for a specific complex phenomenon, “consonant germination.” Differences in the discrimination of this acoustic feature, reflected in 6-month source-resolved ADR, might therefore become increasingly relevant to subject differences in later phases of linguistic development.
Conclusion
The present work shows the feasibility and the potential value of ICA decomposition for analysis of EEG/ERP infant data. Here we used a source separation procedure applied to the whole EEG signals to identify contributions of cortical IC source areas underlying rapid auditory processing and deviance discrimination in infancy. Although at the present time there is still little knowledge of what brain source activities the infant auditory ERPs reflect, our results are consistent with previous infant and adult cortical source localization reports. This supports the validity of the method we used and of the functional information it produced. Moreover, statistically robust predictions of early language development were derived from the source-resolved ERP responses generated in or near mid-cingulate cortex. Not unexpectedly, the outcome prediction was stronger for source-resolved ERP measures than for ERP measures for the coincident (but highly mixed) scalp-channel signals. EEG-based source imaging can thus provide fine temporal and increasingly better spatial localization of cortical brain dynamics supporting cognitive processes, and therefore represents a promising approach for the study of typical and atypical infant brain function.
Supplementary Material
Acknowledgments
The authors wish to thank the nursing and clinician staff of the Department of Gynecology & Obstetrics of the Manzoni Hospital of Lecco and of the Hospital of Desio and Vimercate. Many thanks to Valentina Riva and Roberta Bettoni for their invaluable help in recruitment and data collection and to all infants and their parents participating in this study. The research was supported by Grant RC2013 from the Italian Ministry of Health, by Fondazione della Provincia di Lecco Onlus/Rotary Club (Rotary Club Lecco, Rotary Club Le Grigne, Rotary Club Manzoni). Contributions from ZA, MM, and SM were supported by gifts from The Swartz Foundation (Old Field, NY) and from an anonymous benefactor.
Footnotes
Appendix A. Supplementary data: Supplementary data to this article can be found online at http://dx.doi.org/10.1016/j.neuroimage.2016.02.060.
References
- Acar ZA, Makeig S. Neuroelectromagnetic forward head modeling toolbox. J Neurosci Methods. 2010;190(2):258–270. doi: 10.1016/j.jneumeth.2010.04.031. http://dx.doi.org/10.1016/j.jneumeth.2010.04.031. [DOI] [PMC free article] [PubMed] [Google Scholar]
- Acar ZA, Makeig S. Effects of forward model errors on EEG source localization. Brain Topogr. 2013;26(3):378–396. doi: 10.1007/s10548-012-0274-6. http://dx.doi.org/10.1007/s10548-012-0274-6. [DOI] [PMC free article] [PubMed] [Google Scholar]
- Aslin RN. Discrimination of frequency transitions by human infants. J Acoust Soc Am. 1989;86(2):582–590. doi: 10.1121/1.398237. http://dx.doi.org/10.1121/1.398237. [DOI] [PubMed] [Google Scholar]
- Bayley N. Bayley Scales of Infant Development: Manual. Psychological Corporation; 1993. [Google Scholar]
- Belin P, McAdams S, Thivard L, Smith B, Savel S, Zilbovicius M, Samson S, Samson Y. The neuroanatomical substrate of sound duration discrimination. Neuropsychologia. 2002;40(12):1956–1964. doi: 10.1016/s0028-3932(02)00062-3. doi:S0028393202000623. [DOI] [PubMed] [Google Scholar]
- Benasich AA, Thomas JJ, Choudhury N, Leppänen PH. The importance of rapid auditory processing abilities to early language development: evidence from converging methodologies. Dev Psychobiol. 2002;40(3):278–292. doi: 10.1002/dev.10032. http://dx.doi.org/10.1002/dev.10032. [DOI] [PMC free article] [PubMed] [Google Scholar]
- Benasich AA, Choudhury N, Friedman JT, Realpe-Bonilla T, Chojnowska C, Gou Z. The infant as a prelinguistic model for language learning impairments: predicting from event-related potentials to behavior. Neuropsychologia. 2006;44(3):396–411. doi: 10.1016/j.neuropsychologia.2005.06.004. doi:S0028-3932(05)00212–5. [DOI] [PMC free article] [PubMed] [Google Scholar]
- Benjamini Y, Yekutieli D. False discovery rate-adjusted multiple confidence intervals for selected parameters. J Am Stat Assoc. 2005;100(469):71–81. http://dx.doi.org/10.1198/016214504000001907. [Google Scholar]
- Cacciaglia R, Escera C, Slabu L, Grimm S, Sanjuán A, Ventura-Campos N, Ávila C. Involvement of the human midbrain and thalamus in auditory deviance detection. Neuropsychologia. 2015;68:51–58. doi: 10.1016/j.neuropsychologia.2015.01.001. http://dx.doi.org/10.1016/j.neuropsychologia.2015.01.001. [DOI] [PubMed] [Google Scholar]
- Cantiani C, Riva V, Piazza C, Bettoni R, Molteni M, Choudhury N, Marino C, Benasich AA. Auditory discrimination predicts linguistic outcome in Italian infants with and without familial risk for language learning impairment. Dev Cogn Neurosci. 2016 doi: 10.1016/j.dcn.2016.03.002. http://dx.doi.org/10.1016/j.dcn.2016.03.002 (in press) [DOI] [PMC free article] [PubMed]
- Ceponiene R, Rinne T, Näätänen R. Maturation of cortical sound processing as indexed by event-related potentials. Clin Neurophysiol. 2002;113(6):870–882. doi: 10.1016/s1388-2457(02)00078-0. doi:S1388245702000780. [DOI] [PubMed] [Google Scholar]
- Ceponiene R, Torki M, Alku P, Koyama A, Townsend J. Event-related potentials reflect spectral differences in speech and non-speech stimuli in children and adults. Clin Neurophysiol. 2008;119(7):1560–1577. doi: 10.1016/j.clinph.2008.03.005. http://dx.doi.org/10.1016/j.clinph.2008.03.005. [DOI] [PMC free article] [PubMed] [Google Scholar]
- Choudhury N, Benasich AA. Maturation of auditory evoked potentials from 6 to 48 months: prediction to 3 and 4 year language and cognitive abilities. Clin Neurophysiol. 2011;122(2):320–338. doi: 10.1016/j.clinph.2010.05.035. http://dx.doi.org/10.1016/j.clinph.2010.05.035. [DOI] [PubMed] [Google Scholar]
- Choudhury NA, Parascando JA, Benasich AA. Effects of presentation rate and attention on auditory discrimination: a comparison of long-latency auditory evoked potentials in school-aged children and adults. PLoS One. 2015;10(9):e0138160. doi: 10.1371/journal.pone.0138160. http://dx.doi.org/10.1371/journal.pone.0138160. [DOI] [PMC free article] [PubMed] [Google Scholar]
- Dehaene-Lambertz G, Baillet S. A phonological representation in the infant brain. Neuroreport. 1998;9(8):1885–1888. doi: 10.1097/00001756-199806010-00040. [DOI] [PubMed] [Google Scholar]
- Delorme A, Makeig S. EEGLAB: an open source toolbox for analysis of single-trial EEG dynamics including independent component analysis. J Neurosci Methods. 2004;134(1):9–21. doi: 10.1016/j.jneumeth.2003.10.009. http://dx.doi.org/10.1016/j.jneumeth.2003.10.009. [DOI] [PubMed] [Google Scholar]
- Delorme A, Sejnowski T, Makeig S. Enhanced detection of artifacts in EEG data using higher-order statistics and independent component analysis. NeuroImage. 2007;34(4):1443–1449. doi: 10.1016/j.neuroimage.2006.11.004. doi:S1053-8119(06)01109–8. [DOI] [PMC free article] [PubMed] [Google Scholar]
- Delorme A, Palmer J, Onton J, Oostenveld R, Makeig S. Independent EEG sources are dipolar. PLoS One. 2012;7(2):e30135. doi: 10.1371/journal.pone.0030135. http://dx.doi.org/10.1371/journal.pone.0030135. [DOI] [PMC free article] [PubMed] [Google Scholar]
- Field A. Sage. Discovering Statistics Using IBM: SPSS; 2013. Statistics. [Google Scholar]
- Fulham WR, Michie PT, Ward PB, Rasser PE, Todd J, Johnston PJ, et al. Schall U. Mismatch negativity in recent-onset and chronic schizophrenia: a current source density analysis. PLoS One. 2014;9(6):e100221. doi: 10.1371/journal.pone.0100221. http://dx.doi.org/10.1371/journal.pone.0100221. [DOI] [PMC free article] [PubMed] [Google Scholar]
- Groppe DM. Combating the scientific decline effect with confidence (intervals) Biorxiv. 2015;034074 doi: 10.1111/psyp.12616. http://dx.doi.org/10.1101/034074. [DOI] [PubMed] [Google Scholar]
- Guttorm TK, Leppänen PH, Poikkeus AM, Eklund KM, Lyytinen P, Lyytinen H. Brain event-related potentials (ERPs) measured at birth predict later language development in children with and without familial risk for dyslexia. Cortex. 2005;41(3):291–303. doi: 10.1016/s0010-9452(08)70267-3. http://dx.doi.org/10.1016/S0010-9452(08)70267-3. [DOI] [PubMed] [Google Scholar]
- Hämäläinen JA, Ortiz-Mantilla S, Benasich AA. Source localization of event-related potentials to pitch change mapped onto age-appropriate MRIs at 6 months of age. NeuroImage. 2011;54(3):1910–1918. doi: 10.1016/j.neuroimage.2010.10.016. http://dx.doi.org/10.1016/j.neuroimage.2010.10.016. [DOI] [PubMed] [Google Scholar]
- Hoekema R, Wieneke GH, Leijten FS, van Veelen CW, van Rijen PC, Huiskamp GJ, et al. van Huffelen AC. Measurement of the conductivity of skull, temporarily removed during epilepsy surgery. Brain Topogr. 2003;16(1):29–38. doi: 10.1023/a:1025606415858. http://dx.doi.org/10.1023/A:1025606415858. [DOI] [PubMed] [Google Scholar]
- Jemel B, Achenbach C, Muller BW, Ropcke B, Oades RD. Mismatch negativity results from bilateral asymmetric dipole sources in the frontal and temporal lobes. Brain Topogr. 2002;15(1):13–27. doi: 10.1023/a:1019944805499. http://dx.doi.org/10.1023/A:1019944805499. [DOI] [PubMed] [Google Scholar]
- Johnson MH, de Haan M, Oliver A, Smith W, Hatzakis H, Tucker LA, Csibra G. Recording and analyzing high-density event-related potentials with infants. using the geodesic sensor net Dev Neuropsychol. 2001;19(3):295–323. doi: 10.1207/S15326942DN1903_4. http://dx.doi.org/10.1207/S15326942DN1903_4. [DOI] [PubMed] [Google Scholar]
- Kuhl PK. Early language acquisition: cracking the speech code. Nat Rev Neurosci. 2004;5(11):831–843. doi: 10.1038/nrn1533. doi:nrn1533. [DOI] [PubMed] [Google Scholar]
- Kushnerenko E, Cheour M, Ceponiene R, Fellman V, Renlund M, Soininen K, et al. Näätänen R. Central auditory processing of durational changes in complex speech patterns by newborns: an event-related brain potential study. Dev Neuropsychol. 2001;19(1):83–97. doi: 10.1207/S15326942DN1901_6. http://dx.doi.org/10.1207/S15326942DN1901_6. [DOI] [PubMed] [Google Scholar]
- Kushnerenko E, Ceponiene R, Balan P, Fellman V, Näätänen R. Maturation of the auditory change detection response in infants: a longitudinal ERP study. Neuroreport. 2002a;13(15):1843–1848. doi: 10.1097/00001756-200210280-00002. http://dx.doi.org/10.1097/00001756-200210280-00002. [DOI] [PubMed] [Google Scholar]
- Kushnerenko E, Ceponiene R, Balan P, Fellman V, Huotilaine M, Naatane R. Maturation of the auditory event-related potentials during the first year of life. Neuroreport. 2002b;13(1):47–51. doi: 10.1097/00001756-200201210-00014. http://dx.doi.org/10.1097/00001756-200201210-00014. [DOI] [PubMed] [Google Scholar]
- Lancaster JL, Woldorff MG, Parsons LM, Liotti M, Freitas CS, Rainey L, et al. Fox PT. Automated talairach atlas labels for functional brain mapping. Hum Brain Mapp. 2000;10(3):120–131. doi: 10.1002/1097-0193(200007)10:3<120::AID-HBM30>3.0.CO;2-8. http://dx.doi.org/10.1002/1097-0193(200007)10:3b120∷AID-HBM30N3.0.CO;2-8. [DOI] [PMC free article] [PubMed] [Google Scholar]
- Lee ES, Yeatman JD, Luna B, Feldman HM. Specific language and reading skills in school-aged children and adolescents are associated with prematurity after controlling for IQ. Neuropsychologia. 2011;49(5):906–913. doi: 10.1016/j.neuropsychologia.2010.12.038. http://dx.doi.org/10.1016/j.neuropsychologia.2010.12.038. [DOI] [PMC free article] [PubMed] [Google Scholar]
- Lenartowicz A, Delorme A, Walshaw PD, Cho AL, Bilder RM, McGough JJ, et al. Loo SK. Electroencephalography correlates of spatial working memory deficits in attention-deficit/hyperactivity disorder: vigilance, encoding, and maintenance. J Neurosci. 2014;34(4):1171–1182. doi: 10.1523/JNEUROSCI.1765-13.2014. http://dx.doi.org/10.1523/JNEUROSCI.1765-13.2014. [DOI] [PMC free article] [PubMed] [Google Scholar]
- Leppänen PH, Hämäläinen JA, Salminen HK, Eklund KM, Guttorm TK, Lohvansuu K, et al. Lyytinen H. Newborn brain event-related potentials revealing atypical processing of sound frequency and the subsequent association with later literacy skills in children with familial dyslexia. Cortex. 2010;46(10):1362–1376. doi: 10.1016/j.cortex.2010.06.003. http://dx.doi.org/10.1016/j.cortex.2010.06.003. [DOI] [PubMed] [Google Scholar]
- Liebenthal E, Ellingson ML, Spanaki MV, Prieto TE, Ropella KM, Binder JR. Simultaneous ERP and fMRI of the auditory cortex in a passive oddball paradigm. NeuroImage. 2003;19(4):1395–1404. doi: 10.1016/s1053-8119(03)00228-3. doi:S1053811903002283. [DOI] [PubMed] [Google Scholar]
- Lin P, Yang Y, Jovicich J, De Pisapia N, Wang X, Zuo CS, Levitt JJ. Static and dynamic posterior cingulate cortex nodal topology of default mode network predicts attention task performance. Brain Imaging and Behav. 2015 doi: 10.1007/s11682-015-9384-6. http://dx.doi.org/10.1007/s11682-015-9384-6. [DOI] [PubMed]
- Loo SK, Lenartowicz A, Makeig S. Research review: use of EEG biomarkers in child psychiatry research — current state and future directions. J Child Psychol Psychiatry. 2015 doi: 10.1111/jcpp.12435. http://dx.doi.org/10.1111/jcpp.12435. [DOI] [PMC free article] [PubMed]
- Makeig S, Onton J. Oxford Handbook of Event-Related Potential Components. Oxford; New York, NY: 2009. ERP features and EEG dynamics: an ICA perspective. http://dx.doi.org/10.1093/oxfordhb/9780195374148.013.0035. [Google Scholar]
- Makeig S, Bell AJ, Jung T, Sejnowski TJ. Independent component analysis of electroencephalographic data. Adv Neural Inf Process Syst. 1996:145–151. [Google Scholar]
- Makeig S, Westerfield M, Jung TP, Enghoff S, Townsend J, Courchesne E, Sejnowski TJ. Dynamic brain sources of visual evoked responses. Science (New York, NY) 2002;295(5555):690–694. doi: 10.1126/science.1066168. http://dx.doi.org/10.1126/science.1066168. [DOI] [PubMed] [Google Scholar]
- Makeig S, Debener S, Onton J, Delorme A. Mining event-related brain dynamics. Trends Cogn Sci. 2004;8(5):204–210. doi: 10.1016/j.tics.2004.03.008. http://dx.doi.org/10.1016/j.tics.2004.03.008. [DOI] [PubMed] [Google Scholar]
- Milner R, Rusiniak M, Lewandowska M, Wolak T, Ganc M, Piatkowska-Janko E, et al. Skarzynski H. Towards neural correlates of auditory stimulus processing: a simultaneous auditory evoked potentials and functional magnetic resonance study using an odd-ball paradigm. Med Sci Monit. 2014;20:35–46. doi: 10.12659/MSM.889712. http://dx.doi.org/10.12659/MSM.889712. [DOI] [PMC free article] [PubMed] [Google Scholar]
- Molholm S, Martinez A, Ritter W, Javitt DC, Foxe JJ. The neural circuitry of pre-attentive auditory change-detection: an fMRI study of pitch and duration mismatch negativity generators. Cereb Cortex. 2005;15(5):545–551. doi: 10.1093/cercor/bhh155. http://dx.doi.org/10.1093/cercor/bhh155. [DOI] [PubMed] [Google Scholar]
- Musacchia G, Choudhury NA, Ortiz-Mantilla S, Realpe-Bonilla T, Roesler CP, Benasich AA. Oscillatory support for rapid frequency change processing in infants. Neuropsychologia. 2013;51(13):2812–2824. doi: 10.1016/j.neuropsychologia.2013.09.006. http://dx.doi.org/10.1016/j.neuropsychologia.2013.09.006. [DOI] [PubMed] [Google Scholar]
- Näätänen R, Sussman ES, Salisbury D, Shafer VL. Mismatch negativity (MMN) as an index of cognitive dysfunction. Brain Topogr. 2014;27(4):451–466. doi: 10.1007/s10548-014-0374-6. http://dx.doi.org/10.1007/s10548-014-0374-6. [DOI] [PMC free article] [PubMed] [Google Scholar]
- Nyberg L, Marklund P, Persson J, Cabeza R, Forkstam C, Petersson KM, Ingvar M. Common prefrontal activations during working memory, episodic memory, and semantic memory. Neuropsychologia. 2003;41(3):371–377. doi: 10.1016/s0028-3932(02)00168-9. doi:S0028393202001689. [DOI] [PubMed] [Google Scholar]
- Oostenveld R, Fries P, Maris E, Schoffelen JM. FieldTrip: open source software for advanced analysis of MEG, EEG, and invasive electrophysiological data. Comput Intell Neurosci. 2011;2011:156869. doi: 10.1155/2011/156869. http://dx.doi.org/10.1155/2011/156869. [DOI] [PMC free article] [PubMed] [Google Scholar]
- Ortiz-Mantilla S, Hämäläinen JA, Benasich AA. Time course of ERP generators to syllables in infants: a source localization study using age-appropriate brain templates. NeuroImage. 2012;59(4):3275–3287. doi: 10.1016/j.neuroimage.2011.11.048. http://dx.doi.org/10.1016/j.neuroimage.2011.11.048. [DOI] [PubMed] [Google Scholar]
- Ortiz-Mantilla S, Hämäläinen JA, Musacchia G, Benasich AA. Enhancement of gamma oscillations indicates preferential processing of native over foreign phonemic contrasts in infants. J Neurosci. 2013;33(48):18746–18754. doi: 10.1523/JNEUROSCI.3260-13.2013. http://dx.doi.org/10.1523/JNEUROSCI.3260-13.2013. [DOI] [PMC free article] [PubMed] [Google Scholar]
- Palmer JA, Kreutz-Delgado K, Makeig S. Independent Component Analysis and Blind Signal Separation. Springer; 2006. Super-gaussian mixture source model for ICA; pp. 854–861. http://dx.doi.org/10.1007/11679363_106. [Google Scholar]
- Palmer JA, Makeig S, Kreutz-Delgado K, Rao BD. Newton method for the ICA mixture model. Icassp. 2008:1805–1808. http://dx.doi.org/10.1109/ICASSP.2008.4517982.
- Parvaz MA, Maloney T, Moeller SJ, Malaker P, Konova AB, Alia-Klein N, Goldstein RZ. Multimodal evidence of regional midcingulate gray matter volume underlying conflict monitoring. NeuroImage Clin. 2014;5:10–18. doi: 10.1016/j.nicl.2014.05.011. http://dx.doi.org/10.1016/j.nicl.2014.05.011. [DOI] [PMC free article] [PubMed] [Google Scholar]
- Patel AD, Iversen JR. The evolutionary neuroscience of musical beat perception: the action simulation for auditory prediction (ASAP) hypothesis. Front Syst Neurosci. 2014;8:57. doi: 10.3389/fnsys.2014.00057. http://dx.doi.org/10.3389/fnsys.2014.00057. [DOI] [PMC free article] [PubMed] [Google Scholar]
- Rescorla L, Alley A. Validation of the language development survey (LDS): a parent report tool for identifying language delay in toddlers. J Speech Lang Hear Res. 2001;44(2):434–445. doi: 10.1044/1092-4388(2001/035). http://dx.doi.org/10.1044/1092-4388(2001/035) [DOI] [PubMed] [Google Scholar]
- Rescorla L, Frigerio A, Sali ME, Spataro P, Longobardi E. Typical and delayed lexical development in Italian. J Speech Lang Hear Res. 2014;57(5):1792–1803. doi: 10.1044/2014_JSLHR-L-13-0242. http://dx.doi.org/10.1044/2014_JSLHR-L-13-0242. [DOI] [PubMed] [Google Scholar]
- Reynolds GD, Richards JE. Familiarization, attention, and recognition memory in infancy: an event-related potential and cortical source localization study. Dev Psychol. 2005;41(4):598–615. doi: 10.1037/0012-1649.41.4.598. doi:2005–08221-002. [DOI] [PMC free article] [PubMed] [Google Scholar]
- Reynolds GD, Richards JE. Cortical source localization of infant cognition. Dev Neuropsychol. 2009;34(3):312–329. doi: 10.1080/87565640902801890. http://dx.doi.org/10.1080/87565640902801890. [DOI] [PMC free article] [PubMed] [Google Scholar]
- Reynolds GD, Courage ML, Richards JE. Infant attention and visual preferences: converging evidence from behavior, event-related potentials, and cortical source localization. Dev Psychol. 2010;46(4):886–904. doi: 10.1037/a0019670. http://dx.doi.org/10.1037/a0019670. [DOI] [PMC free article] [PubMed] [Google Scholar]
- Rissling AJ, Miyakoshi M, Sugar CA, Braff DL, Makeig S, Light GA. Cortical substrates and functional correlates of auditory deviance processing deficits in schizophrenia. NeuroImage Clin. 2014;6:424–437. doi: 10.1016/j.nicl.2014.09.006. http://dx.doi.org/10.1016/j.nicl.2014.09.006. [DOI] [PMC free article] [PubMed] [Google Scholar]
- Tallal P, Piercy M. Defects of Non-verbal Auditory Perception in Children With Developmental Aphasia. 1973 doi: 10.1038/241468a0. http://dx.doi.org/10.1038/241468a0. [DOI] [PubMed]
- Thaut MH, Trimarchi PD, Parsons LM. Human brain basis of musical rhythm perception: common and distinct neural substrates for meter, tempo, and pattern. Brain Sci. 2014;4(2):428–452. doi: 10.3390/brainsci4020428. http://dx.doi.org/10.3390/brainsci4020428. [DOI] [PMC free article] [PubMed] [Google Scholar]
- van Zuijen TL, Plakas A, Maassen BA, Been P, Maurits NM, Krikhaar E, et al. van der Leij A. Temporal auditory processing at 17 months of age is associated with preliterate language comprehension and later word reading fluency: an ERP study. Neurosci Lett. 2012;528(1):31–35. doi: 10.1016/j.neulet.2012.08.058. http://dx.doi.org/10.1016/j.neulet.2012.08.058. [DOI] [PubMed] [Google Scholar]
- Wolters CH, Kuhn M, Anwander A, Reitzinger S. A parallel algebraic multigrid solver for finite element method based source localization in the human brain. Comput Vis Sci. 2002;5(3):165–177. http://dx.doi.org/10.1007/s00791-002-0098-0. [Google Scholar]
Associated Data
This section collects any data citations, data availability statements, or supplementary materials included in this article.