

Abstract
The implementation of engineered surfaces presenting micrometer-sized patterns of cell adhesive ligands against a biologically inert background has led to numerous discoveries in fundamental cell biology. While existing surface patterning strategies allow for pattering of a single ligand it is still challenging to fabricate surfaces displaying multiple patterned ligands. To address this issue we implemented Laser Scanning Lithography (LSL), a laser-based thermal desorption technique, to fabricate multifaceted, micropatterned surfaces that display independent arrays of subcellular-sized patterns of multiple adhesive ligands with each ligand confined to its own array. We demonstrate that LSL is a highly versatile “maskless” surface patterning strategy that provides the ability to create patterns with features ranging from 450 nm to 100 μm, topography ranging from -1 to 17 nm, and to fabricate both stepwise and smooth ligand surface density gradients. As validation for their use in cell studies, surfaces presenting orthogonally interwoven arrays of 1×8 μm elliptical patterns of Gly-Arg-Gly-Asp-terminated alkanethiol self-assembled monolayers and human plasma fibronectin are produced. Human umbilical vein endothelial cells cultured on these multifaceted surfaces form adhesion sites to both ligands simultaneously and utilize both ligands for lamella formation during migration. The ability to create multifaceted, patterned surfaces with tight control over pattern size, spacing, and topography provides a platform to simultaneously investigate the complex interactions of extracellular matrix geometry, biochemistry, and topography on cell adhesion and downstream cell behavior.
Keywords: Laser Scanning Lithography, Micropatterning, Cell Adhesion, Cell Migration, Multifaceted Surfaces
TOC image
A laser-based patterning strategy for the fabrication of multifaceted, micropatterned surfaces that display patterned arrays of multiple cell adhesive ligands with each ligand confined to its own array is presented. Cells cultured on these surfaces display concurrent adhesion to both ligands simultaneously and utilize both ligands for lamella formation during migration.

1. Introduction
Surfaces displaying patterned arrays of an immobilized biomolecule against an inert background show much promise for use as model substrates to investigate cell-surface interactions[1, 2] and as platforms for biosensors[2]. Self-assembled monolayers (SAMs) of alkanethiols on gold (Au) are often implemented in the fabrication of patterned surfaces due to their high tailorability of terminal group functionality. A diverse range of biomolecules including oligonucleotides,[3] peptides,[4] and full proteins[5] have been immobilized with alkanethiol SAMs either through directed adsorption[5] or terminal end tethering using specific coupling chemistries[6]. Implementation of patterned SAM surfaces that restrict the extent of cell spreading or that regulate cytoskeletal tension has led to a number of discoveries including the ability to prevent down regulation of cell function in culture,[7] to direct lineage-specific stem cell differentiation,[8, 9] and to manipulate cell motility[10]. An analogous approach to regulate the extent of cytoskeletal tension generation is through engineering cell adhesion site geometry with respect to adhesion site shape, size, or spacing. Geometric regulation of adhesion sites has been used to induce directional cell motility,[11, 12] to direct the organization of intracellular components,[13] and to induce cellular differentiation[14]. These examples demonstrate the importance of intracellular force generation on cell function but neglect the influence of chemical cues (matrix composition) on cell behavior.
The extracellular matrix (ECM) is made up of many proteins and polysaccharides[15] and integrin-mediated adhesion to individual components can influence intracellular signaling cascades governed by adhesion site plaques that dictate cell behavior.[16] For example, capillary morphogenesis of endothelial cells is observed in cells cultured on collagen I but not in cells on laminin, indicating matrix-specific guidance of cell behavior.[17] A better understanding of how ECM composition influences cell fate could be formed with model substrates that allow for control over both intracellular force generation and the composition of cellular adhesions through use of multiple ligands. While it is fairly straightforward to create surfaces displaying patterned arrays of a single ligand using existing technologies (e.g. microcontact printing), the fabrication of multifaceted surfaces that present patterned arrays of multiple ligands with each ligand confined to its own array is still quite challenging.
Toward this goal a few strategies to create multifaceted surfaces have been developed. Variations of microcontact printing including microfluidic inking of PDMS stamps and multilevel stamps have been used to pattern multiple proteins on a single surface [18–20] or for patterning cells[19, 20]. Microcontact printing of Arg-Gly-Asp-terminated (RGD) SAMs containing electroactive moieties provided a method for cell patterning through site-selective alkanethiol release via an applied potential.[21] Light-based techniques that rely on photochemical reactions have also been developed.[22, 23] Alignment of three distinct alkanethiol SAMs was achieved using alkanethiols sensitive to specific wavelengths of light in which Au-S scission occurred at 220 nm and cleavage of an o-nitrobenzyl amine-protecting group at 365 nm.[22] Light-activated affinity micropatterning was implemented to reveal a caged biotin upon exposure to ultraviolet light thereby allowing for immobilization of biotinylated antibodies in patterned arrays.[23] While all of the aforementioned patterning strategies allow for high resolution patterning,[24] they have not been implemented to create multifaceted surfaces that display sub-cellular sized arrays of multiple ligands in close proximity due to various limitations associated with each technique. Furthermore, all of these techniques require the fabrication of photolithographic masters to mold a PDMS stamp or to act as a photomask for spatially defined photochemical patterning. Any change in pattern design requires fabrication of a new master.
To circumvent the need for clean room facilities and to provide flexibility in pattern design with little lead time, a few maskless patterning strategies have been developed to create multifaceted surfaces. Dip-pen nanolithography was used to write multiple thiol derivatized oligonucleotides on Au surfaces for the fabrication of DNA sensors.[25] Doyle et al developed microphotopatterning, a technique based on photolytic ablation of poly(vinyl alcohol) tethered from silane SAMs to create surfaces displaying multiple patterned proteins.[10] Although the ability to create multifaceted surfaces was demonstrated no cell data using these surfaces has been presented.[10]
Here, we describe the implementation of Laser Scanning Lithography (LSL) for the fabrication of multifaceted surfaces that present two distinct cell adhesive ligands in patterned arrays against a biologically inert background. Laser induced thermal desorption of an alkanethiol SAM was first introduced in 1993 for the fabrication of mixed thiol SAMs.[26] Since then it has been refined and used to fabricate surfaces presenting two alkanethiol SAMs with different wettabilities[27, 28], to pattern chemical gradients of two SAMs[29], and to pattern three different SAMs in close proximity on a single surface[30]. In general, the technique involves functionalizing a Au surface with an alkanethiol SAM of choice. A focused laser beam is used to remove desired patterns of the SAM through thermally induced alkanethiol desorption. The laser energy absorbed by the Au film is released as heat thereby inducing a highly localized increase in surface temperature. At 212 °C the SAM is desorbed from the surface via disulfide bond formation between adjacent thiols[27] and the bare Au patterns are backfilled with a second alkanethiol of choice. Successive cycles of the process can be used to pattern multiple alkanethiol SAMs in close proximity with high spatial resolution on a single surface.
Here we demonstrate the use of LSL to created multifaceted, patterned surfaces that display arrays of subcellular-sized patterns of two cell adhesive ligands; human plasma fibronectin (HFN) and the integrin ligating peptide RGD derived from FN. We show that thermally-induced alkanethiol SAM desorption occurs through Au-S scission, pattern size can be finely tuned through careful manipulation of the laser and substrate properties, patterns with controlled nanotopography can be created, patterns as small as 450 nm (0.17 μm2) can be created, sub-diffraction limited patterning is possible, and cells cultured on multifaceted surfaces displaying interwoven patterns of a GRGD-terminated SAM and HFN bind concurrently to the two adhesive ligands and utilize both patterned ligands during migration.
2. Results and Discussion
2.1 Fabrication of Multifaceted Surfaces with LSL
The LSL fabrication process is schematically outlined in Fig. 1A. A Au coated glass coverslip is functionalized with an alkanethiol of choice to create the 1st SAM. A 532 nm laser is focused on the Au surface through a 20× (NA0.8) air or 63× (NA1.4) oil immersion objective and raster scanned in desired regions of interest (ROIs) to thermally desorb patterns of the 1st SAM in a N2-rich atmosphere. A 2nd SAM is formed on the bare Au patterned regions. Successive cycles of this process allow for the fabrication of multifaceted surfaces; surfaces that display multiple chemical functionalities with each functionality confined to its own patterned array.
Figure 1. Schematic of the LSL Process to Create Multifaceted Patterned Surfaces.

(A) A gold-coated glass coverslip is functionalized with an OEG-terminated alkanethiol. Desired regions of the OEG SAM are thermally desorbed from the surface with a 532 nm laser via disulfide bond formation through localized heating. The patterned bare Au regions are exposed to a 2nd alkanethiol of choice. Successive cycles of the process allow for patterning of multiple SAMs or biomolecules in close proximity on a single surface. (B-D) A multifaceted surface created with LSL displaying independent arrays of two cell adhesive ligands, (B) GRGDS and (C) HFN, with each ligand confined to its own patterned array against a biologically inert background. (B) An OEG SAM was formed on a Au surface and an array of 1×8 μm ellipses of the OEG was thermally desorbed with a 532 nm laser operating at 12.80 nJ μm−2 focused through a 20× (NA0.8) objective. The bare Au patterned regions were functionalized with a GRGDS-terminated alkanethiol and fluorescently labeled. (C) A second round of patterning, orthogonal to the GRGDS patterns, was performed and exposed to fluorescently labeled HFN. (D) The multifaceted surface displays independent arrays of GRGDS (red horizontal patterns) and HFN (blue vertical patterns) against a passive background. (B-D) SB=20 μm.
A multifaceted surface displaying two patterned cell adhesive ligands against a biologically inert background is displayed in Fig. 1D. A Au surface was functionalized with a 2 mM ethanolic solution of HS(CH2)15CONHCH2CH2(OCH2CH2)5OH (OEG) for 1 hr to create a protein repulsive and biologically inert background. An array of 1×8 μm ellipses of the OEG SAM was thermally desorbed with a 532 nm laser focused through a 20× (NA0.8) objective operating at a fluence of 12.80 nJ μm−2. The resulting bare Au patterns were functionalized with a 2 mM ethanolic solution of HS(CH2)15CONHCH2CH2(OCH2CH2)11GRGDS (GRGDS) for 1 hr and the peptide fluorescently labeled (Fig. 1B). A second set of ROIs, orthogonal to the first, of the OEG SAM was desorbed and the patterns exposed to fluorescently labeled HFN (12.5 μg ml−1 in PBS for 30 min at 37°C) (Fig. 1C). The multifaceted surface presents two distinct cell adhesive ligands (full length HFN (Fig. 1C) and the peptide sequence RGD derived from the FN-III10 domain (Fig. 1B)) in defined patterned arrays with each ligand confined to its own array against a biologically inert background (Fig. 1D). While both HFN and RGD support the formation of cellular adhesion sites, HFN contains additional integrin ligating domains and can undergo fibrillogenesis. Cell studies with multifaceted surfaces that display these two patterned ligands allow for the simultaneous investigation of the influences of biophysical (ECM geometry) and biochemical cues (integrin ligation) on cell behavior. Although cell adhesive ligands were patterned in this study, the LSL fabrication process allows for patterning of multiple biomolecules of choice either through conjugation to or tethering from alkanethiol SAMs or through adsorption to bare Au or alkanethiol functionalized patterns.
2.2 Design Rationale and Verification of Selective SAM Desorption
Previous studies using laser-assisted thermal desorption of alkanethiol SAMs implemented a continuous-wave 488 nm laser to pattern 30 nm Au films[27, 29, 31] or a pulsed 532 nm laser to pattern 300 nm Au films[28, 30]. In this study, thin (≤ 10 nm) Au films were patterned with a continuous-wave 532 nm laser for two reasons: (1) thin (≤ 20 nm) Au films are optically semitransparent allowing for fluorescent microscopy to be implemented for pattern characterization and microscopic evaluation of cells and (2) so that low laser energy (short irradiation time) could be used for patterning. Thin (< 15 nm) Au films display a peak in their extinction spectra dominated by high absorption from 520–560 nm[32, 33] that coincides with the formation of surface plasmons[33] that decay as heat. Au films display a minimum in their extinction spectra from 460–500 nm.[32, 33] As a consequence, the absorption of Au films can be ~2× higher at 532 nm compared to 488 nm.[32] Au films also exhibit decreased in-plane thermal conductivity with decreased film thickness.[34] The conductivity can diminish by a factor of ~2× when the thickness decreases from 30 to 6 nm as a result of changes in grain morphology.[34] Laser-induced thermal desorption of SAMs occurs when the energy of the light adsorbed by the Au film is released as heat resulting in a highly localized increase in surface temperature in the irradiated region.[27, 35] Approximately 50% of the SAM is removed at a surface temperature of 160°C[36] with complete desorption occurring at 210–212°C.[27, 36] Since LSL is a thermal-based process one would anticipate more efficient patterning (heat generation) to occur at a wavelength with higher absorption (532 nm compared to 488 nm) and when thinner Au films with decreased thermal conductivity are employed. For comparison, Iversen et al implemented a continuous-wave 488 nm laser operating at 6 mW (42 mW μm−2 as calculated from eq. 2) focused through a 100× (NA1.4) objective with irradiation times of 60–210 sec to pattern 30 nm Au substrates.[31] In the work presented here, patterning of 10 nm Au films was achieved with a 532 nm laser operating at 3.5 mW (~21 mW μm−2) focused through a 63× (NA1.4) objective with an exposure time as low as 0.95 μsec; the highest exposure time was 63.9 msec when operating with a pixel dwell time of 6.39 μsec and 10,000 iterations per ROI. This comparison suggests that patterning at wavelengths that lie in the high absorption regime combined with the use of ultrathin Au films that have higher thermal resistivity allows for more efficient patterning. The increased efficiency allows for patterning at lower laser fluence (highly reduced exposure time) making the process drastically faster.
Laser-assisted thermally-induced SAM desorption from Au surfaces has been confirmed by secondary ion mass spectroscopy,[29] cyclic voltammetry,[30] condensation,[27–29] scanning electron,[27, 30, 31, 35] fluorescence,[28] and atomic[31] or lateral force microscopies[28]. In this study, surface mapping X-ray photoelectron spectroscopy (XPS) was implemented to verify laser-induced thermal desorption of an OEG SAM in the patterned ROIs through analysis of the C1s, O1s, and S2p spectra to monitor the presence of the alkyl chain, oligo(ethylene glycol) terminal group, and thiol head group respectively. A 4×4 array of star-shaped ROIs with a characteristic length of 100 μm was used to thermally desorb an OEG SAM. The C1s, O1s, and S2p spectra were mapped using a 9 μm X-ray spot size. Fig. 2 demonstrates that the C1s, O1s, and S2p signal intensities of the OEG SAM were void in the star-shaped patterned regions while the surrounding OEG background maintained high signal intensities in all spectra. The results confirm site specific thermal desorption of the alkanethiol SAM upon localized heating. The absence of signal in the patterned regions in the S2p spectra indicates SAM desorption through Au-S scission.[22, 27] Au-S scission is a crucial step in providing clean Au patterns that allow for further functionalization when exposed to subsequent SAMs. If thiol residues remained on the surface further functionalization steps could be inhibited.
Figure 2. Verification of Alkanethiol Desorption.

A 4×4 array of star-shaped patterns with a characteristic length of 100 μm was used to thermally desorb an OEG SAM with a 532 nm laser focused through a 20× (NA0.8) objective. The patterned surface was imaged via map scanning XPS using a 9 μm spot size. The C1s, O1s, and S2p spectra were attained to monitor the removal of the alkyl chain, OEG terminal group, and thiol head group respectively. Absence of signal in the patterned regions in the S2p spectra indicates thermally induced desorption of the OEG SAM through Au-S scission. The background gradient is due to spherical aberration from the X-ray positioning system. SB=100 μm.
2.3 Controlling Pattern Feature Size
LSL is a thermal-based desorption technique that relies on localized heating. Due to the thermal nature of the process the pattern feature size can be tuned by refining the: (1) amount of energy delivered to the Au film, (2) wavelength used for patterning, (3) beam waist of the focused laser, (4) numerical aperture of the objective, (5) optical properties (absorption) of the Au film, (6) thermal properties (conductivity) of the Au film, and (7) activation energy needed for SAM desorption. In these studies, the influences of laser fluence, number of passes per ROI, Au film thickness (conductivity), and objective NA on pattern size were systematically investigated. Tight control over pattern feature size and the ability to create nano- to micrometer-sized patterns is demonstrated through fine tuning of these parameters.
2.3.1 Influence of Laser Patterning Parameters (Fluence and Iterations) on Pattern Feature Size
To gain a better understanding of the relationship between the amount of energy delivered to the Au film and the resulting pattern size, arrays of 1×20 pixel ROIs of an OEG SAM were desorbed with systematic variations in the laser fluence and number of iterations per ROI (Fig. 3). 10 nm Au films were functionalized with OEG, 1×20 pixel ROIs of the OEG SAM were thermally desorbed, the surfaces exposed to HFN (12.5 μg ml−1 in PBS for 30 min at 37°C), the HFN fluorescently labeled, the resulting patterns imaged via fluorescent microscopy, and the patterned regions mathematically fit with ellipses to characterize the minor axis and area of the patterns for each condition. 1 pixel wide ROIs were implemented so that the minor axis of the ellipses, which corresponds to the Airy Disk of the focused laser beam, was indicative of the minimum feature size achievable. Noticeable increases in pattern size were only observed in the minor axis (1 pixel wide, perpendicular to scanning direction) and not the major axis (20 pixels long, parallel to scanning direction). Deviation in the size of the major axis was large enough to shield any elongation in pattern length induced by changing the laser parameters therefore linear increases in both the minor axis and pattern area with increased laser fluence were observed (Fig. 3A,C). The minor axis linearly increased with increased laser fluence at a constant number of iterations (Fig. 3A) as reported by others.[27, 31, 35] When patterning over a fluence range of 12.80–50.80 nJ μm−2 with a constant 1,000 iterations per ROI the minor axis increased from 2.19 ± 0.26 to 3.03 ± 0.18 μm (Fig. 3A). The pattern area displayed the same trend and increased from 14.04 ± 2.37 to 20.34 ± 1.52 μm2 (Fig. 3C).
Figure 3. Influence of Laser Fluence and Iterations on Pattern Size.

10 nm Au films were functionalized with an OEG-terminated alkanethiol and arrays of 1×20 pixel ROIs of the SAM were thermally desorbed with a 532 nm laser focused through a 20× (NA0.8) objective with varying laser fluence (12.8–50.8 nJ μm−2) and number of iterations (125–10,000) per ROI. The patterned surfaces were exposed to HFN, the HFN fluorescently labeled, the surfaces imaged (see Fig 1B for a representative image), the patterns mathematically fit with ellipses, and the (A,B) minor axis and (C,D) area measured for each set of patterning conditions. The (A) minor axis and (C) area displayed a linear increase with increased laser fluence at a constant number of iterations (1,000) per ROI. The (B) minor axis and (D) pattern area increased with increased iterations at a constant fluence (50.8 nJ μm−2) that plateaued at ~5,000 iterations.
The influence of repeated passes on feature size was also investigated and a sigmoidal relationship was observed (Fig. 3B,D). The minor axis of the elliptical patterns increased from 2.45 ± 0.23 μm at 125 iterations that began to plateau at ~5,000 iterations at 3.60 ± 0.22 μm when patterning with a constant fluence of 50.8 nJ μm−2 (Fig. 3B). The area of the elliptical patterns followed the same trend and increased from 15.29 ± 1.76 to 25.13 ± 1.73 μm2 over the same range of iterations (Fig. 3D). As more energy was delivered to the Au film by increasing the fluence or number of passes more heat was generated. With highly conductive films this resulted in enlarging of the spatial region that reached the crucial temperature (212°C) for thermally-induced SAM desorption resulting in larger patterns.
2.3.2 Au Film Thickness (Conductivity) Influence on Pattern Feature Size
The in-plane thermal conductivity of thin Au films is a function of film thickness and the conductivity can more than double when the film thickness increases from 6 to 30 nm as a consequence of changes in film morphology and structure.[34] Since LSL relies on localized heating, the influence of Au film thickness was investigated as a means to control pattern size. Given that the thermal conductivity decreases in thinner Au films, one would expect smaller patterns to be formed due to increased heat confinement to the irradiated region. Additionally, since thinner films have higher thermal resistivity, the local surface temperature should increase more rapidly allowing for patterning at lower laser energy. To test this idea, 1×20 pixel ROIs were patterned on 6, 8, and 10 nm Au films with systematic variations in the laser fluence and number of iterations per ROI and the resulting patterns characterized as described in Section 2.3.1. Three-dimensional graphs of the pattern minor axis (Fig. 4A–C) and area (Fig. 4D–F) as a function of laser fluence and number of iterations were created. The same trends of increased pattern size with increased fluence at a constant number of iterations and vice versa were observed as discussed in Section 2.3.1. A trend of increased feature size with increased Au film thickness was also observed (Fig. 4). As expected with a thermal process, the largest features (2.13, 3.06, and 3.60 μm for the 6, 8 and 10 nm surfaces respectively) were formed when the most energy was delivered to the Au, i.e. at the highest fluence (50.80 nJ μm−2) and number of iterations (10,000) (Fig. 4A–C). Conversely, the smallest features (1.33, 1.38, and 1.48 μm for the 6, 8, and 10 nm surfaces respectively) were created at the lowest fluence (12.8 nJ μm−2) and least number of iterations (125) (Fig. 4A–C). It should be noted that a minimum fluence of ~10–12 nJ μm−2 was needed to thermally desorb some of the OEG SAM when operating at a low number of iterations (1 or 10). 10 nm Au films displayed the highest flexibility in pattern size as a function of the patterning parameters (Fig. 4A,D) followed by the 8 nm (Fig. 4B,E) and then the 6 nm (Fig. 4C,F) Au films. These results indicate that the thickness of the Au film plays a significant role in controlling pattern feature size which most likely emanates from differences in the thermal conductivity of the Au films. The ability to generate a large range of pattern sizes by increasing the amount of energy delivered to the film was suppressed on 6 nm films (Fig. 4C,F). Due to the high thermal resistivity of these surfaces, delivery of increased energy resulted in melting of the Au layer and the formation of topographical features rather than spreading of the heat and pattern enlarging as observed on 8 and 10 nm Au substrates.
Figure 4. Tuning Pattern Size by Varying Laser Fluence, Iterations, and Au Film Thickness.

3D plots displaying the measured pattern (A-C) minor axis and (D-F) area as a function of laser fluence and number of iterations per ROI for elliptical patterns created on (left column) 10, (middle column) 8, and (right column) 6 nm thick Au films. Au films with the indicated thickness were functionalized with an OEG-terminated alkanethiol and arrays of 1×20 pixel ROIs of the OEG SAM were thermally desorbed from the surface with a 532 nm laser focused through a 20× (NA0.8) objective with varying laser fluence (12.8–50.8 nJ μm−2) and number of iterations (125–10,000) per ROI. The patterned surfaces were exposed to HFN, the HFN fluorescently labeled, the surfaces imaged (see Fig 1B for a representative image), the patterns mathematically fit with ellipses, and the (A-C) minor axis and (D-F) area of the ellipses measured for each set of patterning conditions. Pattern enlarging was observed on all of the Au films as a function of both increased laser fluence and number of iterations. As the thermal conductivity of the Au film was decreased by reducing the film thickness the extent of pattern enlarging was reduced. Thinner Au films have lower thermal conductivity and thus reduce the surface area that reaches the crucial temperature for thermally induced alkanethiol desorption. Due to the thermal nature of the LSL process, pattern size can be finely tuned through optimization of the energy input into the substrate and the substrate thermal properties.
2.3.3 Patterns with Controlled Topography
Cells possess the ability to sense and respond to the topography of the underlying substrate and surfaces with varying levels of nanotopography have been implemented to induce changes in cell function.[37] We tested the ability to precisely modulate the extent of topography created in the patterned regions by tuning the laser and Au film parameters used for LSL patterning. Two distinct mechanisms of thermally-induced alkanethiol SAM desorption from Au surfaces have been demonstrated and are termed non-specific and chemically-specific patterning.[31] Non-specific patterning occurs when thin layers of the Au film are vaporized from the surface in the region of the focused laser beam. This mode of patterning removes the Au and SAM concurrently resulting in 1–11 nm indentations in the irradiated, patterned regions depending on the laser energy delivered to the film.[31] Chemically-specific patterning occurs in the absence of Au film vaporization where only the SAM is desorbed resulting in topography-free, purely chemical patterns.[31] These two modes of patterning are surface temperature dependent where chemically-specific patterning occurs at low laser energy (low surface temperature, 212°C) while non-specific patterning occurs at higher energy (high surface temperatures, 1064°C).[31] The work presented here adds a third mode of laser induced thermal patterning we have termed “topographical patterning” in which ultrathin (6 nm) Au surfaces undergo hydrodynamic melting rather than vaporization resulting in patterns with raised topography of controlled height on the nanometer scale.
Two modes of laser-induced thermal ablation of thin Au films have been described, vaporization and hydrodynamic ablation.[38] During vaporization, thin layers of the Au film are evaporated from the surface resulting in indentations in the irradiated regions. In hydrodynamic ablation the Au melts, coalesces to form ridges, and is eventually ejected from the surface as droplets upon reaching a crucial size resulting in the formation of raised topographical features.[38, 39] Fig. 4C,F demonstrates that patterns created on 6 nm Au surfaces do not enlarge as drastically with increased energy input as patterns created on thicker 8 (Fig. 4B,E) and 10 nm (Fig. 4A,D) Au films. To gain insight into this occurrence we examined the topography of patterned surfaces using white light interferometry.
While both chemically-specific and non-specific patterning were observed on 6 and 10 nm thick Au films (Fig. 5), a third regime of patterning that resulted in raised topographical features was observed only on 6 nm Au films (Fig. 5A–C). Patterns created with the highest fluence (50.8 nJ μm−2) and number of iterations (10,000) displayed ~1 nm dips on 10 nm Au films (Fig. 5D). As the energy delivered to the film was steadily decreased by lowering the fluence and number of iterations, the dips reduced to <0.5 nm indicating a shift from non-specific to chemically-specific patterning (Fig. 5D–F). A similar occurrence was observed on 6 nm Au films where ~0.5 nm dips were measured in patterns created with an intermediate fluence (25.4 nJ μm−2) and 1 iteration (Fig. 5B) while flat regions were observed at lower fluence (12.8 nJ μm−2) and ≤10 iterations (Fig. 5C). Above these energy thresholds a third mode of patterning was observed in which the irradiated regions of the Au underwent hydrodynamic melting instead of vaporization. Topographical patterning occurred on 6 nm films when ≥10 iterations were used at fluences of 50.8 (Fig. 5A) or 25.4 nJ μm−2 (Fig. 5B) or when ≥100 iterations were implemented at 12.8 nJ μm−2 (Fig. 5C). Fig. 5A–C shows that the extent of the topography in the patterned regions can be tuned by controlling the amount of energy delivered to the film. When patterning with a fluence of 50.8 nJ μm−2 the topography decreased from ~17 nm at 10,000 iterations to −0.5 nm at 1 iteration (Fig. 5A). The same trend was observed in Fig. 5B,C where increased energy input resulted in increased surface topography.
Figure 5. Patterning with Controlled Topography.

6 and10 nm thick Au films were functionalized with an OEG-terminated alkanethiol and arrays of 1×20 pixel ROIs of the OEG SAM were thermally desorbed with a 532 nm laser focused through a 20× (NA0.8) objective with varying laser fluence (50.8–12.8 nJ μm−2) and number of iterations (10,000–1) per ROI (see Fig. 1B for the pattern array geometry). Surface topography maps of (A-C) 6 and (D-F) 10 nm Au films after patterning at the indicated fluence and number of iterations were created with white light interferometry. Height traces of the surface topography were acquired as depicted by the dashed white lines. Raised topographical patterning occurred only on 6 nm thick Au films (≥10 iterations at (A) 50.8 or (B) 25.4 nJ μm−2 and ≥100 iterations at (C) 12.8 nJ μm−2) and the extent of the topography increased with increased fluence and number of iterations. The patterned regions increased from nearly flat at low laser energy and/or low number of iterations to ~17 nm at high laser energy and/or increased iterations. (D-F) The higher thermal conductivity of the 10 nm Au films prevented hydrodynamic melting of the Au and only vaporization or chemically-specific patterning occurred. Vaporization of the Au in the patterned regions on 10 nm films resulted in 0.5–1.0 nm indentations (black arrows in the height traces as indicated in D-F). The pattern depth decreased with decreased laser energy and/or fewer iterations. The data demonstrates that LSL allows for fabrication of micropatterns with controlled topography on the nanometer length scale.
2.3.4 Nano- and Sub-Diffraction Limited Patterning with LSL
Cells adhere to ECM proteins through integrin-mediated adhesions[40] that mature from small (< 0.25 μm2) nascent adhesions to larger (> 1 μm2) focal adhesions.[41–43] Each stage of maturation involves inclusion of various intracellular signaling motifs that govern many aspects of cell behavior.[44] Direct control over adhesion site size using surfaces presenting micro-[14] or nanopatterns[45] of adhesive ligands has been implemented to influence cytoskeleton formation,[14] spreading[45], and proliferation[45]. In order to manipulate intracellular signaling cascades regulated by adhesion sites it would be advantageous to gain control over adhesion maturation by limiting adhesion site growth. The feasibility of using LSL to create patterns in this size regime was tested.
The size of the patterns created with LSL can be minimized by using: (1) a high NA objective, (2) low laser fluence and few iterations to minimize heat generation, and (3) thin Au films with decreased thermal conductivity to prevent lateral spreading of the generated heat and subsequent pattern enlarging. 1×1 (smaller circular patterns in Fig. 6A,B) and 1×3 (larger oval patterns in Fig. 6A,B) pixel ROIs of HFN were patterned on a 10 nm Au film with a 532 nm laser operating at a fluence of 33.38 nJ μm−2 focused through a 63× (NA1.4) oil immersion objective with varying iterations per ROI. The sigmoidal relationship between pattern size and the number of iterations as described in Section 2.3.1 was observed (Fig. 6C,D). The diameter of the small circular patterns increased from 460 ± 100 nm (0.17 ± 0.07 μm2) at 100 iterations to 1.07 ± 0.03 μm (0.90 ± 0.05 μm2) at 10,000 iterations. The minimum feature size (460 nm) correlates well with the diameter of the Airy Disk (464 nm).
Figure 6. Nanopattern Fabrication with LSL.
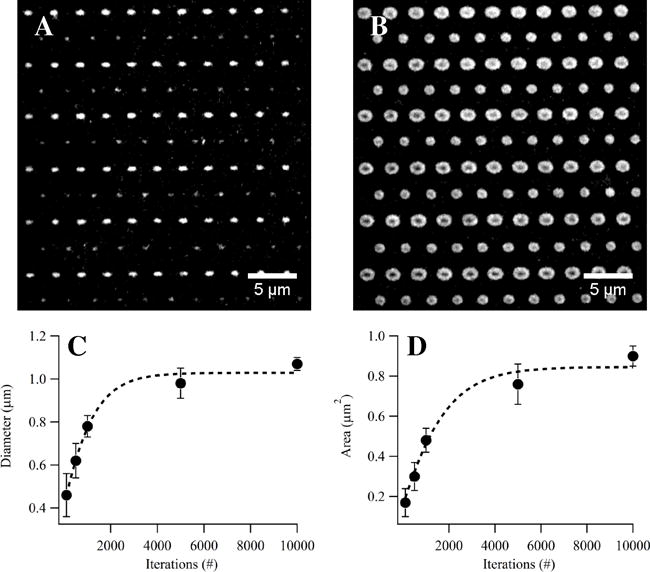
A 10 nm Au surface was functionalized with an OEG-terminated alkanethiol and a mixed array of 1×1 and 1×3 pixel ROIs was used to thermally desorb the OEG SAM with a 532 nm laser focused through a 63× (NA1.4) oil immersion objective operating at a constant fluence of 33.38 nJ μm−2 with iterations varying from 125–10,000 per ROI. The surfaces were exposed to HFN, the HFN fluorescently labeled, and the surfaces imaged. Fluorescently labeled HFN adsorbed to the patterned array created with (A) 125 iterations or (B) 10,000 iterations per ROI. The (C) diameter and (D) area of the circular patterns increased with increased iterations due to spreading of the heat through the Au films. (A,C) Patterns as small as 450 nm (0.17 μm2) were created using LSL. SB=5μm.
Since laser-assisted SAM desorption is a photothermal process rather than a photochemical process we hypothesized that sub-diffraction limited patterns could be created through minimization of the laser fluence and substrate conductivity. Shadnam et al created a model based on experimental data to gain insight into the relationships between the light intensity profile, surface temperature profile, and extent of SAM desorption.[35] In their setup the surface area that exceeded a temperature of 212°C was always larger than the laser beam waist.[35] Since the temperature profile in the Au film follows a Gaussian distribution where size is determined by the Airy Disk, laser intensity, scan speed, and thermal conductivity of the film, it should be possible to use low fluence in combination with low conducting films to create patterns with only the tip of the Gaussian profile. This mode of patterning could provide the ability to confine the surface area that reaches the threshold for SAM desorption to be smaller than the Airy Disk. Minimization of the energy delivered to the Au film combined with the use of low conductivity films allowed for the fabrication of sub-diffraction limited patterns. A 532 nm laser focused through a 20× (NA0.8) objective operating at a fluence of 7.55 nJ μm−2 was used to pattern 6 nm Au films. Elliptical patterns with an average minor axis of 594 ± 154 nm, 26% smaller than the 811 nm Airy Disk, were created. While this is the first report, to our knowledge, of sub-diffraction limited thermal patterning of SAMs on Au surfaces, sub-diffraction limited patterning with laser-assisted desorption of silane and siloxane SAMs on oxidized silicon surfaces has been demonstrated.[46–50] Silane and siloxane SAMs inherently have a higher activation energy for thermal desorption due to their ability to bind not only to the surface, as with alkanethiol SAMs, but to also crosslink with neighboring molecules.[49, 51] Due to this higher activation energy, the ability to create sub-diffraction limited patterns up to 97% smaller than the laser beam waist has been reported.[46, 47, 49]
2.4 Patterned Arrays that Present Ligand Concentration Gradients
Surfaces presenting ligand concentration gradients are useful for investigating fundamental cell processes such as polarization[52] and migration[53]. We implemented two complementary patterning methods that relied on dose dependent changes in the total energy delivered to the Au film to create either stepwise or smooth surface concentration gradients of alkanethiol SAMs (Fig. 7). 10 nm thick Au films were functionalized with an OEG-terminated alkanethiol. The OEG SAM was thermally desorbed using two methods to vary the amount of energy delivered to the patterned regions by either changing the number of iterations used in adjacent patterns (Fig. 7A) or by slightly tilting the sample (Fig. 7B). The patterned surfaces were functionalized with a biotin-terminated alkanethiol followed by exposure to AF546-conjugated streptavidin. The first method was implemented to create a symmetrical gradient displaying stepwise changes in the ligand concentration between each column (Fig. 7C–E). The number of iterations used to pattern the ROIs in adjacent columns was decreased by a factor of 2 from the left column to center and increased by a factor of 2 from the center column to the right (Fig. 7C). This method resulted in stepwise changes in fluorescent intensity between adjacent columns (Fig. 7C–E). Alternatively, the amount of energy delivered to the films can be decreased more smoothly by slightly tilting the sample so that the focal plane of the laser slowly retracts from the surface.[29] The last column on the right (Fig. 7C) was patterned by tilting the sample 1.4° so that the sample slowly left the focal plane of the objective from the top row to the bottom row (~2 μm out of focus over 80 μm) resulting in a smoother ligand concentration gradient (Fig. 7C,D).
Figure 7. Fabrication of Micron-Scale Ligand Gradients.

LSL provides two methods to create ligand density gradients. The total amount of energy delivered to the ROIs can be varied by changing the number of iterations per ROI as depicted in (A) or by slightly tilting the sample so that the sample slowly leaves the focal plane of the focused laser as depicted in (B). (C) A 10 nm Au film was functionalized with an OEG-terminated alkanethiol and 1×8 μm patterns of the OEG were thermally desorbed with a 532 nm laser focused through a 20×(NA0.8) objective operating at a constant fluence. The bare Au patterns were backfilled with a biotin-terminated alkanethiol, labeled with AF546-conjugated streptavidin, and imaged. The number of iterations per ROI was decreased by a factor of 2 from the left to the center of the image and increased by a factor of 2 from the center to the right of the image to create a symmetrical density gradient using the method depicted in (A). (C) The last column on the right (outlined by dashed yellow line and indicated by the yellow arrows) was created by tilting the sample 1.4° so that the laser slowly went out of focus from the top to bottom using the method depicted in (B). (D) An areal plot of the streptavidin fluorescent intensity shows the gradients created in the × direction across all columns and in the y direction for the last column on the far right in (C) as indicated by the yellow arrows. (E) A line plot of the streptavidin intensity as indicated by the red line in (C). (B) SB=20 μm.
2.5 Ligand Surface Density Displayed by HFN and Mixed SAMs of GRGD- and OEG-Terminated Alkanethiols
Since ligand density influences cell adhesion, spreading, and motility [54–56] it is crucial to know the densities of the ligands displayed by the multifaceted surfaces in order to perform detailed cell studies. XPS was implemented to estimate the RGD ligand surface density displayed by HFN adsorbed to bare Au and by surfaces functionalized with mixed GRGD/OEG alkanethiol SAMs.
2.5.1 Estimation of RGD Surface Density Displayed by HFN Adsorbed to Au
High-resolution C1s, N1s, and Au4f XPS spectra were attained for Au surfaces exposed to HFN solution (30 min at 37°C) at concentrations of 1.56–50.00 μg ml−1 to monitor the adsorption of HFN and to create an RGD surface density calibration graph (Fig. S1, Fig. 8A). Deconvolution of the C1s spectra indicated the presence of C-C (285 eV: ~43%), amine, alcohol, ether (286 eV: ~34%), and amide (288 eV: ~23%) bonds on the surface (Fig. S1, Table S1). Incremental increases in the C1s and N1s signal intensities accompanied by a decrease in the Au4f background signal were observed as the HFN solution concentration increased, affirming increased HFN adsorption with increased solution concentration (Fig. S1, Table S1). The packing density of a monolayer of fibronectin is ~190 ng cm−2 (~2500 FN μm−2) as determined through radiolabeling experiments.[57] The measured area under the N1s peak for the surfaces exposed to HFN solution at 50 μg ml−1 was set to the saturation value of 2500 FN μm−2. The HFN packing density for the surfaces exposed to lower HFN concentrations was determined using the relative areas under the N1s peaks to ratiometrically back calculate the packing density.[45] As a metric for comparison between the HFN and GRGD SAMs, the number of RGD motifs per area was calculated. The RGD density displayed by adsorbed HFN was estimated by multiplying the HFN packing density by 2 (the number of RGD motifs per HFN molecule). Using this method an RGD surface density calibration graph was created (Fig. 8A). A sigmoidal relationship between the number of RGD motifs displayed and the solution concentration of HFN was observed. The RGD density linearly increased from 963 ± 258 to 4,106 ± 203 RGD μm−2 at HFN solution concentrations of 1.56 and 12.50 μg ml−1 respectively that reached a saturation value of 5,000 ± 131 RGD μm−2 at 50.00 μg ml−1. Although this measure does not take other integrin binding domains displayed by HFN into account, it provides a metric for comparing to the GRGD SAM patterns.
Figure 8. RGD Surface Density Displayed by Adsorbed HFN and Mixed GRGD/OEG3 SAMs.

XPS was used to estimate the RGD surface density displayed by HFN adsorbed to bare Au or by mixed GRGD/OEG3 alkanethiol SAMs. (A) Bare Au surfaces were exposed to HFN solution for 30 mins at 37 °C with concentrations from 1.5–50.0 μg ml−1, the surfaces rinsed, and the N1s spectra acquired with XPS at each concentration (see Supplemental Fig. S1 and Table S1). The area under the N1s peak was measured for each condition to quantify the amount of protein present. The HFN surface density was estimated by setting the saturation concentration to a previously published fibronectin packing density. The HFN surface density on the remaining surfaces was ratiometrically back calculated using the measured areas under the N1s peaks. The RGD surface density was determined by multiplying the HFN surface density by the number of RGD motifs, two, displayed on each HFN molecule. (B) A similar method was used to estimate the RGD surface density displayed by mixed SAMs of GRGD- and OEG3-terminated alkanethiols. Bare Au surfaces were exposed to solutions of mixed alkanethiols at a working concentration of 2 mM for 1 hr. The percent of GRGD-terminated alkanethiol in solution was varied from 0.5–10.0% (for example, the 10% GRGD solution was comprised of equal volumes of 0.2 mM GRGD- and 1.8 mM OEG3-terminated alkanethiols). The area under the N1s peak (see Supplemental Fig. S2 and Table S2) for each GRGD concentration was measured and the packing density of the 1% GRGD surface set to a previously published value. The RGD surface density for the remaining surfaces was ratiometrically back calculated using the N1s peak areas.
2.5.2 Estimation of GRGD Surface Density Displayed by Mixed SAMs of GRGD- and OEG-Terminated Alkanethiols
The GRGD ligand density displayed by mixed SAMs of GRGD- and OEG3-terminated alkanethiols was estimated with the same method used to determine the HFN packing density. Surfaces displaying mixed SAMs of GRGD/OEG3 were created by varying the molar ratio of the two alkanethiols at a constant working concentration of 2 mM. For example, a 10% GRGD surface was created by functionalizing the Au with a solution containing equal volumes of 0.2 mM GRGD and 1.8 mM OEG3. Surfaces presenting mixed SAMs of GRGD/OEG3 composed of ≤ 1% GRGD prevent adsorption of protein from solution[4] and at 1% GRGD display an RGD packing density of ~7.5 pmol cm−2 (45,165 RGD μm−2)[58]. To estimate the GRGD packing density, surfaces were functionalized with mixed GRGD/OEG3 SAMs with the %GRGD varied from 0–10%. High resolution C1s, N1s, O1s, and Au4f XPS spectra were acquired for each surface (Fig. S2). Incremental increases in the N1s signal intensity accompanied by increases in both the OEG (287 eV) and amide bond (288 eV) portions of the C1s spectra were observed with increasing %GRGD affirming an increased surface density of GRGD in the mixed SAM (Fig. S2, Table S2). Concurrently, a decrease in the Au4f background signal with increased %GRGD was observed due to increased shadowing from the longer GRGD alkanethiol (Fig. S2, Table S2). The GRGD packing density of the surfaces created with 1% GRGD was set to 45,165 RGD μm−2 [58] and the packing densities of the remaining surfaces were ratiometrically back calculated using the relative areas under the N1s peaks. The GRGD packing density linearly increased from a 32,809 ± 7,704 to 481,813 ± 5,274 RGD μm−2 as the %GRGD increased from 0.5 to 10.0 % respectively (Fig. 8B).
2.6 Cell Adhesion & Migration on Multifaceted Patterned Surfaces
2.6.1 Simultaneous Cell Adhesion to Multiple Patterned Ligands on Multifaceted Surfaces
To confirm bioactivity of the patterned ligands and to examine adhesion site placement Human Umbilical Vein Endothelial Cells (HUVECs) were cultured on multifaceted, micropatterned surfaces that displayed an array of 1×8 μm ellipses of GRGD (1% GRGD in OEG6: 45,165 RGD μm−2) in the horizontal direction orthogonally interwoven with an array of 1×8 μm ellipses of HFN (25 μg ml−1: 4,593 RGD μm−2) in the vertical direction (Fig. 9). It should be noted that mixed SAMs of GRGD in OEG6 were used for cell studies instead of the GRGD/OEG3 SAMs used for XPS analysis. OEG6 displays increased resistance to protein adsorption compared to OEG3 [59–61] and it was crucial to prevent HFN adsorption to the GRGD patterns during the fabrication of the multifaceted surfaces. It should also be noted that mixed SAMs of GRGD in either OEG3 or OEG6 display a similar RGD packing density therefore the RGD density displayed by the GRGD/OEG3 SAMs determined though XPS analysis also reflects the RGD density for the GRGD/OEG6 SAMs [58]. Sixteen hours post seeding the HUVECs were fixed, fluorescently immunolabeled for HFN, vinculin, and actin and imaged. Fluorescent labeling of HFN was used to confirm preferential adsorption of HFN to the bare Au patterns (see insets 1 & 2 in Fig. 9). HUVECs cultured on multifaceted, patterned surfaces formed adhesions simultaneously to both the GRGD (red arrows) and HFN (blue arrows) patterns as indicated by vinculin labeling (Fig. 9). These results indicate that both ligands retained bioactivity during the LSL patterning process and that HUVECs recognized and adhered to both GRGD and HFN patterns. To our knowledge, this is the first demonstration of simultaneous cell adhesion to multiple patterned ECM ligands in a single cell.
Figure 9. HUVEC Adhesion Site Formation on Multifaceted Patterned Surfaces.
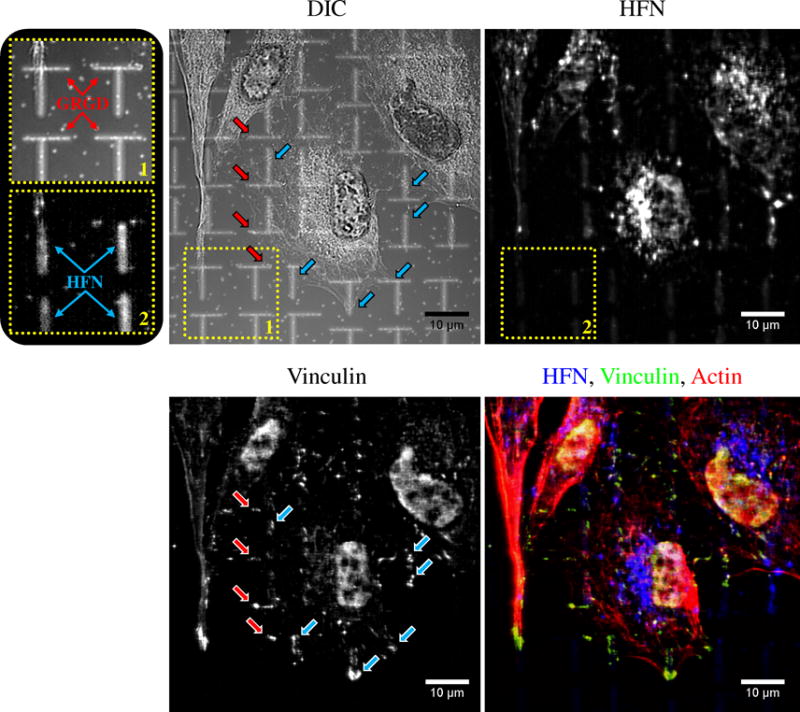
Multifaceted patterned surfaces presenting 1×8 μm ellipses of GRGD-terminated alkanethiol in the horizontal direction (1% GRGD in OEG: see inset 1) interwoven with HFN ellipses in the vertical direction (25 μg ml−1: see insets 1 and 2) were prepared with LSL. The GRGD and HFN patterns displayed an RGD surface density of ~45,165 and 4,593 RGD μm−2 respectively (see Fig.8). To determine the placement of the HUVEC adhesion sites and which ligand was being ligated, the HUVECs were fixed 16 hr post seeding, immunolabeled for HFN (top right), vinculin (bottom left), and actin (red in bottom right), and imaged with fluorescent and differential interference contrast (DIC) (top left) microscopies. HUVECs displayed adhesions to both the GRGD and HFN patterns. The red arrows in the DIC and vinculin images depict cell adhesions formed on GRGD patterns while the blue arrows indicate those formed on HFN patterns. The data demonstrates that both ligands were biologically active after patterning and induced integrin ligation and adhesion site formation. SB=10 μm.
2.6.2 Lamella Formation and Migration on Multifaceted Patterned Surfaces
After demonstrating bioactivity and simultaneous cell attachment to both patterned ligands we implemented multifaceted surfaces to monitor how HUVECs utilized the two different ligands during migration. HUVECs were seeded on the same surfaces described in Section 2.6.1 and imaged with time-lapse differential interference contrast (TL-DIC) microscopy 6 hours post-seeding. Fig. 10 displays a time series of DIC images for a representative HUVEC migrating on a multifaceted surface. At t=0 min (equivalent to 6 hours post seeding) most HUVECs displayed alignment and elongation to the long axis of the vertical HFN patterns. As time proceeded cells used both GRGD and HFN patterns during lamella formation while maintaining preferential elongation to HFN ellipses. At t=4 min a membrane extension guided along a GRGD pattern was formed. Over the next 4 minutes the extension extended vertically downward guided along a HFN pattern and terminated on a GRGD pattern. The lamella continued to grow vertically guided by the HFN patterns and eventually covered three additional HFN patterns and terminated on GRGD patterns at the top and bottom. Interestingly, the HFN patterns dominated the direction of cell elongation even when the RGD density was an order of magnitude lower than displayed by the GRGD patterns. While not fully understood, we speculate that additional binding domains available in HFN could influence adhesion site positioning through either differential integrin usage or adhesion site kinetics or that the process of fibrillogenesis could play a role in the orientation of the HUVECs to the long axis of the HFN patterns.
Figure 10. HUVECs Utilize both GRGD & HFN Patterns During Lamella Formation & Migration on Multifaceted Surfaces.

Multifaceted patterned surfaces presenting 1×8 μm ellipses of GRGD-terminated alkanethiol (1% in OEG: horizontal patterns outlined in red in inset) interwoven with HFN ellipses (25 μg ml−1: vertical patterns outlined in blue in inset) were prepared with LSL. The GRGD and HFN patterns displayed an RGD surface density of ~45,165 and 4,593 RGD μm−2 respectively (see Fig. 8). P3 HUVECs were seeded on the surfaces and imaged with time-lapse differential interference contrast (TL-DIC) microscopy 6 hrs post seeding. HUVECs on multifaceted surfaces displayed preferential cell elongation parallel to the long axis of the HFN patterns and used both GRGD and HFN patterns during lamella formation as shown above by a representative HUVEC outlined in yellow. (t=0 min) The HUVEC was initially elongated in a direction parallel to the long axis of the HFN patterns. (t=4 min) Over the next four min the HUVEC produced a membrane extension along one of the GRGD patterns as depicted by the red arrow. (t=8 min) A lamella began to form that spanned an additional HFN pattern (blue arrow) and terminated at another GRGD pattern (bottom red arrow). (t=12 min) Vertical growth of the lamella occurred along the HFN patterns and spanned three additional HFN patterns (blue arrows) and displayed termini on two GRGD patterns (red arrows). The use of GRGD patterns to span to neighboring HFN patterns was observed in HUVECs migrating on multifaceted surfaces. SB=20 μm.
3. Conclusions
While a multitude of surface patterning strategies exists there are very few “maskless” techniques and even fewer patterning strategies that allow for the fabrication of multifaceted patterned surfaces that display multiple patterned ligands with each ligand confined to its own patterned array. We demonstrated that LSL is a highly versatile “maskless” surface patterning strategy that allows for the fabrication of surfaces that (1) display nano- to micrometer-sized patterns of adhesive ligand, (2) have well-controlled pattern topography on the nanometer length scale, and (3) display both stepwise and smooth ligand gradients. More importantly, LSL provides the ability to pattern multiple adhesive ligands in close proximity. We created multifaceted patterned surfaces displaying interwoven arrays of GRGD and HFN with each ligand confined to its own array. HUVECs cultured on these surfaces formed vinculin-containing adhesions simultaneously to both ligands. While GRGD and HFN were used as model ligands in this study, the ability to pattern multiple peptides or proteins could be easily achieved.
The flexibility in pattern properties with respect to size, spacing, geometry, topography, and ligand density provides the ability to simultaneously investigate a number of influences of ligand display on cell adhesion and behavior. For example, nanoscale surface topography can enhance certain aspects of cell behavior (proliferation,[62, 63] adhesion,[62] mineralization[63]) in osteoblasts and disrupt some processes (adhesion, cytoskeletal formation) in fibroblasts[64]. While the underlying mechanisms of nanotopography-induced changes in cell behavior remain elusive, Miller et al proposed that the observed cellular changes may simply be caused by differences in protein surface concentration or conformation.[65] Using LSL, patterns with systematic variations in both topography and ligand concentration could be fabricated in close proximity with high spatial resolution allowing for the fabrication of surfaces displaying varying levels of nanotopography on a single surface. Experiments with such surfaces could allow for detailed studies of the influences of nanoscale topography and ligand concentration to be conducted simultaneously and even in a single cell if desired.
4. Experimental
Materials
25 and 35 mm diameter, # 1, optical borosilicate circular glass coverslips, sulfuric acid (H2SO4), 30% hydrogen peroxide (H2O2), and sodium chloride (NaCl) were purchased from Fisher Scientific (Pittsburgh, PA). Millipure water (MPH2O) with a resistance > 18 MΩ-cm was obtained from a Millipore Super-Q water system (Billerica, MA). 1/8”×1/8”, 99.999% pure Titanium and gold pellets and 7cc molybdenum crucibles were purchased from Kamis Inc. (Mahopac Falls, NY). 30% ammonium hydroxide (NH4OH), 200 proof ethanol, and T-25 tissue culture flasks were purchased from VWR (West Chester, PA). Ultrahigh purity nitrogen (N2) was purchased from Matheson TriGas (Basking Ridge, NJ). HS(CH2)15CONHCH2CH2(OCH2CH2)5OH (OEG) and HS(CH2)15CONHCH2CH2(OCH2CH2)11GRGDS (GRGDS) alkanethiols were synthesized as previously reported [66]. HS(CH2)11(OCH2CH2)3OH (OEG3), HS(CH2)11(OCH2CH2)6OH (OEG6), and HS(CH2)11(OCH2CH2)6GRGD (GRGD) alkanethiols were purchased from ProChimia (Sopot, Poland). Human plasma fibronectin (HFN), heat-shocked bovine serum albumin (BSA), Tween20, TritonX-100, sucrose, 4-(2-hydroxyethyl)-1-piperazineethanesulfonic acid (HEPES), magnesium chloride (MgCl2), monoclonal mouse anti-vinculin, anhydrous N,N-dimethylformamide (DMF), and triethylamine (Et3N) were purchased from Sigma-Aldrich (St. Louis, MO). Phosphate buffered saline (PBS), pooled human umbilical vein endothelial cells (HUVECs), endothelial cell growth medium-2 (EGM-2), EGM-2 SingleQuots kits, and 0.25% trypsin with 1 mM ethylenediaminetetraacetic acid (EDTA) were purchased from Lonza (Basel, Switzerland). Alexa Fluor 633 (AF633) carboxylic acid succinimidyl ester, AF405, AF488, and AF532 protein labeling kits, goat serum, AF405 goat anti-rabbit, AF532 phalloidin, AF488 goat anti-mouse, and Prolong Antifade Gold were purchased from Invitrogen (Carlsbad, CA). Rabbit anti-HFN was purchased from Abcam (Cambridge, MA). EM grade 16% paraformaldehyde in de-ionized H2O was purchased from Electron Microscopy Sciences (Hatfield, PA).
Synthesis of ω-Functionalized Alkanethiols
OEG-, GRGDS-, and biotin-terminated alkanethiols were synthesized as previously described [66]. GRGDS- and biotin-terminated alkanethiols were more efficiently synthesized through the use of NovaSyn™ TGA resin (EMD Chemicals Inc., Gibbstown, NJ), which is composed of a 4-hydroxy-methyl-phenoxy-acetic acid linker attached to a PEG spacer coupled to the polystyrene resin. To improve yield of each step we also employed double couplings of each amino acid with each coupling at a 5× molar excess. Coupling of the trityl-protected alkanethiol to the peptide-resin was allowed to proceed for 12 hr for each coupling at a 5× molar excess. Reversed-phase high performance liquid chromatography was performed with a preparative-scale 21.5 mm C18 column using a gradient of 95% A) 45:55 isopropanol:water + 0.05% TFA to 95% B) isopropanol + 0.05% TFA over 40 min at 5 ml min−1 flow rate (higher flow rates could not be utilized due to the tendency of pumped isopropanol to spontaneously form air bubbles). ω-Functionalized alkanethiols were purified to ≥ 95% purity and verified for identity by matrix assisted laser desorption ionization time of flight mass spectrometry (MALDI-ToF; Bruker Daltonics, Billerica, MA).
Metal Deposition
Coverslips were cleaned in piranha solution (3:1 H2SO4:H2O2) for 1 hr, rinsed thoroughly in MPH2O, soaked in MPH2O overnight, and dried with N2. For LSL patterning, 2 nm Ti and 6, 8, or 10 nm Au were deposited at a rate of 1–2 Å sec−1 onto 35 mm diameter coverslips and for XPS studies 10 nm Ti and 75 nm Au were deposited onto 25 mm coverslips using an electron-beam evaporator (Sharon Vacuum, Brockton, MA). The film thickness and deposition rate were monitored by the quartz crystal located adjacent to the sample stage in the evaporator.
Laser Characterization
The diameter of the focused laser beam was estimated from the Airy Disk as shown in equation 1:
| (1) |
where AD is the Airy Disk diameter (beam waist of the focused laser), λ the wavelength, and NA the numerical aperture of the objective. The power output (P) of the laser was measured at the focal plane of the objective and the intensity (I) was calculated from equation 2:
| (2) |
The energy input into each pixel of the ROI was tuned by changing the pixel dwell time (Dt); the time that the laser resides at each pixel in the ROI during patterning. Operating at the same intensity with varied (Dt) allowed for control over the laser fluence (F) as described by equation 3:
| (3) |
Supplementary Tables 3 and 4 provide a comprehensive list of the measured and calculated laser parameters described in equations 1–3 for the 20× (NA0.8) and 63× (NA1.4) objectives respectively.
Surface Fabrication and Pattern Characterization
Metalized coverslips were cleaned in dilute TL1 (6:1:1 MPH2O:NH4OH:H2O2) at 80°C for 1–2 min, rinsed with MPH2O, dried with N2, and immediately functionalized with a 2 mM ethanolic solution of OEG6 overnight, rinsed with ethanol, and dried with N2. Desired ROIs of the OEG SAM were thermally desorbed using the “Edit Bleach” software on a Zeiss 5Live laser scanning confocal microscope (Carl Zeiss, Munich, Germany) equipped with an automated stage. ROIs were exposed to a 532 nm laser focused through a 20× (NA 0.8) air or 63× (NA 1.4) oil immersion objective. Patterning with a 532 nm laser operating at 12.8 nJ μm−2 using 1,000 iterations per ROI allowed for the fabrication of 1×1 mm arrays in ~45 min. Patterning was performed in a 37°C, N2-rich environment to facilitate thiol desorption from the surface. For single ligand pattern characterization studies the first set of ROIs were functionalized with either a 2 mM ethanolic solution of 1% GRGDS in OEG6 or with AF405-conjugated HFN at 12.5 μg ml−1 in PBS. For multifaceted surface characterization the first set of ROIs was functionalized with a 2 mM ethanolic solution of GRGDS and the GRGDS fluorescently labeled with a 1:100 dilution of AF633 carboxylic acid succinimidyl ester in DMF with 100 mM Et3N for 10 hr. The surfaces were rinsed with DMF, rinsed with ethanol, and dried with N2. The surfaces were patterned again with a second set of ROIs, exposed to 500 μL of AF405-conjugated HFN at a concentration of 10–25 μg ml−1 in PBS for 30 min at 37°C, rinsed with PBS, rinsed with MPH2O, and dried with N2. The samples were imaged on a Zeiss 5Live confocal microscope (Carl Zeiss, Munich, Germany) with a 20× (NA0.8) air objective using 405 nm excitation and a LP420 emission filter for the AF405-conjugated HFN and with 635 nm excitation and a LP650 emission filter for the AF633 labeled GRGDS. Images of the HFN patterns were thresholded and each pattern was mathematically fit with an ellipse to determine the area, minor axis, and major axis using ImageJ (NIH, Bethesda, MD). To investigate the influence of the laser properties on feature size, the elliptical patterns were created with systematic variations in laser power, intensity, fluence, and the number of iterations per ROI. To determine the influence of Au surface thickness (thermal conductivity) on pattern feature size, the same experiments were performed on 6, 8, and 10 nm Au samples. The same patterning procedure was implemented to create surfaces for cell studies with the following exceptions: (1) a mixed SAM of 1% GRGD in OEG6 was used to create the GRGD patterns instead of 2 mM GRGDS and (2) fluorescent pre-labeling of the GRGD and HFN were excluded.
XPS Measurements
C1s, N1s, O1s, and Au4f spectra were obtained at a 45° takeoff angle using a PHI Quantera XPS scanning microprobe (Physical Electronics, Chanhassen, MN) equipped with a 114.8 W monochromatic aluminum X-ray source. High resolution scans were acquired with a 200 μm spot size, a pass energy of 26 eV, and a step size of 0.1 eV. All spectra were referenced to the Au4f peak at 84 eV. The high resolution spectra were deconvolved with Gaussian fits using PeakFit software (Systat Inc., Chicago, IL) to analyze the bond types present and to measure the area under each spectrum. Surface mapping XPS images were obtained using a 9 μm spot size and a pass energy of 140 eV with a step size of 15 eV.
Interferometry Measurements
Surface topography maps were acquired with a Zygo NewView 6200 (Zygo Inc., Middlefield, CT) white light interferometer. Surface topography images were acquired with a 50× objective and a z-scan of ± 20 μm. Five scans were averaged per viewfield and the resulting image flattened with a plane-fit compensation filter.
Cell Culture
HUVECs were cultured at 37°C and 5% CO2 in EGM-2 basal media supplemented with 10 ml fetal bovine serum, 0.2 ml hydrocortisone, 2 ml hFGF-B, 0.5 ml VEGF, 0.5 ml R3-IGF-1, 0.5 ml ascorbic acid, 0.5 ml hEGF, 0.5 ml gentamicin-amphotericin-B, and 0.5 ml heparin in a HFN coated (3 ml at 12.5 μg ml−1 for 30 min at 37°C) T-25 tissue culture flask. When 80% confluence was reached, the cells were trypsinized with 3 ml of 0.25% trypsin and 1 mM ethylenediaminetetraacetic acid in PBS at 37°C for 3 min. The cells were collected and centrifuged for 10 min. The cell pellet was re-suspended in full EGM-2 media and seeded on patterned surfaces at a density of ~15 cells mm−2. Passage 3 HUVECs were used for all experiments.
Time-Lapse DIC Microscopy & Fluorescent Immunolabeling & Imaging
After 6 hr in culture, HUVECs on multifaceted patterned surfaces were imaged with time-lapse differential interference contrast microscopy using the “time series” application on a Zeiss 5Live confocal microscope (Carl Zeiss, Munich, Germany). A 532 nm laser focused through a 20× (NA 0.8) objective operating at the lowest power setting was used for excitation and images were acquired at 2 min intervals for 2 hr.
After 16 hr in culture the HUVECs were fixed and labeled for HFN, actin, and vinculin. The surfaces were gently rinsed with warm PBS-T (PBS supplemented with 0.01% Tween 20), submerged into an ice-cold cytoskeleton stabilizing buffer (0.5% Triton X-100, 300 mM sucrose, 10 mM HEPES, 3 mM MgCl2, 50 mM NaCl in MPH2O, pH 6.8) for 1 min, submerged into ice-cold 4% paraformaldehyde in PBS-T, and placed in a 37°C water bath for 10 min. The samples were removed from the paraformaldehyde, rinsed with PBS-T, blocked with 10% goat serum in PBS-T for 1 hr, rinsed with PBS-T, and incubated with 500 μL of primary antibody solution (1 μg ml−1 rabbit anti-HFN, 5 μg ml−1 mouse anti-vinculin, 1:20 dilution AF532 phalloidin in PBS-T) O/N at 4°C. The samples were rinsed with PBS-T, incubated with 1 ml of secondary antibody solution (10 μg ml−1 AF488 goat anti-mouse and 10 μg ml−1 AF405 goat anti-rabbit in PBS-T) for 1 hr, rinsed with PBS-T, rinsed with MPH2O, and gently dried with N2. A drop of Prolong Antifade Gold was added to the surface and secured with a coverslip. The samples were imaged on a Zeiss 5Live confocal microscope. The AF405 labeled HFN was imaged with 405 nm excitation and a BP415–480 emission filter, the AF489 labeled vinculin with 488 nm excitation and a BP500–525 emission filter, and the AF532 labeled actin with 532 nm excitation and a LP550 emission filter. The brightness, contrast, and color balance were adjusted and merged images were created using ImageJ (NIH, Bethesda, MD).
Supplementary Material
Acknowledgments
We thank Tomasz Tkaczyk and Robert Kester for assistance with interferometry. This work was supported by grants from the National Institutes of Health (HL097520), and a NIH F31 Training Grant (J.S.M., EB005558). J.H.S. was supported by postdoctoral fellowships from the NIH Nanobiology Training Program of the Keck Center of the Gulf Coast Consortia and from HHMI.
References
- 1.Sniadecki N, Desai RA, Ruiz SA, Chen CS. Ann Biomed Eng. 2006;34:59. doi: 10.1007/s10439-005-9006-3. [DOI] [PubMed] [Google Scholar]
- 2.Senaratne W, Andruzzi L, Ober CK. Biomacromolecules. 2005;6:2427. doi: 10.1021/bm050180a. [DOI] [PubMed] [Google Scholar]
- 3.Levicky R, Herne TM, Tarlov MJ, Satija SK. J Am Chem Soc. 1998;120:9787. [Google Scholar]
- 4.Roberts C, Chen CS, Mrksich M, Martichonok V, Ingber DE, Whitesides GM. J Am Chem Soc. 1998;120:6548. [Google Scholar]
- 5.Ostuni E, Yan L, Whitesides GM. Colloid Surf B-Biointerfaces. 1999;15:3. [Google Scholar]
- 6.Houseman BT, Gawalt ES, Mrksich M. Langmuir. 2003;19:1522. [Google Scholar]
- 7.Singhvi R, Kumar A, Lopez GP, Stephanopoulos GN, Wang DIC, Whitesides GM, Ingber DE. Science. 1994;264:696. doi: 10.1126/science.8171320. [DOI] [PubMed] [Google Scholar]
- 8.McBeath R, Pirone DM, Nelson CM, Bhadriraju K, Chen CS. Dev Cell. 2004;6:483. doi: 10.1016/s1534-5807(04)00075-9. [DOI] [PubMed] [Google Scholar]
- 9.Kilian KA, Bugarija B, Lahn BT, Mrksich M. Proc Natl Acad Sci U S A. 2010;107:4872. doi: 10.1073/pnas.0903269107. [DOI] [PMC free article] [PubMed] [Google Scholar]
- 10.Doyle AD, Wang FW, Matsumoto K, Yamada KM. J Cell Biol. 2009;184:481. doi: 10.1083/jcb.200810041. [DOI] [PMC free article] [PubMed] [Google Scholar]
- 11.Xia N, Thodeti CK, Hunt TP, Xu QB, Ho M, Whitesides GM, Westervelt R, Ingber DE. Faseb J. 2008;22:1649. doi: 10.1096/fj.07-090571. [DOI] [PubMed] [Google Scholar]
- 12.Brock A, Chang E, Ho CC, LeDuc P, Jiang XY, Whitesides GM, Ingber DE. Langmuir. 2003;19:1611. doi: 10.1021/la026394k. [DOI] [PubMed] [Google Scholar]
- 13.Thery M, Racine V, Piel M, Pepin A, Dimitrov A, Chen Y, Sibarita JB, Bornens M. Proc Natl Acad Sci U S A. 2006;103:19771. doi: 10.1073/pnas.0609267103. [DOI] [PMC free article] [PubMed] [Google Scholar]
- 14.Goffin JM, Pittet P, Csucs G, Lussi JW, Meister JJ, Hinz B. J Cell Biol. 2006;172:259. doi: 10.1083/jcb.200506179. [DOI] [PMC free article] [PubMed] [Google Scholar]
- 15.Bosman FT, Stamenkovic I. J Pathol. 2003;200:423. doi: 10.1002/path.1437. [DOI] [PubMed] [Google Scholar]
- 16.Clark EA, Brugge JS. Science. 1995;268:233. doi: 10.1126/science.7716514. [DOI] [PubMed] [Google Scholar]
- 17.Liu YQ, Senger DR. Faseb J. 2004;18:457. doi: 10.1096/fj.03-0948com. [DOI] [PubMed] [Google Scholar]
- 18.Bernard A, Renault JP, Michel B, Bosshard HR, Delamarche E. Adv Mater. 2000;12:1067. [Google Scholar]
- 19.Chiu DT, Jeon NL, Huang S, Kane RS, Wargo CJ, Choi IS, Ingber DE, Whitesides GM. Proc Natl Acad Sci U S A. 2000;97:2408. doi: 10.1073/pnas.040562297. [DOI] [PMC free article] [PubMed] [Google Scholar]
- 20.Tien J, Nelson CM, Chen CS. Proc Natl Acad Sci U S A. 2002;99:1758. doi: 10.1073/pnas.042493399. [DOI] [PMC free article] [PubMed] [Google Scholar]
- 21.Yeo WS, Mrksich M. Langmuir. 2006;22:10816. doi: 10.1021/la061212y. [DOI] [PMC free article] [PubMed] [Google Scholar]
- 22.Ryan D, Parviz BA, Linder V, Semetey V, Sia SK, Su J, Mrksich M, Whitesides GM. Langmuir. 2004;20:9080. doi: 10.1021/la048443u. [DOI] [PubMed] [Google Scholar]
- 23.Yang ZP, Frey W, Oliver T, Chilkoti A. Langmuir. 2000;16:1751. [Google Scholar]
- 24.Hook AL, Voelcker NH, Thissen H. Acta Biomater. 2009;5:2350. doi: 10.1016/j.actbio.2009.03.040. [DOI] [PubMed] [Google Scholar]
- 25.Demers LM, Ginger DS, Park SJ, Li Z, Chung SW, Mirkin CA. Science. 2002;296:1836. doi: 10.1126/science.1071480. [DOI] [PubMed] [Google Scholar]
- 26.Takehara K, Yamada S, Ide Y. J Electroanal Chem. 1992;333:339. [Google Scholar]
- 27.Shadnam MR, Kirkwood SE, Fedosejevs R, Amirfazli A. Langmuir. 2004;20:2667. doi: 10.1021/la0354584. [DOI] [PubMed] [Google Scholar]
- 28.Rhinow D, Hampp NA. IEEE Trans Nanobiosci. 2006;5:188. doi: 10.1109/tnb.2006.880830. [DOI] [PubMed] [Google Scholar]
- 29.Meyyappan S, Shadnam MR, Amirfazli A. Langmuir. 2008;24:2892. doi: 10.1021/la702114c. [DOI] [PubMed] [Google Scholar]
- 30.Rhinow D, Hampp NA. Adv Mater. 2007;19:1967. [Google Scholar]
- 31.Iversen L, Younes-Metzler O, Martinez KL, Stamou D. Langmuir. 2009;25:12819. doi: 10.1021/la901872g. [DOI] [PubMed] [Google Scholar]
- 32.Doron-Mor I, Barkay Z, Filip-Granit N, Vaskevich A, Rubinstein I. Chem Mat. 2004;16:3476. [Google Scholar]
- 33.Xenogiannopoulou E, Iliopoulos K, Couris S, Karakouz T, Vaskevich A, Rubinstein I. Adv Funct Mater. 2008;18:1281. [Google Scholar]
- 34.Feng B, Li ZX, Zhang X. Thin Solid Films. 2009;517:2803. [Google Scholar]
- 35.Shadnam MR, Kirkwood SE, Fedosejevs R, Amirfazli A. J Phys Chem B. 2005;109:11996. doi: 10.1021/jp0500642. [DOI] [PubMed] [Google Scholar]
- 36.von der Mark K, Park J, Bauer S, Schmuki P. Cell Tissue Res. 2010;339:131. doi: 10.1007/s00441-009-0896-5. [DOI] [PubMed] [Google Scholar]
- 37.Schlenoff JB, Li M, Ly H. J Am Chem Soc. 1995;117:12528. [Google Scholar]
- 38.Zhang X, Chu SS, Ho JR, Grigoropoulos CP. Applied Physics a-Materials Science & Processing. 1997;64:545. [Google Scholar]
- 39.Kelly R, Cuomo JJ, Leary PA, Rothenberg JE, Braren BE, Aliotta CF. Nucl Instrum Methods Phys Res Sect B-Beam Interact Mater Atoms. 1985;9:329. [Google Scholar]
- 40.Hynes RO. Cell. 1992;69:11. doi: 10.1016/0092-8674(92)90115-s. [DOI] [PubMed] [Google Scholar]
- 41.Zaidel-Bar R, Cohen M, Addadi L, Geiger B. Biochem Soc Trans. 2004;32:416. doi: 10.1042/BST0320416. [DOI] [PubMed] [Google Scholar]
- 42.Alexandrova AY, Arnold K, Schaub S, Vasiliev JM, Meister JJ, Bershadsky AD, Verkhovsky AB. PLoS One. 2008;3:9. doi: 10.1371/journal.pone.0003234. [DOI] [PMC free article] [PubMed] [Google Scholar]
- 43.Choi CK, Vicente-Manzanares M, Zareno J, Whitmore LA, Mogilner A, Horwitz AR. Nat Cell Biol. 2008;10:1039. doi: 10.1038/ncb1763. [DOI] [PMC free article] [PubMed] [Google Scholar]
- 44.Zaidel-Bar R, Itzkovitz S, Ma’ayan A, Iyengar R, Geiger B. Nat Cell Biol. 2007;9:858. doi: 10.1038/ncb0807-858. [DOI] [PMC free article] [PubMed] [Google Scholar]
- 45.Slater JH, Frey W. J Biomed Mater Res Part A. 2008;87A:176. doi: 10.1002/jbm.a.31725. [DOI] [PubMed] [Google Scholar]
- 46.Hartmann N, Balgar T, Bautista R, Franzka S. Surf Sci. 2006;600:4034. [Google Scholar]
- 47.Balgar T, Franzka S, Hartmann N. Applied Physics a-Materials Science & Processing. 2006;82:689. [Google Scholar]
- 48.Ehrlich DJ, Tsao JY. Appl Phys Lett. 1984;44:267. [Google Scholar]
- 49.Klingebiel B, Scheres L, Franzka S, Zuilhof H, Hartmann N. Langmuir. 2010;26:6826. doi: 10.1021/la903926z. [DOI] [PubMed] [Google Scholar]
- 50.Balgar T, Franzka S, Hartmann N, Hasselbrink E. Langmuir. 2004;20:3525. doi: 10.1021/la040006s. [DOI] [PubMed] [Google Scholar]
- 51.Garg N, Carrasquillo-Molina E, Lee TR. Langmuir. 2002;18:2717. [Google Scholar]
- 52.Lamb BM, Park S, Yousaf MN. Langmuir. 2010;26:12817. doi: 10.1021/la1022642. [DOI] [PubMed] [Google Scholar]
- 53.Smith JT, Tomfohr JK, Wells MC, Beebe TP, Kepler TB, Reichert WM. Langmuir. 2004;20:8279. doi: 10.1021/la0489763. [DOI] [PubMed] [Google Scholar]
- 54.Reinhart-King CA, Dembo M, Hammer DA. Biophys J. 2005;89:676. doi: 10.1529/biophysj.104.054320. [DOI] [PMC free article] [PubMed] [Google Scholar]
- 55.Rajagopalan P, Marganski WA, Brown XQ, Wong JY. Biophys J. 2004;87:2818. doi: 10.1529/biophysj.103.037218. [DOI] [PMC free article] [PubMed] [Google Scholar]
- 56.Gaudet C, Marganski WA, Kim S, Brown CT, Gunderia V, Dembo M, Wong JY. Biophys J. 2003;85:3329. doi: 10.1016/S0006-3495(03)74752-3. [DOI] [PMC free article] [PubMed] [Google Scholar]
- 57.Lee MH, Ducheyne P, Lynch L, Boettiger D, Composto RJ. Biomaterials. 2006;27:1907. doi: 10.1016/j.biomaterials.2005.11.003. [DOI] [PubMed] [Google Scholar]
- 58.Houseman BT, Mrksich M. Biomaterials. 2001;22:943. doi: 10.1016/s0142-9612(00)00259-3. [DOI] [PubMed] [Google Scholar]
- 59.Li LY, Chen SF, Zheng J, Ratner BD, Jiang SY. J Phys Chem B. 2005;109:2934. doi: 10.1021/jp0473321. [DOI] [PubMed] [Google Scholar]
- 60.Prime KL, Whitesides GM. J Am Chem Soc. 1993;115:10714. [Google Scholar]
- 61.Zhu B, Eurell T, Gunawan R, Leckband D. J Biomed Mater Res. 2001;56:406. doi: 10.1002/1097-4636(20010905)56:3<406::aid-jbm1110>3.0.co;2-r. [DOI] [PubMed] [Google Scholar]
- 62.Palin E, Liu HN, Webster TJ. Nanotechnology. 2005;16:1828. [Google Scholar]
- 63.Elias KL, Price RL, Webster TJ. Biomaterials. 2002;23:3279. doi: 10.1016/s0142-9612(02)00087-x. [DOI] [PubMed] [Google Scholar]
- 64.Dalby MJ, Giannaras D, Riehle MO, Gadegaard N, Affrossman S, Curtis ASG. Biomaterials. 2004;25:77. doi: 10.1016/s0142-9612(03)00475-7. [DOI] [PubMed] [Google Scholar]
- 65.Miller DC, Haberstroh KM, Webster TJ. J Biomed Mater Res Part A. 2005;73A:476. doi: 10.1002/jbm.a.30318. [DOI] [PubMed] [Google Scholar]
- 66.Miller JS, Bethencourt MI, Hahn M, Lee TR, West JL. Biotechnol Bioeng. 2006;93:1060. doi: 10.1002/bit.20809. [DOI] [PubMed] [Google Scholar]
Associated Data
This section collects any data citations, data availability statements, or supplementary materials included in this article.