Abstract
Purpose
To identify dynamic optical imaging features that associate with the degree of pathologic response in patients with breast cancer during neoadjuvant chemotherapy (NAC).
Materials and Methods
Of 40 patients with breast cancer who participated in a longitudinal study between June 2011 and March 2016, 34 completed the study. There were 13 patients who obtained a pathologic complete response (pCR) and 21 patients who did not obtain a pCR. Imaging data from six subjects were excluded from the study because either the patients dropped out of the study before it was finished or there was an instrumentation malfunction. Two weeks into the treatment regimen, three-dimensional images of both breasts during a breath hold were acquired by using dynamic diffuse optical tomography. Features from the breath-hold traces were used to distinguish between response groups. Receiver operating characteristic (ROC) curves and sensitivity analysis were used to determine the degree of association with 5-month treatment outcome.
Results
An ROC curve analysis showed that this method could identify patients with a pCR with a positive predictive value of 70.6% (12 of 17), a negative predictive value of 94.1% (16 of 17), a sensitivity of 92.3% (12 of 13), a specificity of 76.2% (16 of 21), and an area under the ROC curve of 0.85.
Conclusion
Several dynamic optical imaging features obtained within 2 weeks of NAC initiation were identified that showed statistically significant differences between patients with pCR and patients without pCR as determined 5 months after treatment initiation. If confirmed in a larger cohort prospective study, these dynamic imaging features may be used to predict treatment outcome as early as 2 weeks after treatment initiation.
© RSNA, 2018
Introduction
Breast cancer affects one in eight women in her lifetime. In the United States, there are approximately 230 000 women with invasive breast cancer, and about 40 000 die every year (1). Neoadjuvant chemotherapy (NAC) is widely applied as standard treatment for patients with newly diagnosed operable invasive breast cancer (2). The goal of NAC is to shrink the breast tumor prior to surgical intervention. As a result of NAC, an inoperable cancer may become operable, or surgery for an operable cancer can be converted from mastectomy to breast-conserving therapy. In addition, one of the advantages of NAC is that the responsiveness of a patient’s breast tumor to systematic therapy can be assessed prepoperatively. Pathologic response to NAC also associates with breast cancer recurrence and survival. Ideally a pathologic complete response (pCR), meaning the complete pathologic disappearance of the tumor before surgery, is achieved. Studies have shown that patients with a pCR have a 90%–95% 5-year survival rate, while 5-year survival rates for patients without pCR are typically less than 80% (3). Depending on the exact definition, pCR is achieved in only 15%–40% of women. Recent studies have shown that patients who do not show an early response may benefit from a change in treatment regimen (4–9). Therefore, it would be highly desirable to reliably determine who will and will not respond to NAC early in the treatment (10,11).
Over the past decade, diffuse optical tomography (DOT) has emerged as an imaging modality that may be used in breast cancer imaging and is potentially capable of early prediction of treatment outcome (11–13). DOT uses optical transmission measurements with nonionizing, low-intensity near-infrared light to generate three-dimensional maps of various tissue parameters. Optical property contrast from endogenous chromophores (oxyhemoglobin [HbO2], deoxyhemoglobin [Hb], water, and lipid) can distinguish malignant from normal tissue (14–17). For example, it has been reported that total hemoglobin levels, which relate to tumor blood vessel density, are twice as high in malignant tumors as in benign breast lesions (18). Furthermore, in small-animal models of tumors, it has been reported that vascular changes precede measurable structure changes (19).
However, previous optical imaging studies have included patients receiving multiple different heterogeneous NAC regimens (20–23,27,29–34). Some studies even included chemotherapy and radiation therapy (32,34). The use of different treatment regimens for patients in the same cohort may confound some of the obervations. For example, different drugs have differing antiangiogenic effects and may affect optical signals in disparate ways. Recently, Schaafsma et al (35) reported results in 22 patients who were all treated with the same NAC protocol. All patients received six cycles of docetaxel, doxorubicin, and cyclophosphamide (TAC) with or without zoledronic acid. Using a non-tomographic diffuse optical spectroscopy system, they investigated the tumor-bearing breast. They found a statistically significant difference in the decrease in HbO2 and Hb concentrations after the first cycle of NAC between patients with a pCR and those with a partial response.
Our group has previously used this dynamic diffuse optical tomography (DDOT) system to observe the hemodynamics of different tumors to determine if a subject had a benign or malignant tumor or no tumor at all. The contrast mechanism that was used for that diagnostic study was a simple breath hold. The quantified hemodynamic time traces showed variation between the healthy and tumor-bearing breasts of patients compared with those of healthy subjects, which showed similar traces for both breast. Additionally, we observed a more pronounced change in deoxyhemoglobin (Δ[Hb]%) in the tumor at the 15-second post–breath hold (15).
Given these promising results, we hypothesized that we will be able to observe the vascular changes that occur in tumors by using DDOT early in treatment. The purpose of the study was to identify optical biomarkers that can be used to predict pathologic response in patients with breast cancer during NAC.
Materials and Methods
Study Subjects and Procedures
This study was compliant with the Health Insurance Portability and Accountability Act and was approved by the institutional review board. Each subject gave written informed consent to the study. Between June 2011 and March 2016, we recruited 40 women (mean age, 42.2 years ± 8.2) over the age of 18 who had been given a diagnosis of stage II or stage III breast cancer in a study in which patients were enrolled prospectively (therefore, we did not know whether they would respond to treatment). The diagnosis was determined with x-ray mammography and biopsy. The primary tumor had to be at least 1 cm in diameter. Women with metastases were not eligible. All women in the study received the same treatment: 12 weekly cycles of a taxane (paclitaxel, docetaxel, or abraxane) followed by four cycles of doxorubicin and cyclophosphamide every 2 weeks with growth-factor support. At the end of the treatment, breast cancer surgery was performed, and any remaining tumor mass was removed and evaluated at histopathologic examination. For each person, the residual cancer burden (RCB) score GRCB was calculated (36). A person was considered to have a pCR if the GRCB ≤ 0.5 (RCB class 0). The RCB score was further classified as RCB-I (0.5 < GRCB ≤ 1.36), RCB-II (1.36 < GRCB ≤ 3.28), and RCB-III (GRCB > 3.28) (38). Patients identified as belonging to the RCB-III group were the least responsive to NAC.
DDOT Instrumentation
DDOT measurements were performed in all patients just before treatment started and 2 weeks later. The machine used for this study was a continuous-wave dynamic imaging system that provides full three-dimentional tomographic images of both breasts at a rate faster than 1 second. A more detailed description of the system can be found in Appendix E1 (online) and in previous reports (14,37,38). Imaging was performed by researchers (J.E.G. and M.F., with 5 years of experience in optical imaging systems or M.A., with 2 years of experience in optical imaging), an oncologist (E.A.L., with 3 years of experience), or a research coordinator (J.C., with 2 years of experience).
Imaging Procedure
After a patient’s breasts were placed in the imaging probe, we asked her to remain as still as possible during the image acquisition. Imaging began with a baseline measurement of about 2 minutes. Next, we imaged the patient while she was holding her breath. We asked patients to hold their breath for up to 30 seconds. All patients were able to hold their breath for at least 15 seconds, and all data were included in our analysis. Imaging continued for another 90 seconds after the patient concluded her breath hold and started breathing again. Each patient performed two or three breath-hold cycles. The total time for the entire imaging procedure was 5–10 minutes (Fig 1).
Figure 1:
Timeline for subject imaging. At the beginning, the patient remains stationary for the first 2 minutes. Subsequently, subjects perform three breath holds (BH) for about 30 seconds and are given 90 seconds to recover. Data selection for dynamic reconstructions is performed 30 seconds before one of the breath holds for the baseline. Each frame of the breath hold and 30 seconds of recovery time are reconstructed to find the percentage change in oxy- and deoxyhemoglobin from the breath-hold baseline.
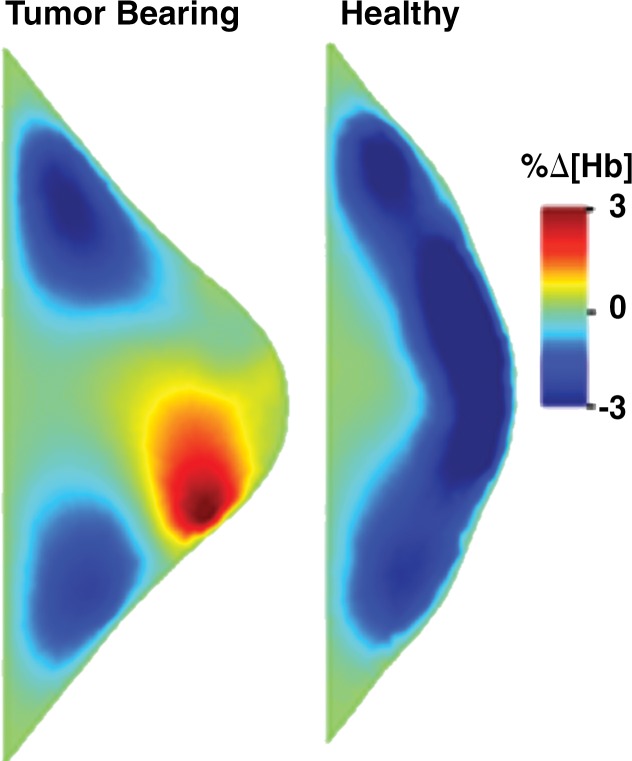
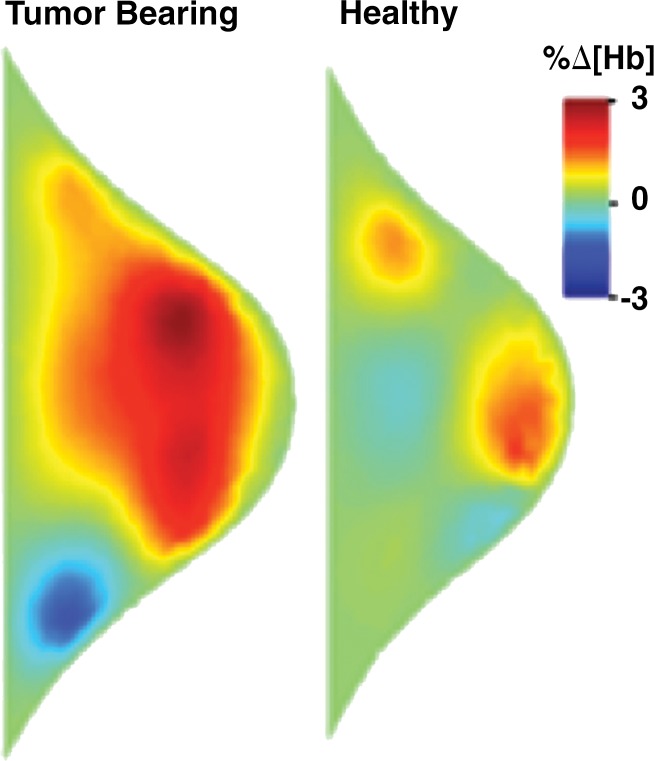
After the data acquisition was completed, data from one of the breath holds was selected for three-dimensional image reconstruction by one of the researchers (J.E.G., M.A.) for analysis. The second breath hold was usually chosen, unless substantial patient motion or coughing was observed, in which case the third breath hold was used. Approximately 2–3 images per second were reconstructed (depending on the number of sources used in imaging, the frame rate was 1.74 frames/sec [32 sources] to 3.09 frames/sec [18 sources]). Averaged data from 30 seconds before the breath hold were used as a baseline against which changes in deoxy- and oxyhemoglobin (SHb(t) = %Δ[Hb](t) and SHbO2(t) = %Δ[HbO2](t)) were calculated. Data from 30 seconds after the conclusion of the breath hold were used to obtain the recovery images (Fig 1). Figures 2 and 3 show examples of images obtained in patients with breast cancer.
Figure 2a:
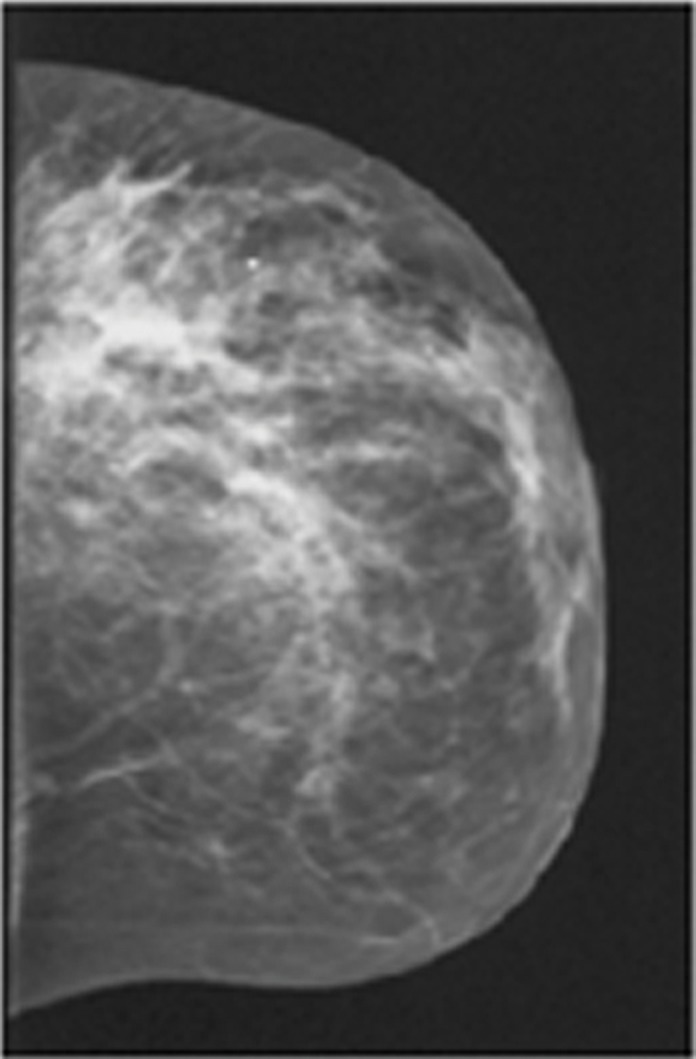
Images in a 46-year-old postmenopausal woman with a poorly differentiated invasive ductal carcinoma with a pathologic complete response to neoadjuvant chemotherapy (NAC) who was assigned to RCB class 0 (RCB-0). Her baseline tumor had an initial maximum diameter of 2.9 cm as determined at mammography (a clinical palpation examination found the diameter to be 5.5 cm). Image a displays an axial mammogram obtained prior to chemotherapy. Images in b are sagittal diffuse optical tomography images obtained in the left and right breasts just before therapy. The images displayed refer to a time point of 15 seconds after the breath hold and show the percentage change in deoxyhemoglobin (%Δ[Hb]). Finally, image c shows time-dependent signal traces in response to a 30-second breath hold for the tumor region obtained at dynamic diffuse optical tomography just before the start of NAC (baseline) and 2 weeks after treatment initiation.
Figure 3a:
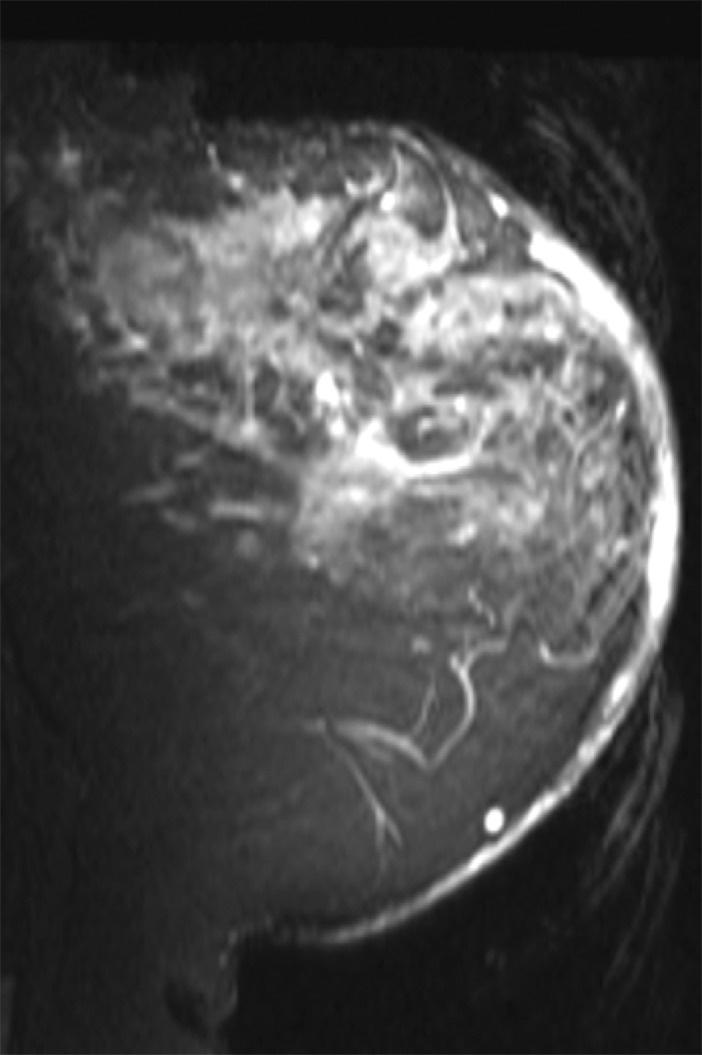
Images in a 61-year-old postmenopausal woman with a moderately differentiated invasive lobular carcinoma show a patient with no response (RCB-III) to neoadjuvant chemotherapy (NAC). With MR imaging, it was determined that she had a large tumor of 9.5 cm in diameter at the start of the therapy. She did not respond well to NAC and was classified as RCB-III at the time of surgery. Image a displays an axial MR image obtained prior to chemotherapy. Image b are sagittal diffuse optical tomography images obtained from the left and right breasts just before therapy. The images displayed refer to a time point of 15 seconds after the breath hold and show the percentage change in deoxyhemoglobin (%Δ[Hb]). Finally, image c shows time-dependent signal traces in response to a 30-second breath hold for the tumor region obtained from dynamic diffuse optical tomography just before the start of NAC (baseline) and 2 weeks after treatment initiation.
Figure 2b:
Images in a 46-year-old postmenopausal woman with a poorly differentiated invasive ductal carcinoma with a pathologic complete response to neoadjuvant chemotherapy (NAC) who was assigned to RCB class 0 (RCB-0). Her baseline tumor had an initial maximum diameter of 2.9 cm as determined at mammography (a clinical palpation examination found the diameter to be 5.5 cm). Image a displays an axial mammogram obtained prior to chemotherapy. Images in b are sagittal diffuse optical tomography images obtained in the left and right breasts just before therapy. The images displayed refer to a time point of 15 seconds after the breath hold and show the percentage change in deoxyhemoglobin (%Δ[Hb]). Finally, image c shows time-dependent signal traces in response to a 30-second breath hold for the tumor region obtained at dynamic diffuse optical tomography just before the start of NAC (baseline) and 2 weeks after treatment initiation.
Figure 3b:
Images in a 61-year-old postmenopausal woman with a moderately differentiated invasive lobular carcinoma show a patient with no response (RCB-III) to neoadjuvant chemotherapy (NAC). With MR imaging, it was determined that she had a large tumor of 9.5 cm in diameter at the start of the therapy. She did not respond well to NAC and was classified as RCB-III at the time of surgery. Image a displays an axial MR image obtained prior to chemotherapy. Image b are sagittal diffuse optical tomography images obtained from the left and right breasts just before therapy. The images displayed refer to a time point of 15 seconds after the breath hold and show the percentage change in deoxyhemoglobin (%Δ[Hb]). Finally, image c shows time-dependent signal traces in response to a 30-second breath hold for the tumor region obtained from dynamic diffuse optical tomography just before the start of NAC (baseline) and 2 weeks after treatment initiation.
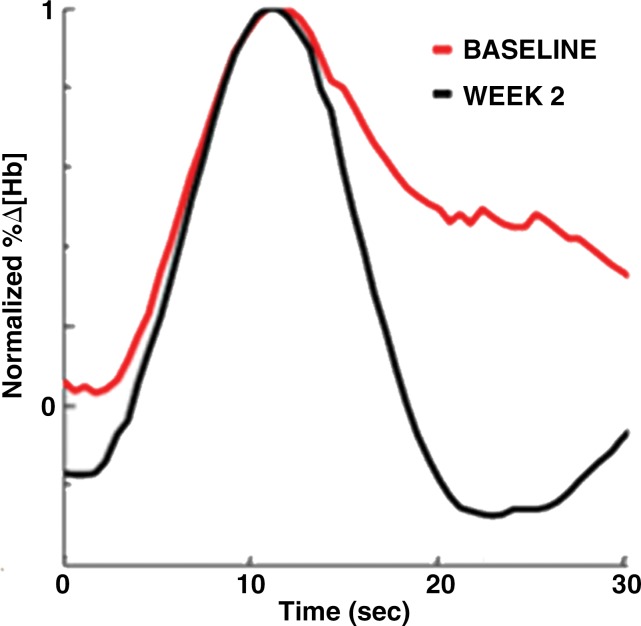
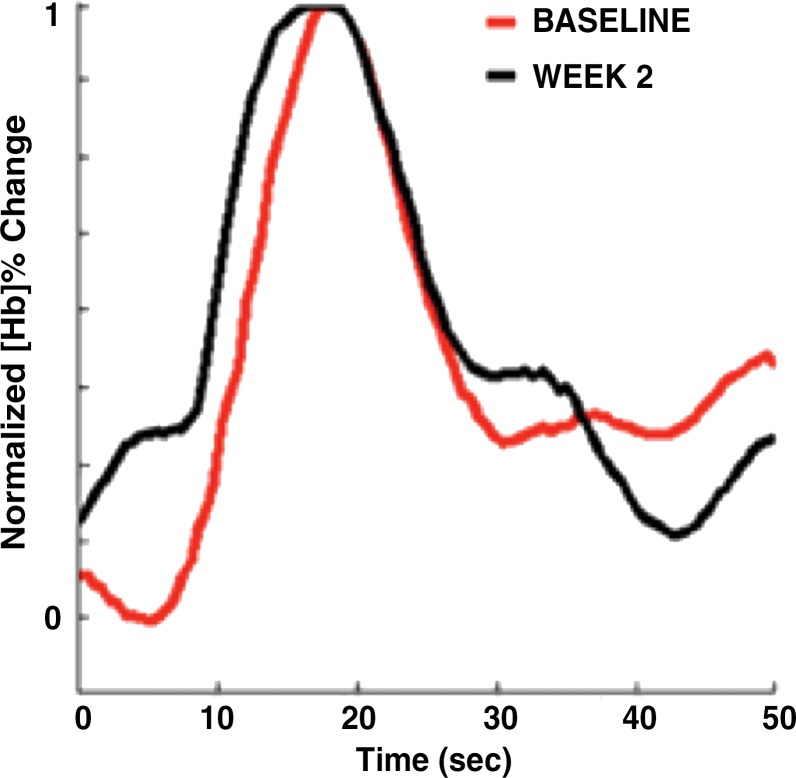
To capture the features of the time-dependent response curves, SHb(t) and SHbO2(t) (see Figs 2c and 3c) in a more quantitative way, we used the following nine parameters, many of which have been used in other dynamic imaging modalities and previous studies (15,39): initial enhancement (IE) of the breath hold, post-initial enhancement (PIE), rise slope (mrise), fall slope (mfall), rise rate (qrise), washout rate (qfall), the peak value of the tumor trace (Speak), and the normalized maximum peak value (NMPV). As the ninth feature, we calculated the correlation coefficient (CC) between the time traces observed in the healthy and tumor-bearing breasts in corresponding volume of interest. (See Appendix E1 [online] for a detailed explanation of how these parameters were extracted from SHb(t) and SHbO2(t)).
Figure 2c:
Images in a 46-year-old postmenopausal woman with a poorly differentiated invasive ductal carcinoma with a pathologic complete response to neoadjuvant chemotherapy (NAC) who was assigned to RCB class 0 (RCB-0). Her baseline tumor had an initial maximum diameter of 2.9 cm as determined at mammography (a clinical palpation examination found the diameter to be 5.5 cm). Image a displays an axial mammogram obtained prior to chemotherapy. Images in b are sagittal diffuse optical tomography images obtained in the left and right breasts just before therapy. The images displayed refer to a time point of 15 seconds after the breath hold and show the percentage change in deoxyhemoglobin (%Δ[Hb]). Finally, image c shows time-dependent signal traces in response to a 30-second breath hold for the tumor region obtained at dynamic diffuse optical tomography just before the start of NAC (baseline) and 2 weeks after treatment initiation.
Figure 3c:
Images in a 61-year-old postmenopausal woman with a moderately differentiated invasive lobular carcinoma show a patient with no response (RCB-III) to neoadjuvant chemotherapy (NAC). With MR imaging, it was determined that she had a large tumor of 9.5 cm in diameter at the start of the therapy. She did not respond well to NAC and was classified as RCB-III at the time of surgery. Image a displays an axial MR image obtained prior to chemotherapy. Image b are sagittal diffuse optical tomography images obtained from the left and right breasts just before therapy. The images displayed refer to a time point of 15 seconds after the breath hold and show the percentage change in deoxyhemoglobin (%Δ[Hb]). Finally, image c shows time-dependent signal traces in response to a 30-second breath hold for the tumor region obtained from dynamic diffuse optical tomography just before the start of NAC (baseline) and 2 weeks after treatment initiation.
Statistical Analysis
For the statistical analysis of the data ,we used the IBM SPSS Statistics software package. Given the larger number of features considered (nine parameters that describe SHb(t) and SHbO2(t)), we first performed a Pearson correlation to determine if there were linear dependencies on any pair of parameters (Appendix E1 [online]). We found particularly strong correlations (|Pcorr| > .75) between all Hb and HbO2 pairs, meaning that the nine features extracted from the SHb(t) traces and the related nine features extracted from SHbO2(t) traces showed very strong correlations. Hence, going forward, we considered only the nine features deducted from SHb(t) traces. Other strong correlations (|Pcorr| > .5, with significance at the .01 level) were found between mrise and Speak, qfall and PIE, mfall and mrise and mfall and PIE, and qrise and NMPV. Weaker correlations (.5 > |Pcorr| > .35, with significance at the .05 level) were determined for mrise and IE, mfall and qfall, qfall and IE, and PIE and Speak.
Considering feature pairs that were significantly correlated (Pcorc > .5), left only five features (out of the total of 18) that could be considered independent. Applying a Bonferroni correction for multiple comparison resulted in a 95% confidence interval for P < .01 (= .05/5); 90% confidence intervals were reached for P < .02 (= .1/5).
Means and standard deviations were determined for each of the nine time-trace parameters. One-way analyses of variance were performed for comparison of more than two groups. Otherwise, two-way unpaired student t tests between designated groups were performed. Receiver operating characteristic (ROC) curves were developed for specified features. The sensitivity, specificity, area under the ROC curve, accuracy, positive predictive value, and negative predictive value were determined from the Youden index of the ROC curve. Sensitivity in this article denotes the percentage of the more responsive group that was diagnosed correctly. Conversely, the specificity denotes the percentage of subjects in the least responsive group that were categorized correctly. The positive predictive value is the percentage of subjects who were classified in the responsive group that were truly responsive subjects. The negative predictive value is the percentage of the subjects who were classified in the least responsive group who truly were in the least responsive group.
Results
Patient Summary
Of the 40 patients enrolled in the study, six patients are not included in the analysis presented here. One patient completely stopped NAC midway through the therapy and was removed from the study. Two subjects missed their week-2 DDOT imaging time point. For another two subjects, instrumentation failure during the imaging session resulted in corrupted data sets that could not be used. Finally, one subject opted to receive radiation therapy in addition to traditional NAC therapy and therefore was removed from the analysis.
The average age of the remaining 34 patients was 49 years. There were 19 premenopausal women and 15 postmenopausal women. Four women had a diagnosis of invasive lobular carcinoma, and 29 patients had invasive ductal carcinoma. One subject had mixed invasive lobular and ductal carcinoma. Using the largest measurable dimension as the size metric, the average initial tumor size was 4.6 cm ± 2.8 based on baseline clinical examinations. After NAC, 13 patients were classified as RCB-0 (ie, pCR). Two patients were classified as RCB-I, 13 as RCB-II, and six as RCB-III. Table E1 (online) provides a full summary of the clinical and pathologic features.
Statistical Analysis of Hemodynamic Parameters
Analysis of hemoglobin traces observed at week 2—analysis of variance and P values.—Table 1 shows the data for all four cohorts (RCB-0, I, II, and III) for all nine features (IE, PIE, mrise, mfall, qrise, qfall, Speak, NMPV, and CC) for the SHb(t) response curves 2 weeks after treatment initiation. The mrise, Speak, NMPV, and CC did not show statistically significant differences between the response groups. The features that showed some significant differences (P < .01 for 95% confidence interval and P < .02 for 90% confidence intervals) between groups were IE (P < .013 for RCB 0, I, and II vs RCB III), PIE (P < .004 for RCB 0 vs RCB I, II, and III and P < .007 for RCB 0 and I vs RCB II and III), mfall (P < .006 for RCB 0 vs RCB I, II, and III and P < .002 for RCB 0 and I vs RCB II and III), and qfall (P < .003 for RCB 0 vs RCB I, II, and III and P < .015 for RCB 0, I vs RCB II and III).
Table 1.
Summary of Mean Values for All Four RCB Classes for Features Derived from Time Traces of the Hemodynamic Responses, SHb(t) (Percentage Change in Deoxyhemoglobin Signal), Obtained 2 Weeks after the Initial Treatment with Taxane

Note.—Unless otherwise specified, data are means ± standard deviations. ANOVA = analysis of variance, CC = correlation coefficient, IE = initial enhancement, mfall = fall slope, mrise = rise slope, NMPV = normalized maximum peak value, pCR = pathologic complete response, PIE = postinitial enhancement, qfall = washout rate, qrise = rise rate, RCB = residual cancer burden, SPeak = peak signal. P < .01 indicates a significant difference (95% confidence intervals–90% confidence intervals are reached for P < .02).
Sensitivity analysis for selected week-2 features.—Because the difference in qfall for SHb traces between patients with a pCR (RCB 0) and those without a pCR (RCB I, II, and III) produced the strongest significant distinction (P < .003), we created a receiver operating characteristic (ROC) curve for this variable. The sensitivity, specificity, and accuracy were 92.3% (12 of 13 subjects), 76% (16 of 21 subjects), and 82.4% (28 of 34 subjects), respectively (cutoff point for qfall = 0.09). The area under the ROC curve was 0.85, and the positive predictive value was 70.6% (12 of 17 subjects), while the negative predictive value was 94.1% (16 of 21 subjects). Results of similar ROC analyses for mfall, PIE, IE, and qrise for SHb are shown in Table 2.
Table 2.
Summary of Binary Classification Test for Features That Showed the Most Significant Differences between Subject Groups Based on an Analysis of the Data Obtained at Week 2 from the Percentage Change in Deoxyhemoglobin Signal, SHb(t)
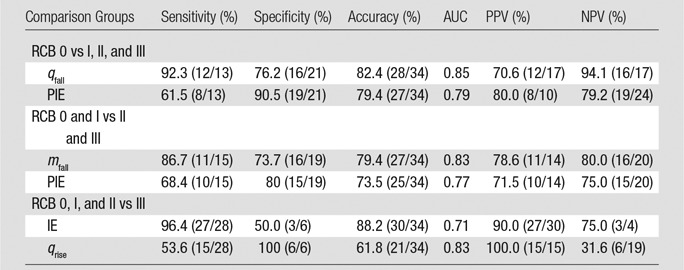
Note.—Please see the rightmost three columns of Table 1 for the most significant differences. Data in parentheses are raw data. AUC = area under the receiver operating characteristic curve, IE = initial enhancement, mfall = fall slope, NPV = negative predictive value, pCR = pathologic complete response, PIE = postinitial enhancement, PPV = positive predictive value, qfall = washout rate, qrise = rise rate, RCB = residual cancer burden.
To specifically find patients with RCB III patients, the best features seem ed to be IE (P < .013) and qrise (P < .027) for the SHb traces. The areas under the receiver operating characteristic curve for IE and qrise were 0.71 and 0.83, respectively. The parameter IE yielded a high sensitivity of 96.4% (27 of 28) and a high positive predictive value of 90.0% (27 of 30), while the use of qrise yielded a high specificity of 100% (six of six) and a high PPV of 100% (15 of 15).
Analysis of differences between baseline and week-2 imaging data.—In addition to evaluating the hemoglobin traces observed at week 2, we also analyzed differences between data obtained at baseline (week 0) and those obtained at week 2 (Table 3). In this table, the most notable entries are the low P values for Δmfall determined from SHb traces. Of the six groupings considered, only RCB 0, I, and II versus RCB III showed a nonsignificant statistical difference (P < .64). For the clinically meaningful comparison of RCB 0 versus RCB I, II, and III, patients with pCR showed an increase in Δmfall compared with patients without pCR subject (SHb: P < .0004). For Δmfall for SHb we found that the sensitivity, specificity, and accuracy were 61.5% (eight of 13), 100% (21 of 21), and 85.3% (29 of 34), respectively, with an area under the receiver operating characteristic curve of 0.87 (Table 4). The positive predictive value was 100% (eight of eight subjects), and the negative predictive value was 80.8% (21 of 26 subjects). The 100% specificity signifies that all the patients without pCR were identified as having a non-pCR response. This is of particular importance, as these are exactly the patients who would benefit from a change in therapy.
Table 3.
Summary of Differences in Features Derived from Time Traces of the Hemodynamic Responses, SHb(t) (Percentage Change in Deoxyhemoglobin Signal), between Baseline and 2 Weeks after the Initial Treatment with Taxane
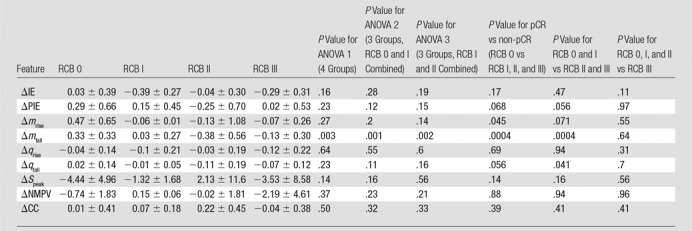
Note.—Unless otherwise specified, data are means ± standard deviations. ANOVA = analysis of variance, ΔCC = change in correlation coefficient, ΔIE = change in initial enhancement, Δmfall = change in fall slope, Δmrise = change in rise slope, ΔNMPV = change in normalized maximum peak value, ΔPIE = change in postinitial enhancement, Δqfall = change in washout rate, Δqrise = change in rise rate, ΔSpeak = change in peak signal, pCR = pathologic complete response, RCB = residual cancer burden.
Table 4.
Summary of Binary Classification Test for the Features That Showed the Most Significant Differences between Subject Groups Based on Features Derived from Time Traces of the Hemodynamic Responses, SHb(t), between Baseline and 2 Weeks after the Initial Treatment with Taxane
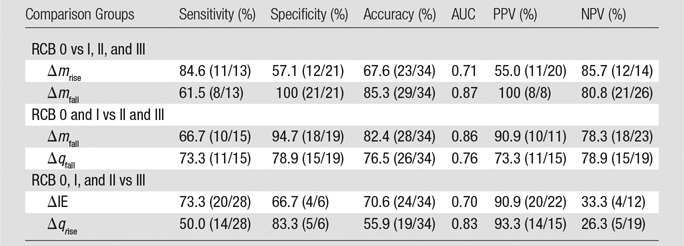
Note.—Please see the rightmost three columns of Table 3 for the most significant differences. Data in parentheses are raw data. AUC = area under the receiver operating characteristic curve, ΔIE = change in initial enhancement, ΔmRise = change in rise slope, Δmfall = change in fall slope, ΔqRise = change in rise rate, Δqfall = change in washout rate, NPV = negative predictive value, PPV = positive predictive value, RCB = residual cancer burden.
Discussion
We describe a relatively large cohort of patients who followed the same NAC regimen, a standard taxane/anthracycline-based therapy. Our optical imaging system performs three-dimensional DDOT, which provides information about hemodynamic effects in both breasts simultaneously. This allows a direct comparison of the tumor-bearing breast and the non–tumor-bearing breast in the same patient.
Our results showed that tumors in patients with pCR (RCB = 0) had higher washout rates, qfall, by week 2 compared with tumors in patients without pCR (RCB I, II, or III). Using qfall for SHb as a parameter to predict patients with pCR, we achieved a sensitivity of 92.3% (12 of 13 subjects) and a specificity of 76% (16 of 21 subjects). Additionally, Δmfall of the SHb trace showed a significant difference between patients with pCR and those without. This may possibly indicate an increase in blood flow in the tumor. For this analysis, the highest area under the receiver operating characteristic curve (0.87) and specificity (100% [21 of 21 subjects]) were obtained.
Like many other chemotherapeutic drugs, taxanes disrupt the cell cycle to prevent proliferation and cause apoptosis. In addition, it has been shown that taxanes disrupt microvessels and decrease microvascular density (40). However, studies in mice have suggested that, instead of taxanes disrupting blood flow, the diameter of the tumor vessels and blood flow velocity inside the vessels actually increase when a tumor responds to taxanes. To explain this apparent paradox, it has been argued that solid tumors have a naturally high interstitial fluid pressure due to the compression of blood vessels by surrounding tumor cells, the disorganized tumor vascular network, and the absence of functional lymphatics (41–43). Chemotherapy leads to a reduction in tumor cell density, which in turn lowers interstitial fluid pressure, consequently increasing blood vessel diameter and blood flow velocity. These arguments are supported by another study (44) that demonstrated that interstitial fluid pressure decreased after patiets with breast cancer received the taxane paclitaxel.
We saw statistically significant increases in mfall for patients with pCR between the baseline and week-2 imaging time points, suggesting that there may be increased blood flow in the tumor. Therefore, there is evidence in this study to suggest that the increased apoptosis and increased interstitial fluid pressure in tumors responding to taxanes may cause the increase in mfall by the 2nd week of NAC and that these could be physiologically relevant parameters.
Our study had limitations. Some patients could not hold their breath for the entire desired length of 30 seconds. Not surprisingly, curve parameters that were not dependent on the breath-hold length, such as normalized peak values and washout rates, yielded more promising results than parameters that depended on breath holding. Furthermore, because a minimum tumor size of 1 cm in diameter was required for study participation, no statement can be made on how well this method works for smaller tumors. Also, other non–taxane-based treatment regimens will need to be tested, and the influence of different types of drugs on outcome predictability is a goal for future studies. We did not assess for repeatability of our measures, and we did not correlate with other imaging data to ensure that what we were measuring corresponded to tumor location, although prior studies from our group (14,15) have addressed these issues. Finally, this was a pilot study to identify the most promising imaging parameters. Hence, we used our data to determine thresholds for the various dynamic imaging features. This can lead to an overestimation of the results. A follow-up prospective study with a larger cohort that produces an independent data set is needed to confirm our findings.
In conclusion, we have developed an imaging approach to noninvasively extract information about the hemodynamic effects that occur in and around the tumors of patients with breast cancer. In this study, we demonstrated that certain features of the hemodynamic responses to a simple breath hold can be used to predict treatment outcome in patients undergoing NAC. Using qfall for SHb as a parameter to predict patients with pCR, we achieved a sensitivity of 92.3% (12 of 13 patients) and a specificity of 76% (16 of 21 patients). Additionally, the difference in mfall of SHb traces between the two imaging points showed significant differences between patients with pCR and those without pCR, where patients with pCR showed an increase. Finally, we determined that qrise of the SHb trace is the best feature for comparing patients with RCB 0, I, and II and patients with RCB III (ie, the patients at highest risk for breast cancer). In this case, we were able to achieve 100% specificity (six of six subjects), which indicates that we could identify all nonresponders. These are patients who are least likely to respond to NAC and who hence may be prime candidates for a change of therapy.
Implication for Patient Care
■ If confirmed in a prospective study with a larger cohort, dynamic optical imaging parameters identified in this pilot study may be used for predicting treatment response in patients with breast cancer undergoing several months of neoadjuvant chemotherapy, as early as 2 weeks after treatment initiation.
APPENDIX
SUPPLEMENTAL FIGURES
Received July 20, 2016; revision requested September 20; revision received June 1, 2017; accepted June 27; final version accepted December 18.
Current address: Tyndall National Institute, Cork, Ireland.
Current address: Philips Research Americas, Cambridge, Mass.
J.E.G. was supported in part by an Integrative Graduate Education and Research Traineeship from the National Science Foundation and a TL1 grant by the National Institutes of Health. E.A.L. was supported by the Susan G. Komen for the Cure Post-Doctoral Clinical Research Fellowship Grant (KG 111293). Supported in part by the Witten Family Fund, Breast Cancer Research Foundation, and National Institutes of Health (grant 11223309). M.F. was supported by a PhD scholarship from the Natural Sciences and Engineering Research Council of Canada. In addition, K.K. was supported by the National Center for Advancing Translational Sciences, National Institutes of Health, through grant KL2 TR000081. The content is solely responsibility of the authors and does not necessarily represent the official views of the National Institutes of Health.
J.E.G. and E.A.L. contributed equally to this work.
Disclosures of Conflicts of Interest: J.E.G. disclosed no relevant relationships. E.A.L. disclosed no relevant relationships. H.K.K. Activities related to the present article: disclosed no relevant relationships. Activities not related to the present article: disclosed no relevant relationships. Other relationships: has been issued patent US 7463362 B2: Digital signal processor-based detection system, method, and apparatus for optical tomography, patent US7728986 B2: Systems and methods for digital detection of a tomographic signal, and patent US 9037216 B2: Systems and methods for dynamic imaging of tissue using digital optical tomography, patent US 9495516 B2: Systems, methods, and devices for image reconstruction using combined PDE-constrained and simplified spherical harmonics algorithm, patent US 9492089 B2: Dynamic optical tomographic imaging devices methods and systems, and patent US 9486142 B2: Medical imaging devices, methods, and systems; patents on diffuse optical tomography probe for breast cancer imaging and wireless handheld optical probe for breast cancer imaging are pending. M.F. Activities related to the present article: disclosed no relevant relationships. Activities not related to the present article: is currently employed by Philips Research North America. Other relationships: has been issued patent US 9037216 B2: Systems and methods for dynamic imaging of tissue using digital optical tomography; patent US 20140236003 A1: Interfacing systems, devices, and methods for optical imaging is pending. M.A. disclosed no relevant relationships. J.A.C. disclosed no relevant relationships. H.H. disclosed no relevant relationships. K.D.C. disclosed no relevant relationships. K.K. Activities related to the present article: disclosed no relevant relationships. Activities not related to the present article: owns stock in and spouse owns stock in Novartis; is on the advisory committees of Biotheranostics, Lilly, Pfizer, Amgen, Eisal, and Novartis. Other relationships: disclosed no relevant relationships. D.L.H. disclosed no relevant relationships. J.E.G. disclosed no relevant relationships. A.H.H. Activities related to the present article: disclosed no relevant relationships. Activities not related to the present article: disclosed no relevant relationships. Other relationships: has been issued patent US 7463362 B2: Digital signal processor-based detection system, method, and apparatus for optical tomography, patent US7728986 B2: Systems and methods for digital detection of a tomographic signal, and patent US 9037216 B2: Systems and methods for dynamic imaging of tissue using digital optical tomography; patent US 20140236003 A1: Interfacing systems, devices, and methods for optical imaging is pending.
Abbreviations:
- CC
- correlation coefficient
- DDOT
- dynamic diffuse optical tomography
- Hb
- deoxyhemoglobin
- HbO2
- oxyhemoglobin
- IE
- initial enhancement
- NAC
- neoadjuvant chemotherapy
- NMPV
- normalized maximum peak volume
- pCR
- pathologic complete response
- PIE
- post-initial enhancement
- RCB
- residual cancer burden
References
- 1.American Cancer Society . Breast cancer facts & figures 2015-2016. Atlanta, Ga: American Cancer Society, 2015. [Google Scholar]
- 2.Thompson AM, Moulder-Thompson SL. Neoadjuvant treatment of breast cancer. Ann Oncol 2012;23(Suppl 10):x231–x236. [DOI] [PMC free article] [PubMed] [Google Scholar]
- 3.Rastogi P, Anderson SJ, Bear HD, et al. Preoperative chemotherapy: updates of National Surgical Adjuvant Breast and Bowel Project Protocols B-18 and B-27. J Clin Oncol 2008;26(5):778–785. [DOI] [PubMed] [Google Scholar]
- 4.Heil J, Kümmel S, Schaefgen B, et al. Diagnosis of pathological complete response to neoadjuvant chemotherapy in breast cancer by minimal invasive biopsy techniques. Br J Cancer 2015;113(11):1565–1570. [DOI] [PMC free article] [PubMed] [Google Scholar]
- 5.Issa-Nummer Y, Darb-Esfahani S, Loibl S, et al. Prospective validation of immunological infiltrate for prediction of response to neoadjuvant chemotherapy in HER2-negative breast cancer: a substudy of the neoadjuvant GeparQuinto trial. PLoS One 2013;8(12):e79775. [DOI] [PMC free article] [PubMed] [Google Scholar]
- 6.Untch M, von Minckwitz G. Neoadjuvant chemotherapy: early response as a guide for further treatment: clinical, radiological, and biological. J Natl Cancer Inst Monogr 2011;2011(43):138–141. [DOI] [PubMed] [Google Scholar]
- 7.von Minckwitz G, Fontanella C. Selecting the neoadjuvant treatment by molecular subtype: how to maximize the benefit? Breast 2013;22(2,Suppl 2):S149–S151. [DOI] [PubMed] [Google Scholar]
- 8.Khokher S, Mahmood S, Qureshi MU, Khan SA, Chaudhry NA. “Initial clinical response” to neoadjuvant chemotherapy: an in-vivo chemosensitivity test for efficacy in patients with advanced breast cancer. Asian Pac J Cancer Prev 2011;12(4):939–946. [PubMed] [Google Scholar]
- 9.von Minckwitz G, Blohmer JU, Costa SD, et al. Response-guided neoadjuvant chemotherapy for breast cancer. J Clin Oncol 2013;31(29):3623–3630. [DOI] [PubMed] [Google Scholar]
- 10.Enfield LC, Gibson AP, Hebden JC, Douek M. Optical tomography of breast cancer-monitoring response to primary medical therapy. Target Oncol 2009;4(3):219–233. [DOI] [PubMed] [Google Scholar]
- 11.Tromberg BJ, Pogue BW, Paulsen KD, Yodh AG, Boas DA, Cerussi AE. Assessing the future of diffuse optical imaging technologies for breast cancer management. Med Phys 2008;35(6):2443–2451. [DOI] [PMC free article] [PubMed] [Google Scholar]
- 12.Busch DR, Choe R, Durduran T, Yodh AG. Towards non-invasive characterization of breast cancer and cancer metabolism with diffuse optics. PET Clin 2013;8(3):345–365. [DOI] [PMC free article] [PubMed] [Google Scholar]
- 13.Herranz M, Ruibal A. Optical imaging in breast cancer diagnosis: the next evolution. J Oncol 2012;2012:863747. [DOI] [PMC free article] [PubMed] [Google Scholar]
- 14.Flexman ML, Khalil MA, Al Abdi R, et al. Digital optical tomography system for dynamic breast imaging. J Biomed Opt 2011;16(7):076014. [DOI] [PMC free article] [PubMed] [Google Scholar]
- 15.Flexman ML, Kim HK, Gunther JE, et al. Optical biomarkers for breast cancer derived from dynamic diffuse optical tomography. J Biomed Opt 2013;18(9):096012. [DOI] [PubMed] [Google Scholar]
- 16.Liedtke C, Mazouni C, Hess KR, et al. Response to neoadjuvant therapy and long-term survival in patients with triple-negative breast cancer. J Clin Oncol 2008;26(8):1275–1281. [DOI] [PubMed] [Google Scholar]
- 17.Wang J, Jiang S, Li Z, et al. In vivo quantitative imaging of normal and cancerous breast tissue using broadband diffuse optical tomography. Med Phys 2010;37(7):3715–3724. [DOI] [PMC free article] [PubMed] [Google Scholar]
- 18.Zhu Q, Cronin EB, Currier AA, et al. Benign versus malignant breast masses: optical differentiation with US-guided optical imaging reconstruction. Radiology 2005;237(1):57–66. [DOI] [PMC free article] [PubMed] [Google Scholar]
- 19.Flexman ML, Vlachos F, Kim HK, et al. Monitoring early tumor response to drug therapy with diffuse optical tomography. J Biomed Opt 2012;17(1):016014. [DOI] [PMC free article] [PubMed] [Google Scholar]
- 20.Ueda S, Roblyer D, Cerussi A, et al. Baseline tumor oxygen saturation correlates with a pathologic complete response in breast cancer patients undergoing neoadjuvant chemotherapy. Cancer Res 2012;72(17):4318–4328. [DOI] [PMC free article] [PubMed] [Google Scholar]
- 21.Jiang S, Pogue BW, Carpenter CM, et al. Evaluation of breast tumor response to neoadjuvant chemotherapy with tomographic diffuse optical spectroscopy: case studies of tumor region-of-interest changes. Radiology 2009;252(2):551–560. [DOI] [PMC free article] [PubMed] [Google Scholar]
- 22.Jiang S, Pogue BW, Kaufman PA, et al. Predicting breast tumor response to neoadjuvant chemotherapy with diffuse optical spectroscopic tomography prior to treatment. Clin Cancer Res 2014;20(23):6006–6015. [DOI] [PMC free article] [PubMed] [Google Scholar]
- 23.Pakalniskis MG, Wells WA, Schwab MC, et al. Tumor angiogenesis change estimated by using diffuse optical spectroscopic tomography: demonstrated correlation in women undergoing neoadjuvant chemotherapy for invasive breast cancer? Radiology 2011;259(2):365–374. [DOI] [PMC free article] [PubMed] [Google Scholar]
- 24.Busch DR, Choe R, Rosen MA, et al. Optical malignancy parameters for monitoring progression of breast cancer neoadjuvant chemotherapy. Biomed Opt Express 2013;4(1):105–121. [DOI] [PMC free article] [PubMed] [Google Scholar]
- 25.Choe R, Konecky SD, Corlu A, et al. Differentiation of benign and malignant breast tumors by in-vivo three-dimensional parallel-plate diffuse optical tomography. J Biomed Opt 2009;14(2):024020. [DOI] [PMC free article] [PubMed] [Google Scholar]
- 26.Xu C, Vavadi H, Merkulov A, et al. Ultrasound-guided diffuse optical tomography for predicting and monitoring neoadjuvant chemotherapy of breast cancers: recent progress. Ultrason Imaging 2016;38(1):5–18. [DOI] [PMC free article] [PubMed] [Google Scholar]
- 27.Zhu Q, DeFusco PA, Ricci A, Jr, et al. Breast cancer: assessing response to neoadjuvant chemotherapy by using US-guided near-infrared tomography. Radiology 2013;266(2):433–442. [DOI] [PMC free article] [PubMed] [Google Scholar]
- 28.Zhu Q, Kurtzma SH, Hegde P, et al. Utilizing optical tomography with ultrasound localization to image heterogeneous hemoglobin distribution in large breast cancers. Neoplasia 2005;7(3):263–270. [DOI] [PMC free article] [PubMed] [Google Scholar]
- 29.Zhu Q, Tannenbaum S, Hegde P, Kane M, Xu C, Kurtzman SH. Noninvasive monitoring of breast cancer during neoadjuvant chemotherapy using optical tomography with ultrasound localization. Neoplasia 2008;10(10):1028–1040. [DOI] [PMC free article] [PubMed] [Google Scholar]
- 30.Zhu Q, Wang L, Tannenbaum S, Ricci A, Jr, DeFusco P, Hegde P. Pathologic response prediction to neoadjuvant chemotherapy utilizing pretreatment near-infrared imaging parameters and tumor pathologic criteria. Breast Cancer Res 2014;16(5):456. [DOI] [PMC free article] [PubMed] [Google Scholar]
- 31.Cerussi A, Hsiang D, Shah N, et al. Predicting response to breast cancer neoadjuvant chemotherapy using diffuse optical spectroscopy. Proc Natl Acad Sci U S A 2007;104(10):4014–4019. [DOI] [PMC free article] [PubMed] [Google Scholar]
- 32.Soliman H, Gunasekara A, Rycroft M, et al. Functional imaging using diffuse optical spectroscopy of neoadjuvant chemotherapy response in women with locally advanced breast cancer. Clin Cancer Res 2010;16(9):2605–2614. [DOI] [PubMed] [Google Scholar]
- 33.Cerussi AE, Tanamai VW, Hsiang D, Butler J, Mehta RS, Tromberg BJ. Diffuse optical spectroscopic imaging correlates with final pathological response in breast cancer neoadjuvant chemotherapy. Philos Trans A Math Phys Eng Sci 2011;369(1955):4512–4530. [DOI] [PMC free article] [PubMed] [Google Scholar]
- 34.Falou O, Soliman H, Sadeghi-Naini A, et al. Diffuse optical spectroscopy evaluation of treatment response in women with locally advanced breast cancer receiving neoadjuvant chemotherapy. Transl Oncol 2012;5(4):238–246. [DOI] [PMC free article] [PubMed] [Google Scholar]
- 35.Schaafsma BE, van de Giessen M, Charehbili A, et al. Optical mammography using diffuse optical spectroscopy for monitoring tumor response to neoadjuvant chemotherapy in women with locally advanced breast cancer. Clin Cancer Res 2015;21(3):577–584. [DOI] [PubMed] [Google Scholar]
- 36.Symmans WF, Peintinger F, Hatzis C, et al. Measurement of residual breast cancer burden to predict survival after neoadjuvant chemotherapy. J Clin Oncol 2007;25(28):4414–4422. [DOI] [PubMed] [Google Scholar]
- 37.Masciotti JM, Lasker JM, Hielscher AH. Digital lock-in detection for discriminating multiple modulation frequencies with high accuracy and computational efficiency. IEEE Trans Instrum Meas 2008;57(1):182–189. [Google Scholar]
- 38.Kim HK, Flexman M, Yamashiro DJ, Kandel JJ, Hielscher AH. PDE-constrained multispectral imaging of tissue chromophores with the equation of radiative transfer. Biomed Opt Express 2010;1(3):812–824. [DOI] [PMC free article] [PubMed] [Google Scholar]
- 39.Karahaliou A, Vassiou K, Arikidis NS, Skiadopoulos S, Kanavou T, Costaridou L. Assessing heterogeneity of lesion enhancement kinetics in dynamic contrast-enhanced MRI for breast cancer diagnosis. Br J Radiol 2010;83(988):296–309. [DOI] [PMC free article] [PubMed] [Google Scholar]
- 40.Fauzee NJ. Taxanes: promising anti-cancer drugs. Asian Pac J Cancer Prev 2011;12(4):837–851. [PubMed] [Google Scholar]
- 41.Griffon-Etienne G, Boucher Y, Brekken C, Suit HD, Jain RK. Taxane-induced apoptosis decompresses blood vessels and lowers interstitial fluid pressure in solid tumors: clinical implications. Cancer Res 1999;59(15):3776–3782. [PubMed] [Google Scholar]
- 42.Minchinton AI, Tannock IF. Drug penetration in solid tumours. Nat Rev Cancer 2006;6(8):583–592. [DOI] [PubMed] [Google Scholar]
- 43.Kuo WH, Chen CN, Hsieh FJ, et al. Vascularity change and tumor response to neoadjuvant chemotherapy for advanced breast cancer. Ultrasound Med Biol 2008;34(6):857–866. [DOI] [PubMed] [Google Scholar]
- 44.Taghian AG, Abi-Raad R, Assaad SI, et al. Paclitaxel decreases the interstitial fluid pressure and improves oxygenation in breast cancers in patients treated with neoadjuvant chemotherapy: clinical implications. J Clin Oncol 2005;23(9):1951–1961. [DOI] [PubMed] [Google Scholar]
Associated Data
This section collects any data citations, data availability statements, or supplementary materials included in this article.


