Abstract
Purpose
To investigate the value of T2-weighted–based radiomics compared with qualitative assessment at T2-weighted imaging and diffusion-weighted (DW) imaging for diagnosis of clinical complete response in patients with rectal cancer after neoadjuvant chemotherapy–radiation therapy (CRT).
Materials and Methods
This retrospective study included 114 patients with rectal cancer who underwent magnetic resonance (MR) imaging after CRT between March 2012 and February 2016. Median age among women (47 of 114, 41%) was 55.9 years (interquartile range, 45.4–66.7 years) and median age among men (67 of 114, 59%) was 55 years (interquartile range, 48–67 years). Surgical histopathologic analysis was the reference standard for pathologic complete response (pCR). For qualitative assessment, two radiologists reached a consensus. For radiomics, one radiologist segmented the volume of interest on high-spatial-resolution T2-weighted images. A random forest classifier was trained to separate the patients by their outcomes after balancing the number of patients in each response category by using the synthetic minority oversampling technique. Statistical analysis was performed by using the Wilcoxon rank-sum test, McNemar test, and Benjamini-Hochberg method.
Results
Twenty-one of 114 patients (18%) achieved pCR. The radiomic classifier demonstrated an area under the curve of 0.93 (95% confidence interval [CI]: 0.87, 0.96), sensitivity of 100% (95% CI: 0.84, 1), specificity of 91% (95% CI: 0.84, 0.96), positive predictive value of 72% (95% CI: 0.53, 0.87), and negative predictive value of 100% (95% CI: 0.96, 1). The diagnostic performance of radiomics was significantly higher than was qualitative assessment at T2-weighted imaging or DW imaging alone (P < .02). The specificity and positive predictive values were significantly higher in radiomics than were at combined T2-weighted and DW imaging (P < .0001).
Conclusion
T2-weighted–based radiomics showed better classification performance compared with qualitative assessment at T2-weighted and DW imaging for diagnosing pCR in patients with locally advanced rectal cancer after CRT.
© RSNA, 2018
Introduction
Outcomes for patients with rectal cancer have improved in the past decades, in part because of better staging with high-spatial-resolution rectal magnetic resonance (MR) imaging, better surgical technique, and the use of neoadjuvant chemotherapy–radiation therapy (CRT) (1–5). The standard treatment for patients with MR imaging–staged locally advanced rectal cancer is neoadjuvant CRT followed by total mesorectal excision. After neoadjuvant CRT, approximately 50% to 60% of patients are downstaged and 15% to 27% show pathologic complete response (pCR) (6–9). In addition, tumor response has been shown to facilitate margin-free surgical resection and serve as a prognostic factor (6,10–12). Pioneering data from Brazil (7) and subsequent studies (13–15) have shown that selected patients with clinical complete response (cCR) can be safely treated with CRT alone. However, implementing a nonsurgical approach requires strict selection criteria and frequent follow-up, including endoscopy and MR imaging (7,13).
Although the assessment of cCR after neoadjuvant CRT has become increasingly important, especially in nonsurgical management where accurate diagnosis is crucial, it is still a clinical challenge. Digital rectal examination and endoscopy have been used as the main examinations for evaluating tumor response, but they are limited to the luminal view (16) with accuracy ranging from 71% to 88% (17,18). Rectal MR imaging has been used to assess cCR by using morphologic (12,19) and/or functional MR imaging sequences (18,20), but these approaches have variable diagnostic performances. After neoadjuvant CRT, most rectal tumors develop fibrosis, which leads to decreased signal intensity on T2-weighted images. Nevertheless, tumors may still exist within a scar, and adding diffusion-weighted (DW) imaging has been shown to improve the prediction of response by improving the depiction of viable tumor after neoadjuvant CRT (19,21). Currently, no consensus exists in the literature on which approach is the most reliable to assess tumor response after neoadjuvant CRT, and a nonsurgical strategy is not currently supported by the National Comprehensive Cancer Network guidelines (6). Therefore, there is an increasing need for evaluation of tumor response by using a variety of techniques.
Radiomics analysis involves computer-based extraction of a large number of quantitative features and has potential for aiding clinical decision making (22). Prior studies have evaluated the use of radiomics analysis in MR imaging for distinguishing cancer from benign tissue or adding information about cancer aggressiveness (21,23–30), as well as for predicting response after CRT (31–33). We hypothesize that MR imaging–based radiomics may add value to the current MR imaging assessment for evaluating patients with locally advanced rectal cancer after CRT, improving on qualitative assessment to differentiate patients with clinical partial response from those with cCR after CRT.
The purpose of our study was to investigate the added value of T2-weighted–based radiomic features compared with the qualitative assessment at T2-weighted and DW imaging for diagnosis of cCR in patients with locally advanced rectal cancer after neoadjuvant CRT.
Materials and Methods
Study Population
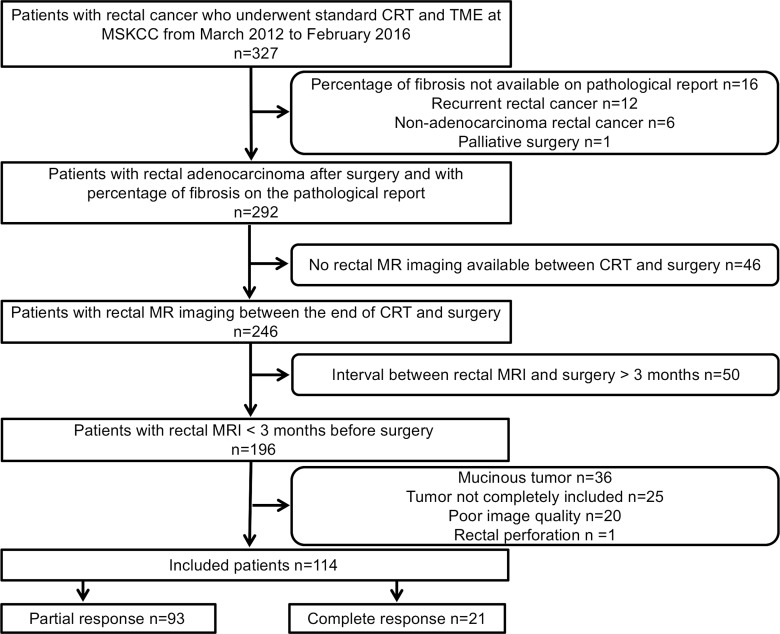
The institutional review board approved our retrospective study, which was compliant with the Health Insurance Portability and Accountability Act, and waived the requirement for informed consent. We searched our retrospectively maintained database for consecutive patients who underwent rectal MR imaging between March 2012 and February 2016. The inclusion criterion was patients with rectal adenocarcinoma who underwent neoadjuvant CRT followed by surgery at Memorial Sloan Kettering Cancer Center from March 2012 to February 2016. The exclusion criteria were as follows: (a) percentage of fibrosis unavailable on pathologic report, (b) recurrent rectal cancer, (c) nonadenocarcinoma rectal cancer, (d) palliative surgery, (e) no rectal MR imaging between CRT and surgery, (f) interval between rectal MR imaging and surgery more than 3 months, (g) mucinous tumor, (h) incomplete tumor coverage at MR imaging, (i) poor image quality, and (j) rectal perforation. The patient selection process is summarized in Figure 1.
Figure 1:
Flowchart summarizes patient accrual. CRT = chemotherapy–radiation therapy, MSKCC = Memorial Sloan Kettering Cancer Center, TME = total mesorectal excision.
Our final study population consisted of 114 of 327 patients: 67 (59%) men and 47 (41%) women, with a median age of 55 years (interquartile range, 48–67 years). The median age among women was 55.9 years (interquartile range, 45.4–66.7 years) and the median age among men was 55 years (interquartile range, 48–67 years). No statistical difference in age was found between male and female patients.
MR Imaging Protocol
The majority of rectal MR examinations were performed at our institution (109 of 114; 96%) and a few were performed at other institutions (five of 114; 4%). MR images were acquired with different GE Healthcare System platforms (Discovery MR750, Optima MR450w, Signa EXCITE, and Signa HDxt; Waukesha, Wisc) by using a phase-array coil. The minimum sequence required was high-spatial-resolution axial oblique T2-weighted imaging through the tumor, and DW imaging was used when available. The oblique axial T2-weighted imaging sequence was obtained perpendicular to the long axis of the rectal tumor and/or area after treatment. MR imaging parameters at our institution are summarized in Table 1. Rectal MR images from other institutions fulfilled the minimum standards agreed on by the investigators. The minimum standards were presence of high-spatial-resolution axial oblique T2-weighted imaging through the tumor with section thickness of 3 mm and field of view of 180 mm.
Table 1.
MR Imaging Parameters

Note.—DWI = diffusion-weighted imaging, FSE = fast spin-echo.
Qualitative MR Evaluation
Two radiologists (N.H. and I.P., with 5 years and 9 years of experience in rectal MR imaging, respectively) reviewed the T2-weighted images of all patients (n = 114) and DW images, including visual assessment of the apparent diffusion coefficient maps in 106 patients (eight patients had suboptimal DW images). The radiologists were aware that the patients had completed CRT before rectal MR imaging, but they were blinded to endoscopic and histopathologic results. The radiologists visually classified the area after treatment as either cCR or clinical partial response in consensus. The radiologists had the primary staging MR images at their disposal to guide the delimitation of the tumor bed. The readout sessions were performed daily for a week and a consensus was reached in all studies.
cCR at T2-weighted imaging was defined as no residual intermediate signal intensity in the tumor bed and hypointensity or normalized rectal wall. At DW imaging, the definition of cCR was no high signal intensity on b = 800 sec/mm2 images and no low apparent diffusion coefficient signal in the tumor bed. On the other hand, clinical partial response at T2-weighted imaging was defined as the presence of intermediate signal in tumor bed, and at DW imaging, high signal on b = 800 sec/mm2 images and low apparent diffusion coefficient signal in tumor bed. If the patient had restricted diffusion outside of the tumor bed, or if vague focal high signal at DW imaging was questionable whether it corresponded to the location of the former tumor, then readers did not classify it as clinical partial response.
In addition, the radiologists performed combined assessment of T2 and DW imaging features. If cCR was not seen on either T2 or DW images, then the patient was classified as achieving clinical partial response.
Quantitative MR Texture Analysis
Image segmentation.—The two radiologists who performed qualitative MR evaluation also reviewed all imaging studies to reach a consensus on the treated tumor region within the rectal wall. One of the radiologists (N.H.) manually segmented the entire area after treatment within the rectal wall, excluding equivocal normal rectal wall and mucosal edema on the high-spatial-resolution axial oblique T2-weighted image by using a free open-source software package (ITK-SNAP, version 3.4.0; http://itksnap.org) to provide the volume of interest for computer-based image analysis. When uncertainty existed concerning the treated tumor region, the area was not included in the segmentation.
Texture feature extraction.—Thirty-four texture measures consisting of first order (n = 4), second-order Haralick (n = 5), Gabor edges at four different orientations (0°, 45°, 90°, 135°) and bandwidth (g = 1.4), and second-order texture measures on the Gabor edges (5 × 4 = 20) were computed. The first-order textures captured the moments of T2-weighted MR imaging histogram (mean, standard deviation, kurtosis, and skewness) and were computed within the tumor volume of interest. The Haralick textures (34) (energy, entropy, correlation, contrast, and homogeneity) were computed from gray-level correlation matrix after rescaling the intensities within the volume of interest to lie within 0–255 and by using 24 histogram bins. Haralick textures were computed from T2-weighted MR imaging and Gabor edge images. Gabor edge images were extracted as described in the following paragraph.
Gabor features are orientation-sensitive edge detectors that extract edges at specific orientations and specific spatial scales. A Gabor filter is composed of a Gaussian envelope function superimposed on a sinusoidal wave. First-order histogram-based features summarize the signal intensities within a given volume of interest. On the other hand, second-order gray-level correlation matrix or Haralick texture measures extract the frequency of local spatial variations in signal intensities within a volume of interest. We used the aforementioned features because these features were found to be relevant for distinguishing patients by outcomes in our previous studies by using MR imaging (25,35).
An in-house software was implemented in MATLAB (version 2015b; MathWorks; Natick, Mass) and C++ by using the Insight ToolKit for computing the Gabor (36) and Haralick texture measures (34).
Classification of treatment outcomes by using texture measures.—A random forest (RF) classifier (37) was trained to separate the patients by their treatment outcomes after balancing the number of patients in each response category by using the synthetic minority oversampling technique (35,38). The features were centered and scaled prior to data augmentation by using the synthetic minority oversampling technique, which increased the number of minority class (pCR, n = 21) to the majority class (pathologic partial response [pPR], n = 93). RF is an ensemble classifier that computes multiple decision tree–based classifiers by using implicit feature selection. Feature selection is performed by selecting features in each tree node that successively increases the purity of class memberships of the data in the descendant nodes. In other words, the RF classifier seeks to partition the data into the different classes by using features that best split the data into the different classes in each node. Gini impurity or the Gini index (37) is a computationally efficient approximation of entropy that is computed at each node split of the RF and captures how well the data can be split into two classes at a particular node in each tree. The Gini index measures the overall probability of misclassification for each feature (f) at a node (n) as follows:
where G( f )is the Gini index for a feature f, p( fc|n) is the probability of classifying a feature f into class n, and C is the number of classes (where C = 2 in our case and f = 34). The result of RF classification is a model for distinguishing the data into the constituent classes and a feature importance that shows the relative importance of each feature for the classification. Feature importance assigned by using Gini index corresponds to the rate of accurate classification by a particular feature.
Furthermore, the RF classifier down-weights uninformative features and those that are highly correlated to the informative features, thereby selecting only those that lead to improved accuracy while keeping the number of features that contribute to the overall classification low. Therefore, even when there are a large number of features, highly correlated features would be down-weighted in favor of less correlated features so as to obtain a classifier with few independent features.
The RF classifier was optimized for the number of trees (50, 250, 500, 750, 1000, 1500, 2000) with repeated (n = 100) and K = fivefold cross-validation and with all 34 real-valued (noncategorical) features after the same features were centered and scaled. Feature scaling ensured that the RF classifier did not place excessive importance features with larger range compared with other features. The number of predictors (two to six) used for splitting the nodes at each level of the tree was optimized through linear search. The upper limit for the number of features tested in each node was determined as  . Repeated cross-validation was used for training the RF classifier because cross-validation leads to less biased estimates compared with when using only the out-of-bag error estimates produced by the RF classifier (39). The implementation of the RF and the synthetic minority oversampling technique algorithm available in the Caret and DwR package in the R software (version 3.1; R Foundation for Statistical Computing, Vienna, Austria) was used for the analysis.
Reference Standard
The reference standard was the histopathologic report of the surgical resection specimens of the total mesorectal excision. We performed a retrospective chart review of pathologic results and no additional pathologic analysis was done solely for our project. All histopathologic analysis was performed by specialized gastrointestinal pathologists with 10 years to 20 years of experience, and findings were reported in a standardized manner, including tumor stage, percentage of fibrosis, presence of residual tumor, and lymph node status. pCR was defined as stage ypT0N0 (where y means after neoadjuvant treatment and p means pathologic stage).
Statistical Analysis
Statistical comparisons between the continuous valued texture measures and magnet strengths (1.5 T vs 3.0 T) as well as the treatment outcome were performed by using Wilcoxon rank-sum test. Correction for multiple comparisons was performed by using Benjamini-Hochberg method. Machine learning classifier accuracy was determined by using sensitivity and specificity, positive predictive value (PPV), and negative predictive value (NPV). The sensitivity, specificity, PPV, and NPV were estimated for the qualitative diagnosis of cCR by using T2-weighted images, DW images, and both. We compared the sensitivities, specificities, PPV, and NPV between qualitative and quantitative assessment by using an exact McNemar test, whereas PPV and NPV were compared by using the method described in Moskowitz et al (40). P values < .05 were considered to indicate a significant difference.
Statistical analyses were performed with software package R and SAS (version 9.4; SAS Institute, Cary, NC).
Results
Patient Characteristics
The median interval between the end of neoadjuvant CRT and restaging rectal MR imaging was 55 days (interquartile range, 30–64 days). The median interval between MR imaging after CRT and surgery was 29 days (interquartile range, 20–46 days). Ninety-three patients (82%) achieved pPR at pathologic examination of surgical specimens and 21 (18%) achieved pCR. Among the 93 patients with pPR, there were 39 (41.9%) women and 54 (58.1%) men. Among the 21 patients with pCR, there were eight (38.1%) women and 13 (61.9%) men. Patient characteristics are summarized in Table 2.
Table 2.
Characteristics of the Patients

Note.—Unless otherwise specified, data are medians, with interquartile ranges in parentheses. CRT = chemotherapy–radiation therapy, pCR = pathologic complete response, pPR = pathologic partial response.
* Data are medians, with percentages in parentheses.
Qualitative MR Assessment
The sensitivity, specificity, PPV, and NPV of T2-weighted imaging, DW imaging, and combined T2-weighted and DW imaging for diagnosing pCR are summarized in Table 3. Combined T2-weighted and DW imaging achieved a sensitivity of 84% and a specificity of 56% for depicting pCR, whereas the NPV and PPV were 94% and 30%, respectively.
Table 3.
Sensitivity, Specificity, PPV, and NPV of T2-weighted Imaging, DW Imaging, Combined T2-weighted and DW Imaging, and Radiomics in the Diagnosis of pCR

Note.—Unless otherwise specified, data are numerators and denominators, with percentages in parentheses and 95% confidence intervals in brackets. DW = diffusion-weighted, NPV = negative predictive value, pCR = pathologic complete response, pPR = pathologic partial response, PPV = positive predictive value.
* Data are percentages, with 95% confidence intervals in parentheses.
Quantitative MR Texture Analysis
Sixty-two (55%) patients were imaged with 1.5-T units, whereas the remaining 52 (45%) were imaged with 3.0-T units. Among the 62 patients imaged with 1.5-T units, there were 24 (38.7%) women and 38 (61.3%) men. Among the 52 patients imaged with 3.0-T units, there were 23 (44.2%) women and 29 (55.8%) men. With the exception of mean of the T2-weighted MR imaging, mean intensity of Gabor edges, and standard deviation of T2-weighted MR imaging, all computed within tumor, no other computed texture measures showed any significant difference by magnet strength (Table E1 [online]).
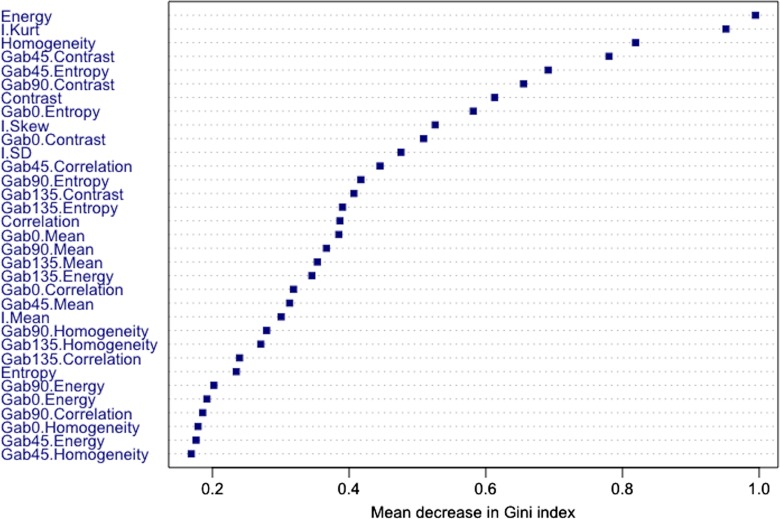
Figure 2 depicts the relative importance of features computed by using the Gini index as a metric. Second-order texture measures of energy, homogeneity, and contrast were among features that resulted in the largest decrease in the Gini index; energy was the most relevant, homogeneity the third most relevant, and contrast the seventh most relevant feature. Furthermore, patients with pCR had significantly higher energy, higher homogeneity, and lower contrast compared with patients with pPR (Table 4); this indicates that tumors with a homogenous appearance were associated with pCR. The entropy texture computed from T2-weighted MR imaging was among the least relevant features (Table 4). On the other hand, the Gab45 entropy and Gab0 entropy textures were the fifth and eighth most relevant features (Fig 2) and were significantly lower in patients with pCR compared with patients with pPR (Table 4). Kurtosis was the only first-order feature found to be among the most relevant features (Fig 2) and tumors with significantly lower kurtosis were associated with pCR (Table 4). Finally, nonrobust features such as the mean computed from the T2-weighted imaging and Gabor edge images, as well as the standard deviation computed from the T2-weighted imaging, were not selected among the top 10 relevant features.
Figure 2:
Feature importance plot shows mean decrease in Gini impurity. Features that most reduce Gini impurity are those that result in the least misclassification.
Table 4.
Statistical Differences between pCR and pPR between Radiomic Features Determined by Using RF Classifier
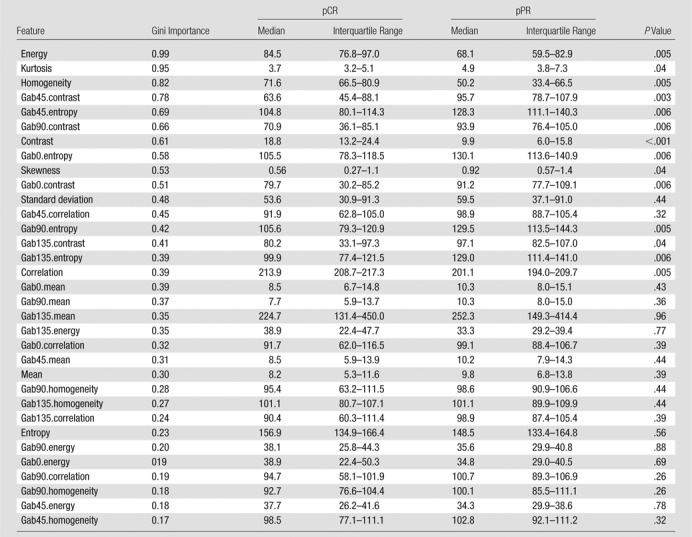
Note.—Feature relevance was assessed by using mean decrease in Gini index–based feature importance averaged over 100 trials. P values are adjusted for false-discovery rate by using Benjamini-Hochberg method. pCR = pathologic complete response, pPR = pathologic partial response, RF = random forest.
Fourteen of the 34 features were significantly different between pCR and pPR (Table 4). The relative importance of the features computed by using the Gini index is shown in Table 4.
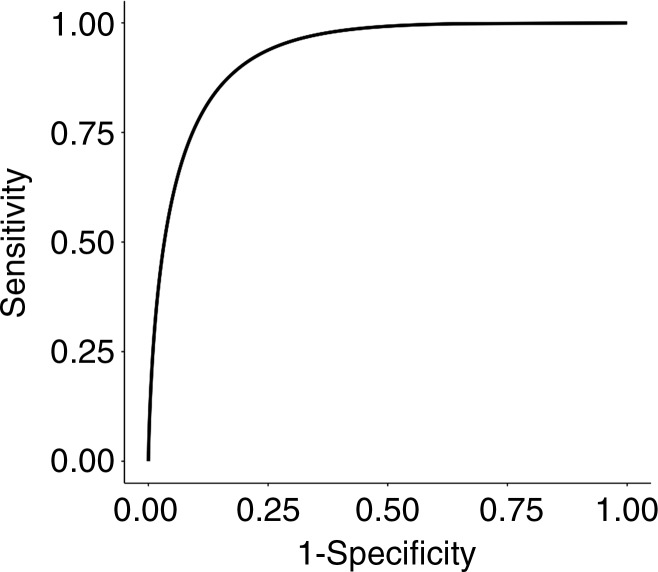
The RF classifier trained by using 50 trees and six variables (for node splits) produced the best performance (Table E2 [online]). The RF classifier achieved an area under the curve of 93% (95% confidence interval [CI]: 0.87, 0.97) for differentiating pCR from pPR (Fig 3), with a sensitivity of 100% (95% CI: 0.84, 1), specificity of 91% (95% CI: 0.84, 0.96), PPV of 72% (95% CI: 0.53, 0.87), and NPV of 100% (95% CI: 0.96, 1).
Figure 3:
Graph shows receiver operating characteristic curve for random forest classifier in differentiating pathologic complete response versus pathologic partial response by using repeated fivefold cross-validation.
Figures 4 and 5 demonstrate representative patients of pCR and pPR at T2-weighted imaging and on relevant intensity-based features overlaid on T2-weighted images.
Figure 4a:
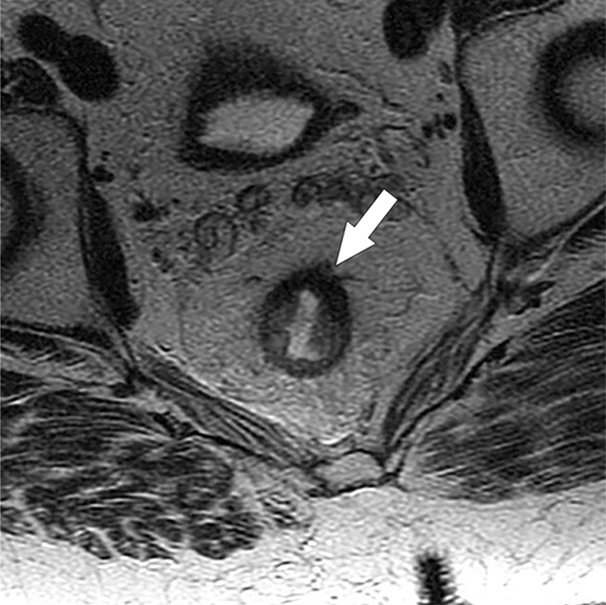
Images show radiomics analysis in a 60-year-old man with rectal adenocarcinoma after completion of chemotherapy–radiation therapy with surgically proven complete response. (a) High-spatial-resolution axial oblique T2-weighted image demonstrates treated area with low signal intensity (arrow). (b–e) Illustration of intensity-based texture features overlaid on high-spatial-resolution axial T2-weighted images as follows: (b) contrast, (c) Gabor 45 contrast, and (d) homogeneity.
Figure 5a:

Images show radiomics analysis in a 49-year-old man with rectal adenocarcinoma after completion of chemotherapy–radiation therapy with surgically proven residual tumor and 90% of fibrosis. (a) High-spatial-resolution axial oblique T2-weighted image demonstrates treated area with low signal intensity (arrow). (b–e) Illustration of intensity-based texture features overlaid on high-spatial-resolution axial T2-weighted images as follows: (b) contrast, (c) Gabor 45 contrast, and (d) homogeneity.
Figure 4b:
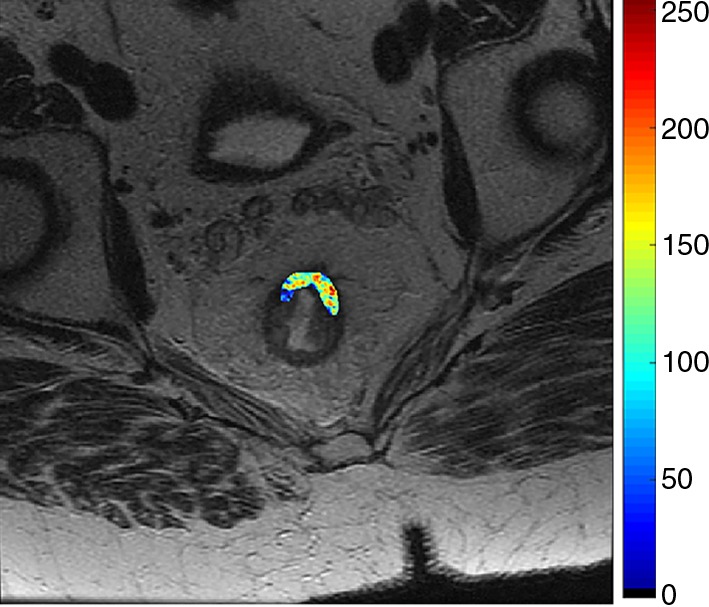
Images show radiomics analysis in a 60-year-old man with rectal adenocarcinoma after completion of chemotherapy–radiation therapy with surgically proven complete response. (a) High-spatial-resolution axial oblique T2-weighted image demonstrates treated area with low signal intensity (arrow). (b–e) Illustration of intensity-based texture features overlaid on high-spatial-resolution axial T2-weighted images as follows: (b) contrast, (c) Gabor 45 contrast, and (d) homogeneity.
Figure 4c:

Images show radiomics analysis in a 60-year-old man with rectal adenocarcinoma after completion of chemotherapy–radiation therapy with surgically proven complete response. (a) High-spatial-resolution axial oblique T2-weighted image demonstrates treated area with low signal intensity (arrow). (b–e) Illustration of intensity-based texture features overlaid on high-spatial-resolution axial T2-weighted images as follows: (b) contrast, (c) Gabor 45 contrast, and (d) homogeneity.
Figure 4d:
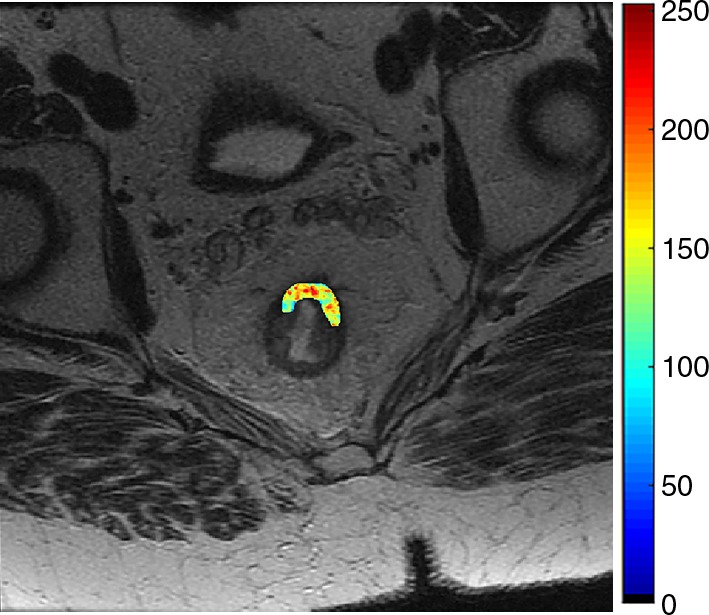
Images show radiomics analysis in a 60-year-old man with rectal adenocarcinoma after completion of chemotherapy–radiation therapy with surgically proven complete response. (a) High-spatial-resolution axial oblique T2-weighted image demonstrates treated area with low signal intensity (arrow). (b–e) Illustration of intensity-based texture features overlaid on high-spatial-resolution axial T2-weighted images as follows: (b) contrast, (c) Gabor 45 contrast, and (d) homogeneity.
Figure 5b:
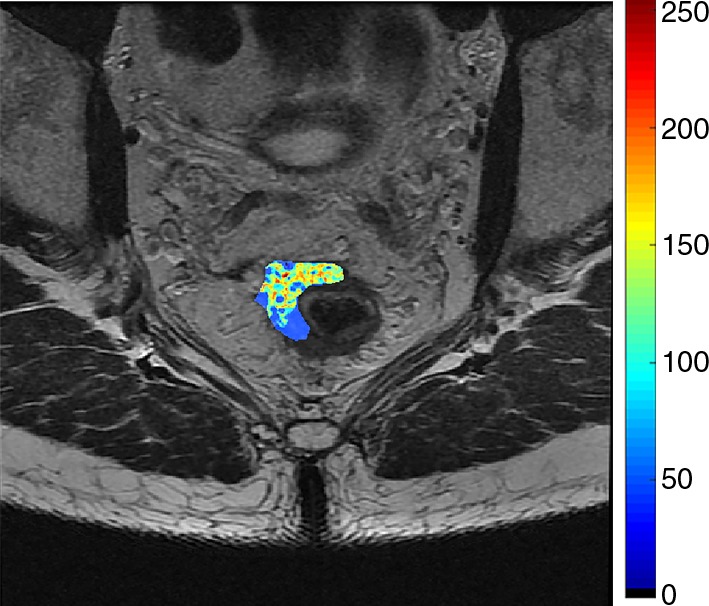
Images show radiomics analysis in a 49-year-old man with rectal adenocarcinoma after completion of chemotherapy–radiation therapy with surgically proven residual tumor and 90% of fibrosis. (a) High-spatial-resolution axial oblique T2-weighted image demonstrates treated area with low signal intensity (arrow). (b–e) Illustration of intensity-based texture features overlaid on high-spatial-resolution axial T2-weighted images as follows: (b) contrast, (c) Gabor 45 contrast, and (d) homogeneity.
Figure 5c:

Images show radiomics analysis in a 49-year-old man with rectal adenocarcinoma after completion of chemotherapy–radiation therapy with surgically proven residual tumor and 90% of fibrosis. (a) High-spatial-resolution axial oblique T2-weighted image demonstrates treated area with low signal intensity (arrow). (b–e) Illustration of intensity-based texture features overlaid on high-spatial-resolution axial T2-weighted images as follows: (b) contrast, (c) Gabor 45 contrast, and (d) homogeneity.
Figure 5d:
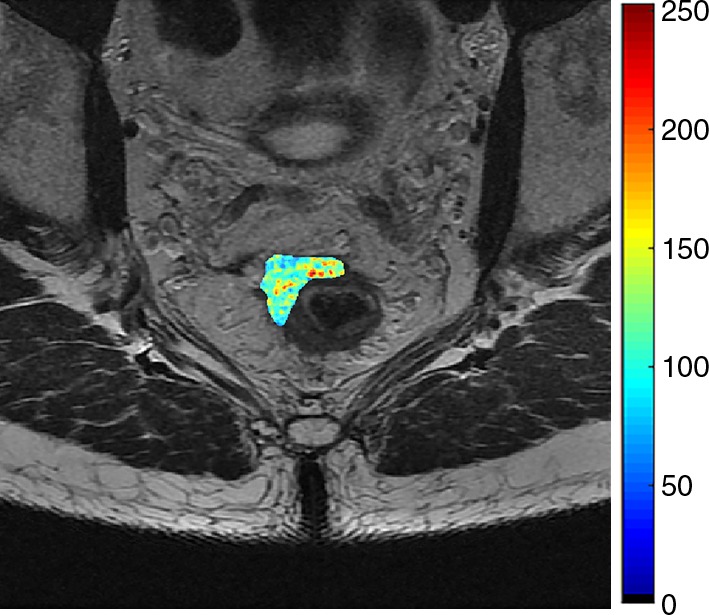
Images show radiomics analysis in a 49-year-old man with rectal adenocarcinoma after completion of chemotherapy–radiation therapy with surgically proven residual tumor and 90% of fibrosis. (a) High-spatial-resolution axial oblique T2-weighted image demonstrates treated area with low signal intensity (arrow). (b–e) Illustration of intensity-based texture features overlaid on high-spatial-resolution axial T2-weighted images as follows: (b) contrast, (c) Gabor 45 contrast, and (d) homogeneity.
Comparison between Qualitative and Quantitative Analysis
The differences between qualitative and quantitative assessments were significantly different for the vast majority of the results, except when we compared the sensitivity and NPV of RF versus T2-weighted imaging and DW imaging. Table E3 (online) summarizes the comparison between these assessments.
Discussion
Our study evaluated the ability of qualitative MR imaging features to help differentiate cCR from clinical partial response at T2-weighted imaging, DW imaging, and the combination of both in patients with locally advanced rectal cancer after neoadjuvant therapy. When combined imaging features at T2-weighted and DW imaging were used to diagnose cCR, high sensitivity and NPV were achieved; however, it resulted in low specificity. Overall, our results are in line with prior literature that report accuracy in the diagnosis of pCR ranging from 50% to 90% among different groups and MR imaging sequences tested (20,41–43). When combined imaging features at T2-weighted and DW imaging were used to diagnose cCR, we found higher sensitivity and NPV than previously described (18) (84% and 94% vs 35% and 75%, respectively) and lower specificity and PPV (56% and 30% vs 94% and 75%, respectively). Aside from the expected variation between observers and institutions, this difference might be explained by the fact that previous studies (18) used five levels of confidence for assessing cCR with a cutoff of between levels two and three, compared with use of a binary interpretation in our study.
We then evaluated performance of radiomic features in diagnosing pCR. To the best of our knowledge, there is no published study in the literature comparing radiomics with qualitative evaluation of cCR. In our study, the radiomic classifier demonstrated high diagnostic performance when compared with qualitative assessment at T2-weighted imaging and DW imaging separately. When compared with the assessment of both T2-weighted and DW imaging, radiomics had significantly higher specificity and PPV; however, sensitivity and NPV were not statistically different. We postulate that small clusters of residual tumor cells within the residual area after treatment in pPR may explain the difference in texture in pCR and pPR; however, additional studies with direct correlation to whole-specimen histopathologic analysis are necessary to investigate this further. Our results also show that homogeneously appearing tumors or those with high energy and homogeneity were significantly associated with pCR. Although encouraging, radiomics classification was possible only following data augmentation, which could potentially lead to overoptimistic results. However, all reported results were performed by using cross-validation. Further validation on an independent data set will help determine the potential of the radiomics features for diagnosing patients with pCR. Data augmentation has been used in several studies because of higher prevalence of data imbalance in medical data sets, such as to distinguish between highly aggressive and nonaggressive prostate cancers (35), predict outcomes of patients with non-small cell lung cancers (28), distinguish histopathologic grade of soft-tissue sarcomas (27), and evaluate endometrial carcinoma (26).
The absence of a significant statistical difference for the majority of the computed textures between imagers with different magnetic strengths is an important finding. In our study, only the mean and standard deviation measures showed difference between the imagers, whereas all the texture- and edge-based measures that capture the relative differences in the intensities between local regions showed no difference between imagers by magnetic field strengths (1.5 T vs 3.0 T). Given the large number of MR imagers available in the market, a wide variety of equipment exists not only among different facilities but also within the same institution. Hence, the evaluation of robustness of quantitative metrics is of key importance to allow the widespread use of a variety of imaging techniques. Prior studies have studied the repeatability of radiomics features from computed tomographic (CT) images (44,45) and the effect of imaging parameters, including contrast material enhancement and section thickness from CT images on predictability by using radiomics measures (46). To the best of our knowledge, no previous study in the literature has studied the robustness of radiomics features because of differences in field strength at MR imaging.
Our study had several limitations. First, the number of patients with pCR is low and our study design did not include patients with cCR on nonsurgical (“watch and wait”) management. We might have introduced selection bias by not including patients on nonsurgical management. However, this design was chosen to have the histopathologic reference standard from all patients and a homogeneous data set. Second, our study did not include lymph node evaluation and it is known that lymph node metastasis can be present in patients with pCR (47). Third, the radiologic assessment was performed in consensus, and interreader agreement was not evaluated. Furthermore, considering that only one reader segmented the images, it is impossible to assess the reproducibility of segmentation. Fourth, radiomics was performed only on T2-weighted images to minimize variability in acquisition parameters. We anticipate that the performance of radiomics analyses may improve with the inclusion of other MR imaging sequences, including DW imaging. Fifth, manual segmentation of volume of interest is a time-consuming process; therefore, it is important to develop a user-friendly tool to encourage the use of radiomic measures in daily clinical practice. Last, we did not perform external validation. Therefore, further studies are needed to overcome these limitations and to validate the reported data to provide a better generalization of our results.
In conclusion, our preliminary study shows that the radiomics measures by using cross-validation showed better classification performance compared with the qualitative assessment for diagnosing pCR in patients with locally advanced rectal cancer after neoadjuvant therapy. Although promising, these results are preliminary and require validation on a larger and independent data set to assess the potential for clinical translation. After validation, this radiomic assessment may become a potential imaging biomarker of cCR and complement the current modalities in the management of rectal cancer after neoadjuvant treatment.
Implications for Patient Care
■ Radiomics analysis of T2-weighted images may potentially improve the discrimination between pathologic complete and pathologic partial response in patients with locally advanced rectal cancer after chemotherapy–radiation therapy.
■ Radiomics analysis to discriminate pathologic complete and partial response in patients with locally advanced rectal cancer after neoadjuvant therapy can be performed by using two different magnetic fields (1.5 T and 3.0 T).
SUPPLEMENTAL TABLES
Acknowledgments
Acknowledgments
The authors thank Joanne Chin, MFA, and Joseph Singer, BS, MPH, for their editorial support of this article.
Received September 26, 2017; revision requested November 18; final revision received December 18; accepted January 2, 2018.
Supported in part by the Memorial Sloan Kettering Cancer Center Support Grant/Core Grant (P30 CA008748).
Current address: Department of Radiology, Hospital Sírio-Libanês, São Paulo, Brazil.
Current address: Department of Radiology, Universidade de São Paulo, São Paulo, Brazil.
Current address: Center for Radiology and MRI, Clinical Center of Serbia, Belgrade, Serbia.
N.H. and H.V. contributed equally to this work.
Disclosures of Conflicts of Interest: N.H. disclosed no relevant relationships. H.V. disclosed no relevant relationships. M.K. disclosed no relevant relationships. I.B. disclosed no relevant relationships. J.Z. disclosed no relevant relationships. M.C. disclosed no relevant relationships. E.S. disclosed no relevant relationships. J.G.A. disclosed no relevant relationships. M.J.G. disclosed no relevant relationships. I.P. disclosed no relevant relationships.
Abbreviations:
- cCR
- clinical complete response
- CI
- confidence interval
- CRT
- chemotherapy–radiation therapy
- DW
- diffusion-weighted
- NPV
- negative predictive value
- pCR
- pathologic complete response
- pPR
- pathologic partial response
- PPV
- positive predictive value
- RF
- random forest
References
- 1.Heald RJ, Ryall RD. Recurrence and survival after total mesorectal excision for rectal cancer. Lancet 1986;1(8496):1479–1482. [DOI] [PubMed] [Google Scholar]
- 2.Krook JE, Moertel CG, Gunderson LL, et al. Effective surgical adjuvant therapy for high-risk rectal carcinoma. N Engl J Med 1991;324(11):709–715. [DOI] [PubMed] [Google Scholar]
- 3.Gastrointestinal Tumor Study Group . Prolongation of the disease-free interval in surgically treated rectal carcinoma. N Engl J Med 1985;312(23):1465–1472. [DOI] [PubMed] [Google Scholar]
- 4.Adjuvant therapy for patients with colon and rectum cancer. Consens Statement 1990;8(4):1–25. [PubMed] [Google Scholar]
- 5.Sauer R, Becker H, Hohenberger W, et al. Preoperative versus postoperative chemoradiotherapy for rectal cancer. N Engl J Med 2004;351(17):1731–1740. [DOI] [PubMed] [Google Scholar]
- 6.National Comprehensive Cancer Network . NCCN Clinical Practice Guidelines in Oncology (NCCN Guidelines) Rectal Cancer version 2.2017. https://www.nccn.org/professionals/physician_gls/pdf/rectal.pdf. Accessed December 15, 2017.
- 7.Habr-Gama A, Perez RO, Nadalin W, et al. Operative versus nonoperative treatment for stage 0 distal rectal cancer following chemoradiation therapy: long-term results. Ann Surg 2004;240(4):711–717; discussion 717–718. [DOI] [PMC free article] [PubMed] [Google Scholar]
- 8.Maas M, Nelemans PJ, Valentini V, et al. Long-term outcome in patients with a pathological complete response after chemoradiation for rectal cancer: a pooled analysis of individual patient data. Lancet Oncol 2010;11(9):835–844. [DOI] [PubMed] [Google Scholar]
- 9.Påhlman L, Bohe M, Cedermark B, et al. The Swedish rectal cancer registry. Br J Surg 2007;94(10):1285–1292. [DOI] [PubMed] [Google Scholar]
- 10.Trakarnsanga A, Gönen M, Shia J, et al. Comparison of tumor regression grade systems for locally advanced rectal cancer after multimodality treatment. J Natl Cancer Inst 2014;106(10):dju248. [DOI] [PMC free article] [PubMed] [Google Scholar]
- 11.Fokas E, Liersch T, Fietkau R, et al. Tumor regression grading after preoperative chemoradiotherapy for locally advanced rectal carcinoma revisited: updated results of the CAO/ARO/AIO-94 trial. J Clin Oncol 2014;32(15):1554–1562. [DOI] [PubMed] [Google Scholar]
- 12.Patel UB, Taylor F, Blomqvist L, et al. Magnetic resonance imaging-detected tumor response for locally advanced rectal cancer predicts survival outcomes: MERCURY experience. J Clin Oncol 2011;29(28):3753–3760. [DOI] [PubMed] [Google Scholar]
- 13.Maas M, Beets-Tan RG, Lambregts DM, et al. Wait-and-see policy for clinical complete responders after chemoradiation for rectal cancer. J Clin Oncol 2011;29(35):4633–4640. [DOI] [PubMed] [Google Scholar]
- 14.Renehan AG, Malcomson L, Emsley R, et al. Watch-and-wait approach versus surgical resection after chemoradiotherapy for patients with rectal cancer (the OnCoRe project): a propensity-score matched cohort analysis. Lancet Oncol 2016;17(2):174–183. [DOI] [PubMed] [Google Scholar]
- 15.Li J, Liu H, Yin J, et al. Wait-and-see or radical surgery for rectal cancer patients with a clinical complete response after neoadjuvant chemoradiotherapy: a cohort study. Oncotarget 2015;6(39):42354–42361. [DOI] [PMC free article] [PubMed] [Google Scholar]
- 16.Duldulao MP, Lee W, Streja L, et al. Distribution of residual cancer cells in the bowel wall after neoadjuvant chemoradiation in patients with rectal cancer. Dis Colon Rectum 2013;56(2):142–149. [DOI] [PMC free article] [PubMed] [Google Scholar]
- 17.Perez RO, Habr-Gama A, Pereira GV, et al. Role of biopsies in patients with residual rectal cancer following neoadjuvant chemoradiation after downsizing: can they rule out persisting cancer? Colorectal Dis 2012;14(6):714–720. [DOI] [PubMed] [Google Scholar]
- 18.Maas M, Lambregts DM, Nelemans PJ, et al. Assessment of clinical complete response after chemoradiation for rectal cancer with digital rectal examination, endoscopy, and MRI: selection for organ-saving treatment. Ann Surg Oncol 2015;22(12):3873–3880. [DOI] [PMC free article] [PubMed] [Google Scholar]
- 19.Patel UB, Brown G, Rutten H, et al. Comparison of magnetic resonance imaging and histopathological response to chemoradiotherapy in locally advanced rectal cancer. Ann Surg Oncol 2012;19(9):2842–2852. [DOI] [PubMed] [Google Scholar]
- 20.Hötker AM, Tarlinton L, Mazaheri Y, et al. Multiparametric MRI in the assessment of response of rectal cancer to neoadjuvant chemoradiotherapy: a comparison of morphological, volumetric and functional MRI parameters. Eur Radiol 2016;26(12):4303–4312. [DOI] [PMC free article] [PubMed] [Google Scholar]
- 21.Lubner MG, Stabo N, Abel EJ, Del Rio AM, Pickhardt PJ. CT textural analysis of large primary renal cell carcinomas: pretreatment tumor heterogeneity correlates with histologic findings and clinical outcomes. AJR Am J Roentgenol 2016;207(1):96–105. [DOI] [PubMed] [Google Scholar]
- 22.Gillies RJ, Kinahan PE, Hricak H. Radiomics: images are more than pictures, they are data. Radiology 2016;278(2):563–577. [DOI] [PMC free article] [PubMed] [Google Scholar]
- 23.Sidhu HS, Benigno S, Ganeshan B, et al. Textural analysis of multiparametric MRI detects transition zone prostate cancer. Eur Radiol 2017;27(6):2348–2358. [DOI] [PMC free article] [PubMed] [Google Scholar]
- 24.Vargas HA, Veeraraghavan H, Micco M, et al. A novel representation of inter-site tumour heterogeneity from pre-treatment computed tomography textures classifies ovarian cancers by clinical outcome. Eur Radiol 2017;27(9):3991–4001. [DOI] [PMC free article] [PubMed] [Google Scholar]
- 25.Lakhman Y, Veeraraghavan H, Chaim J, et al. Differentiation of uterine leiomyosarcoma from atypical leiomyoma: diagnostic accuracy of qualitative MR imaging features and feasibility of texture analysis. Eur Radiol 2017;27(7):2903–2915. [DOI] [PMC free article] [PubMed] [Google Scholar]
- 26.Ueno Y, Forghani B, Forghani R, et al. Endometrial carcinoma: MR imaging-based texture model for preoperative risk stratification—a preliminary analysis. Radiology 2017;284(3):748–757. [DOI] [PubMed] [Google Scholar]
- 27.Corino VDA, Montin E, Messina A, et al. Radiomic analysis of soft tissues sarcomas can distinguish intermediate from high-grade lesions. J Magn Reson Imaging 2017 Jun 27 [Epub ahead of print]. [DOI] [PubMed] [Google Scholar]
- 28.Zhang Y, Oikonomou A, Wong A, Haider MA, Khalvati F. Radiomics-based prognosis analysis for non-small cell lung cancer. Sci Rep 2017;7:46349. [DOI] [PMC free article] [PubMed] [Google Scholar]
- 29.Gatenby RA, Grove O, Gillies RJ. Quantitative imaging in cancer evolution and ecology. Radiology 2013;269(1):8–15. [DOI] [PMC free article] [PubMed] [Google Scholar]
- 30.Wibmer A, Hricak H, Gondo T, et al. Haralick texture analysis of prostate MRI: utility for differentiating non-cancerous prostate from prostate cancer and differentiating prostate cancers with different Gleason scores. Eur Radiol 2015;25(10):2840–2850. [DOI] [PMC free article] [PubMed] [Google Scholar]
- 31.De Cecco CN, Ciolina M, Caruso D, et al. Performance of diffusion-weighted imaging, perfusion imaging, and texture analysis in predicting tumoral response to neoadjuvant chemoradiotherapy in rectal cancer patients studied with 3T MR: initial experience. Abdom Radiol (NY) 2016;41(9):1728–1735. [DOI] [PubMed] [Google Scholar]
- 32.Cusumano D, Dinapoli N, Boldrini L, et al. Fractal-based radiomic approach to predict complete pathological response after chemo-radiotherapy in rectal cancer. Radiol Med; (Torino: ) 2017 Dec 11 [Epub ahead of print]. [DOI] [PubMed] [Google Scholar]
- 33.Liu Z, Zhang XY, Shi YJ, et al. Radiomics analysis for evaluation of pathological complete response to neoadjuvant chemoradiotherapy in locally advanced rectal cancer. Clin Cancer Res 2017;23(23):7253–7262. [DOI] [PubMed] [Google Scholar]
- 34.Haralick RM, Shanmugam K, Dinstein IH. Textural features for image classification. IEEE Trans Syst Man Cybern 1973;SMC-3(6):610–621. [Google Scholar]
- 35.Fehr D, Veeraraghavan H, Wibmer A, et al. Automatic classification of prostate cancer Gleason scores from multiparametric magnetic resonance images. Proc Natl Acad Sci U S A 2015;112(46):E6265–E6273. [DOI] [PMC free article] [PubMed] [Google Scholar]
- 36.Daugman JG. Uncertainty relation for resolution in space, spatial frequency, and orientation optimized by two-dimensional visual cortical filters. J Opt Soc Am A 1985;2(7):1160–1169. [DOI] [PubMed] [Google Scholar]
- 37.Breiman L. Random forests. Mach Learn 2001;45(1):5–32. [Google Scholar]
- 38.Chawla NV, Bowyer KW, Hall LO, Kegelmeyer WP. SMOTE: synthetic minority over-sampling technique. J Artif Intell Res 2002;16:321–357. [Google Scholar]
- 39.Mitchell MW. Bias of the random forest out-of-bag (OOB) error for certain input parameters. Open J Stat 2011;1(3):205–211. [Google Scholar]
- 40.Moskowitz CS, Pepe MS. Comparing the predictive values of diagnostic tests: sample size and analysis for paired study designs. Clin Trials 2006;3(3):272–279. [DOI] [PubMed] [Google Scholar]
- 41.Lambregts DM, Rao SX, Sassen S, et al. MRI and diffusion-weighted MRI volumetry for identification of complete tumor responders after preoperative chemoradiotherapy in patients with rectal cancer: a bi-institutional validation study. Ann Surg 2015;262(6):1034–1039. [DOI] [PubMed] [Google Scholar]
- 42.van der Paardt MP, Zagers MB, Beets-Tan RG, Stoker J, Bipat S. Patients who undergo preoperative chemoradiotherapy for locally advanced rectal cancer restaged by using diagnostic MR imaging: a systematic review and meta-analysis. Radiology 2013;269(1):101–112. [DOI] [PubMed] [Google Scholar]
- 43.van den Broek JJ, van der Wolf FS, Lahaye MJ, et al. Accuracy of MRI in restaging locally advanced rectal cancer after preoperative chemoradiation. Dis Colon Rectum 2017;60(3):274–283. [DOI] [PubMed] [Google Scholar]
- 44.Mackin D, Fave X, Zhang L, et al. Measuring computed tomography scanner variability of radiomics features. Invest Radiol 2015;50(11):757–765. [DOI] [PMC free article] [PubMed] [Google Scholar]
- 45.van Velden FH, Kramer GM, Frings V, et al. Repeatability of radiomic features in non-small-cell lung cancer [(18)F]FDG-PET/CT studies: impact of reconstruction and delineation. Mol Imaging Biol 2016;18(5):788–795. [DOI] [PMC free article] [PubMed] [Google Scholar]
- 46.He L, Huang Y, Ma Z, Liang C, Liang C, Liu Z. Effects of contrast-enhancement, reconstruction slice thickness and convolution kernel on the diagnostic performance of radiomics signature in solitary pulmonary nodule. Sci Rep 2016;6(1):34921. [DOI] [PMC free article] [PubMed] [Google Scholar]
- 47.Tranchart H, Lefèvre JH, Svrcek M, Flejou JF, Tiret E, Parc Y. What is the incidence of metastatic lymph node involvement after significant pathologic response of primary tumor following neoadjuvant treatment for locally advanced rectal cancer? Ann Surg Oncol 2013;20(5):1551–1559. [DOI] [PubMed] [Google Scholar]
Associated Data
This section collects any data citations, data availability statements, or supplementary materials included in this article.


