

Abstract
Conserved water molecules are of interest in drug design, as displacement of such waters can lead to higher affinity ligands and in some cases, contribute towards selectivity. Bromodomains, small protein domains involved in the epigenetic regulation of gene transcription, display a network of four conserved water molecules in their binding pockets and have recently been the focus of intense medicinal chemistry efforts. Understanding why certain bromodomains have displaceable water molecules and others do not is extremely challenging, and it remains unclear which water molecules in a given bromodomain can be targeted for displacement. Here we estimate the stability of the conserved water molecules in 35 bromodomains via binding free energy calculations using all-atom grand canonical Monte Carlo simulations. Encouraging quantitative agreement to the available experimental evidence is found. We thus discuss the expected ease of water displacement in different bromodomains and the implications for ligand selectivity.
Bromodomains are small protein modules that recognize acetylated lysine on histones, and are involved in the epigenetic regulation of gene expression.1,2 Given their connection to a number of diseases, including cancer, inflammation and viral infection, they have recently been the subject of intense efforts for the development of chemical probes aimed at their validation as drug targets.3–6 Compounds targeting the bromodomain and extra-terminal (BET) family of bromodomains are currently already in clinical trials for the treatment of diverse malignancies, such as leukemia, nuclear protein of the testis (NUT) midline carcinoma, and progressive lymphoma.5 Despite the sequence diversity, there is a great deal of structural similarity between the binding sites of all known bromodomains as they all share acetylated lysine as the endogenous ligand. This makes the discovery of selective probes a challenging endeavour for bromodomains.
X-ray crystal structures of bromodomains reveal a conserved water network formed by 4 water molecules at the base of the binding site (Figure 1a).7,8 Recent studies have reported the complete or partial displacement of this four-water network. In 2014, Harner et al.9 reported the discovery an aniline-containing tricyclic fragment that was shown to bind deep into ATAD2, displacing all four conserved water molecules. In 2015, Fedorov et al.10 reported the displacement of all four conserved waters by salicylic acid from the binding pockets of a number of Family VIII bromodomains. The fragment led to the development of a nanomolar ligand, selective for the SMARCA and PB1 bromodomains (Family VIII). Gerstenberger et al.11 started from the same fragment and developed another potent chemical probe with a similar selectivity profile. At the same time, Sutherell et al.12 reported the discovery of another series of ligands, also targeting Family VIII and displacing all four waters from their pocket, based on a 2,3-dihydropyrrolo[1,2-a]quinazolin-5(1H)-one scaffold. Myrianthopoulos et al.13 reported the discovery of a pyrazoloisocoumarin ligand, selective for PB1(5), which too displaces the conserved water network of the protein. It is conceivable that the weaker stability of the water network in SMARCA and PB1 bromodomains (Family VIII) contributed to the selectivity of the developed inhibitors. To our knowledge, these are hitherto the only instances of complete displacement of the four-water network reported. Other studies have noticed the displacement of a single water molecule in specific bromodomains. For instance, Harner et al9 found that an aminotetrahydrothiazole fragment could displace W4 from ATAD2. Cox et al.14 noticed the displacement of W1 from the binding pocket of PHIP(2) (in Family III) by a thiourea fragment, while Zhu and Caflish15 reported the displacement of W1 from BRPF1 (a member of Family IV) by an isoquinolinone fragment. Recently, Crawford et al.16 described the discovery of ligands causing a rearrangement of the water network in BRD4(1) and TAF1(2) and the displacement of W3 and W4. The same behaviour of TAF1(2) was previously observed also by Flynn et al.17 while investigating bromodomain recognition of butyryl- and crotonyllysine. It has therefore become evident that some, or all, of the structured water molecules found in numerous bromodomain binding pockets might be displaceable. However, the rational identification of easily displaceable waters and water networks is almost impossible by simple inspection of the crystal structures. Even more arduous is the quantitative estimation of water stability, so that one cannot differentiate between a stable water molecule carrying a large free energy penalty for its displacement from a relatively unstable one.
Figure 1.

Structure of the bromodomain water network and proteins considered in this study. (a) Bromodomain fold with conserved water molecules highlighted as red spheres. The four conserved water sites are referred to as W1 to W4, and their location within the network topology is shown in the zoomed panel. (b) Phylogenetic tree of the human bromodomain family, where the 35 bromodomains considered in the study are highlighted in green.
A prominent hypothesis in medicinal chemistry is that the displacement of stable water molecules contributes favourably to the affinity of a compound due to the higher entropy of the displaced waters. In a classic study, Barillari et al. found that water molecules that were known to be have been displaced by a ligand were more likely to have a lower affinity than water molecules that were not known to be displaceable.18 As the transfer of stable water molecules from a binding site to bulk water incurs a cost in terms of free energy, the more tightly bound a set of water molecule are, the larger the free energy penalty is to displace them. Given that the free energy of binding of water molecules to a protein cannot be determined experimentally, it is necessary to resort to theoretical approaches. Recently, Vukovic et al. used inhomogeneous fluid solvation theory to estimate the binding thermodynamics of water in twenty bromodomains, although they did not focus on how the relative binding energies of the conserved network could be exploited to gain selectivity.[REF19] A new approach based on Monte Carlo (MC) simulation in the grand canonical (GC) ensemble was proposed by Ross et al.20,21 The method has the advantage of being able to identify preferred water molecules positions and at the same time rigorously calculate binding free energies in a single set of simulations. In addition, the approach naturally takes into account cooperative effects in water networks.20,22,23 By post-processing the trajectories, it is also possible to rigorously rank order every water molecule or network in the grand canonical region by their binding affinities.
Here, we use free energy calculations based on grand canonical Monte Carlo (GCMC) simulations to study the free energy penalty associated with the displacement of water molecules from all bromodomains with high-quality structural information currently available (Figure 1b). Encouraging quantitative agreement is found between the calculated water stabilities and the available experimental evidence of displacement. A number of bromodomains are found to be likely to have a weakly bound water network: in particular in Family VIII and ATAD2, in agreement with the observed displacement by recently developed ligands, but also in other bromodomains, such as PRKCBP1, KIAA1240, and PHIP(2). Overall, this study provides a wealth of quantitative information based on atomic-detail computer simulations that can be used by medicinal chemists to rationally choose which waters may be more amenable to displacement.
Results
General approach
Here, we will present the calculated water binding free energies for both the water networks and the individual water sites (W1 to W4 in Figure 1) found in 35 bromodomains. Throughout, we use binding free energy scores to quantify the affinities of the water networks (ΔGnetw) and individual molecules (ΔGW1 ΔGW2, ΔGW3, and ΔGW4). These scores are the contributions to the total water binding free energies the volumes of the networks or individual water molecules have (see Methods for a more detailed exposition). The binding free energies shown are the weighted mean and standard deviation of the scores obtained with the TIP3P, TIP4P, and SPC water models, where the accuracy of the water placement was used to determine the weights, as described in the Methods. The results are also shown in numerical format in Table 1, along with information about the X-ray structures used for the calculations. Additional results, concerning the ability of the approach to correctly identify the position of the conserved water molecules in the bromodomain binding pockets, are provided in Supplementary Figures 1 and 2 and are discussed in the Supplementary Discussion.
Table 1.
Free energy scores and simulation input structures for all bromodomains studied.
| Protein | Family | PDB-ID | ΔGnetwork | ΔGW1 | ΔGW2 | ΔGW3 | ΔGW4 |
|---|---|---|---|---|---|---|---|
| CECR2 | I | 3NXB | -1.3 ± 1.5 | -0.6 ± 0.8 | +0.9 ± 0.5 | -0.9 ± 0.4 | -1.1 ± 0.3 |
| FALZ | I | 3UV2 | -0.5 ± 1.2 | +1.7 ± 0.6 | +0.5 ± 0.6 | -1.2 ± 0.5 | -1.6 ± 0.5 |
| GCN5L2 | I | 3D7C | +0.8 ± 2.3 | -0.5 ± 0.7 | 0.0 ± 0.8 | +0.6 ± 0.5 | +0.6 ± 0.2 |
| PCAF | I | 3GG3 | -0.2 ± 1.7 | +0.2 ± 0.5 | -0.4 ± 0.6 | -0.1 ± 0.4 | +0.2 ± 0.7 |
| BRD2(1) | II | 4ALG | -2.5 ± 1.4 | -0.8 ± 0.5 | +0.2 ± 0.2 | -1.0 ± 0.3 | -1.0 ± 0.3 |
| BRD2(2) | II | 5BT5 | -2.4 ± 0.9 | -0.6 ± 0.5 | -0.0 ± 0.3 | -1.1 ± 0.2 | -0.8 ± 0.2 |
| BRD3(1) | II | 2NXB | -3.2 ± 0.4 | -0.7 ± 0.3 | +0.5 ± 0.3 | -1.3 ± 0.2 | -1.7 ± 0.1 |
| BRD3(2) | II | 3S92 | -3.5 ± 0.9 | -0.8 ± 0.1 | -0.9 ± 0.2 | -0.9 ± 0.3 | -1.0 ± 0.3 |
| BRD4(1) | II | 2OSS | -0.4 ± 1.0 | -0.1 ± 0.3 | +0.2 ± 0.3 | 0.0 ± 0.3 | -0.2 ± 0.3 |
| BRD4(2) | II | 2OUO | -4.2 ± 0.1 | -0.9 ± 0.1 | -1.2 ± 0.1 | -1.2 ± 0.1 | -0.9 ± 0.1 |
| BRDT(1) | II | 4KCX | +0.2 ± 1.6 | +0.2 ± 0.6 | -0.5 ± 0.5 | +1.0 ± 0.5 | -0.6 ± 0.2 |
| CREBBP | III | 4NYX | -2.7 ± 1.8 | +0.7 ± 0.9 | -1.1 ± 0.4 | -1.1 ± 0.3 | -1.2 ± 0.3 |
| EP300 | III | 5BT3 | +0.8 ± 0.7 | +0.4 ± 0.1 | -0.3 ± 0.3 | +0.1 ± 0.3 | +0.4 ± 0.6 |
| PHIP(2) | III | 3MB3 | +2.9 ± 0.9 | +1.0 ± 0.7 | +1.1 ± 0.6 | +0.5 ± 0.1 | +0.3 ± 0.4 |
| WDR9(2) | III | 3Q2E | +0.4 ± 0.9 | +0.2 ± 0.3 | +0.7 ± 0.3 | -0.2 ± 0.3 | -0.2 ± 0.1 |
| ATAD2 | IV | 4QUT | +5.2 ± 1.2 | +5.0 ± 0.5 | -0.7 ± 0.3 | +0.1 ± 0.9 | +0.5 ± 0.3 |
| BRD1 | IV | 5AME | -1.4 ± 1.1 | -0.4 ± 0.4 | -1.8 ± 0.2 | 0.0 ± 0.3 | +0.7 ± 0.4 |
| BRD9 | IV | 4XY8 | +1.3 ± 1.6 | +2.3 ± 1.5 | -0.9 ± 0.3 | -0.2 ± 0.3 | -0.0 ± 0.5 |
| BRPF1B | IV | 5C7N | -4.4 ± 0.8 | -1.0 ± 0.5 | -1.3 ± 0.4 | -1.2 ± 0.2 | -1.0 ± 0.1 |
| KIAA1240 | IV | 3LXJ | +1.6 ± 1.1 | +1.6 ± 0.1 | -0.9 ± 0.3 | +1.0 ± 0.8 | +0.2 ± 0.3 |
| BAZ2A | V | 4QBM | +0.1 ± 2.1 | +0.4 ± 0.7 | -0.5 ± 0.2 | +0.1 ± 0.9 | -0.1 ± 0.7 |
| BAZ2B | V | 4QC3 | -0.5 ± 1.7 | +2.6 ± 0.3 | -1.1 ± 0.4 | -1.2 ± 0.4 | -1.2 ± 0.6 |
| TIF1α | V | 4YBM | +1.4 ± 2.1 | +1.5 ± 0.7 | +1.5 ± 0.5 | -0.5 ± 0.7 | -0.8 ± 0.7 |
| PRKCBP1 | VII | 4COS | +4.6 ± 1.1 | +1.6 ± 0.3 | +1.3 ± 0.4 | +0.8 ± 0.4 | +0.9 ± 0.5 |
| TAF1L(2) | VII | 3HMH | -0.5 ± 1.2 | +0.3 ± 0.4 | +0.2 ± 0.5 | +0.2 ± 0.7 | -1.1 ± 0.2 |
| TAF1(1) | VII | 3UV5 | -0.1 ± 1.1 | -0.5 ± 0.6 | -0.0 ± 0.2 | 0.0 ± 0.3 | -0.0 ± 0.1 |
| TAF1(2) | VII | 3UV4 | +1.2 ± 0.8 | +1.5 ± 0.7 | +0.6 ± 0.4 | -0.4 ± 0.2 | -0.6 ± 0.2 |
| ASH1L | VIII | 3MQM | +3.1 ± 0.9 | +2.1 ± 0.5 | -0.1 ± 0.5 | -1.2 ± 0.3 | +2.1 ± 0.5 |
| PB1(1) | VIII | 3IU5 | +3.3 ± 0.5 | +1.5 ± 0.5 | +0.7 ± 0.2 | +1.1 ± 0.2 | -0.1 ± 0.4 |
| PB1(2) | VIII | 3LJW | +2.9 ± 1.0 | -0.6 ± 0.3 | +1.7 ± 0.4 | +0.7 ± 0.1 | +1.2 ± 0.4 |
| PB1(3) | VIII | 3K2J | +3.6 ± 0.3 | +1.2 ± 0.3 | +0.2 ± 0.7 | +1.7 ± 0.2 | +0.6 ± 0.6 |
| PB1(4) | VIII | 3TLP | +3.9 ± 0.9 | -1.4 ± 0.2 | +3.2 ± 0.4 | +0.1 ± 0.4 | +1.9 ± 0.4 |
| PB1(5) | VIII | 3MB4 | +2.0 ± 0.7 | +1.0 ± 0.1 | +0.2 ± 0.3 | -0.4 ± 0.4 | +1.1 ± 0.4 |
| SMARCA2 | VIII | 4QY4 | +7.0 ± 1.8 | +4.2 ± 2.2 | -0.1 ± 0.2 | +1.2 ± 0.2 | +2.0 ± 0.4 |
| SMARCA4 | VIII | 2GRC | +1.8 ± 1.1 | +0.9 ± 0.8 | -0.4 ± 0.6 | +0.5 ± 0.1 | +0.6 ± 0.4 |
Stability of the water network
Figure 2a ranks the bromodomains by the stability of their water network (ΔGnetw). As expected, most of the bromodomains from Family VIII rank low in the chart, with SMARCA2 showing the lowest free energy score for its water network with ΔGnetw = +7.0 kcal mol-1. Members of Family II tended to be ranked quite high instead; BRD4(2) had the second highest free energy score with ΔGnetw = -4.2 kcal mol-1, after BRPF1B which had ΔGnetw = -4.4 kcal mol-1. The large range of ΔGnetw observed (11.4 kcal mol-1) might suggest a tendency to magnify the (in)stability of the water networks. Family I was predicted to have networks of intermediate stability between those of Family II and VIII, with ΔGnetw ranging from -1.3 kcal mol-1 for CECR2 to 0.8 kcal mol-1 for GCN5L2. Similarly, the bromodomains in Family V (BAZ2A, BAZ2B, TIF1α) appear to have a water network of intermediate stability. Most families did not cluster around a specific free energy value (Figure 2b), suggesting that there might be enough difference in the water-network stability to potentially be exploited for the engineering of intra-family selectivity for specific bromodomains. Bromodomains in Family II were predicted to have stable networks (ΔGnetw < -2 kcal mol-1); interestingly, with the exception of BRD4(1) and BRDT(1), whose waters were predicted to be less tightly bound (ΔGnetw of -0.4 and +0.2 kcal mol-1 respectively). In Family III, PHIP(2) seemed to have less stable networks as compared to other bromodomains in the family. In fact, PHIP(2) was one of the few bromodomains that displayed a network instability comparable to that of bromodomains in Family VIII. Family IV also showed a difference in stability between its bromodomains; the related proteins ATAD2, KIAA1240, and BRD9 were predicted to have a less stable network than BRD1 and BRPF1B. In particular, the network in ATAD2 was predicted to be highly unstable (ΔGnetw = +5.2 kcal mol-1); conversely, the one in BRPF1B was predicted to be highly stable (ΔGnetw = -4.4 kcal mol-1). In Family VII, the network in PRKCBP1 was too predicted to be particularly unstable (ΔGnetw = +4.6 kcal mol-1) compared to the other proteins in the family. The only proteins with a lower free energy score than PRKCBP1 were ATAD2 and SMARCA2.
Figure 2.

Stability of the water network measured as its binding free energy. (a) The 35 bromodomains considered are sorted by predicted network stability and colour-coded by family; the bars and their errors show the weighted means and standard deviations of the three water models. (b) Bromodomains and their overall results divided by family; here too the weighted means and standard deviations across the three water models are shown. (c) Bromodomains divided by family with the results for each water model.
To evaluate more quantitatively the agreement between the calculated network stabilities (ΔGnetw) and the experimental evidence of displacement, we treat this as a classification problem. The free energy score for each bromodomain estimates the probability of its water network being displaceable versus non-displaceable. If we assume that only bromodomains for which there is experimental evidence of network displacement do indeed have a displaceable water network, then only PB1(2), PB1(3), PB1(4), PB1(5), SMARCA2, SMARCA4, and ATAD2 belong to this category. Based on these data, the area under the receiver operating characteristics curve (AUC-ROC) is of 0.93 (Figure 3a), with 95% confidence interval of 0.83-1.00, which indicates an excellent discriminatory ability. All true positives are recovered when ΔGnetw ≥ 1.8 kcal mol-1. Nevertheless, the ROC should be considered as an estimate, as many of the water networks in the bromodomains have not been experimentally tested for displaceability.
Figure 3.

Quantitative comparison of calculated free energy scores to experimental data. (a) Receiver operating characteristics (ROC) curve for the binary classification of the four-water networks as displaceable versus non-displaceable, based on the ΔGnetw scores. The water networks of PB1(2), PB1(3), PB1(4), PB1(5), SMARCA2, SMARCA4, and ATAD2 were considered to be displaceable based on experimental evidence; the networks of all other bromodomains were considered as non-displaceable. The area under the curve (AUC) is reported; its 95% confidence interval is 0.83-1.00. (b) Agreement between the affinity changes (ΔΔGbinding) observed by Crawford et al.6 and the calculated free energy penalties for the displacement of W3 and W4 (–ΔGW3–ΔGW4). The corresponding numerical data are in Supplementary Table 5. Triangular markers indicate the data points for which ΔΔGbinding values were determined by assuming an affinity of 20 μM for those affinities over the limit of detection; note that some of these data points overlap exactly. The shaded area represents the boundaries of the 1.4 kcal mol-1 error (about 10-fold error in Kd) for the calculated values. The root mean square error (RMSE) and Pearson correlation between experimental and calculated values are reported; their 95% confidence intervals are 0.5-1.1 kcal mol-1 and 0.23-0.89, respectively.
Without free energy calculations, it is otherwise difficult to rationalize the experimental water stabilities using the sequences and inspection of the binding site structures of the bromodomains. Indeed, the residues closest to the water network tend to be fairly conserved (Supplementary Figure 3) despite the high overall sequence variation among bromodomains. Visual inspection of the electrostatic surface potential, or analysis of pocket volumes (Supplementary Figure 4), do not reveal any obvious trends. In particular, using volume as a measure of water-network stability returns an AUC-ROC of 0.64, with a 95% confidence interval of 0.38-0.86; as a random predictor has an AUC of 0.5, the pocket volume is not a significantly better predictor than random. Long-ranged interactions, as well as more indirect effects such as changes in the fluctuations or populations of rotameric states of water-adjacent residues, or even disturbance of solvent dynamics surrounding the water molecules of interest, may all be factors affecting water stability in a complex, composite fashion. These effects are naturally accounted for in all-atom, explicit solvent, free energy calculations.
The differences between the binding free energy scores of the water network between bromodomains with particularly high sequence and structural similarity, such as CREBBP and EP300, can be understood as arising from both the statistical uncertainty and uncertainty in the water model. The error bars in Figure 2 are the weighted standard deviations over the estimated scores of three water models. In the case of CREBBP and EP300, the binding free energy scores agree within two standard deviations. An additional source of statistical uncertainty that is unaccounted for arises from the starting X-ray structure of each bromodomain. To quantify the magnitude of this uncertainty, the GCMC simulations and binding score calculations were repeated for BRD4(1) and BRD4(2) using different starting X-ray structures (Supplementary Table 1). Between BRD4(1) and BRD4(2), the free energy scores for the four-water network had standard deviations up to 0.9 kcal mol-1, and the single-water scores had standard deviations up to 0.4 kcal mol-1. Thus, the starting structure contributes noise to the binding free energy scores despite not being explicitly reported. It therefore is prudent to focus on large differences, even when the uncertainty would suggest precise results. Nonetheless, the results appear to carry a detectable quantitative signal due to the large range of binding free energy scores (Figure 3).
The presence of binding free energies with positive values might appear surprising since, in principle, a positive binding free energy typically implies that no waters would be present within this volume at equilibrium. However, as discussed in the Methods, ΔGnetw is the sum of the free energy scores for each of the four water molecules. In contrast, the water binding free energy for the whole GCMC region was rigorously calculated with grand canonical integration (GCI) and was always found to be negative (Supplementary Tables 2-4). As such, ΔGnetw represents only the free energy contribution of the four water sites to the binding free energy of the whole grand canonical region. While this contribution might be positive, the contribution from all other waters in the grand canonical region make the overall binding free energy negative. ΔGnetw can also be interpreted as the free energy of binding (or displacing) the water network in the absence of the less tightly bound waters. Thus, in this analysis it is implicitly assumed that part of the cavity may have already been dehydrated. We postulate that ΔGnetw will be a reasonable predictor for how easily the network will be displaced because a ligand will likely displace other waters before reaching the most stable and buried ones. Therefore, positive ΔGnetw values imply that there may be a free energy gain upon displacing the network when the less stable water molecules have already been removed. However, we would nonetheless advise to primarily interpret the results in relative (i.e. comparing different bromodomains) rather than absolute terms. In addition, the study of water stability in apo proteins, without focusing on specific ligands, involves necessary approximations and assumptions despite potentially being able to uncover more general trends in water stability. In order to know more accurately whether a specific ligand is able to displace a certain group of water molecules (which may or may not form a network), free energy calculations of the specific ligand in the protein binding pocket are needed. This, on the other hand, limits the observations made to the specific ligand only. By focusing only on the apo proteins, we effectively trade-off some model realism and thus likely some predictive power for results of potentially broader applicability.
Figure 2c shows the differences in predicted ΔGnetw between the three water models employed. The differences are also reflected in the uncertainties shown in panels a and b of the same figure, however, with the contributions weighted according to the quality of the water placement. Overall, the three models showcase similar trends. In fact, ΔGnetw values for all three models correlate with each other, with a Pearson correlation coefficient of 0.69 between TIP3P and TIP4P, 0.78 between TIP3P and SPC, and 0.74 between TIP4P and SPC. In terms of absolute difference, the RMSD between ΔGnetw values was about 2 kcal mol-1. Thus, the different water models appear to capture similar trends but provide somewhat different results quantitatively; this is nonetheless accounted for in the shown uncertainties. The distribution of the network free energies for the three water models is shown in Supplementary Figure 5.
Stability of individual water molecules
In addition to the whole water network, the stability of individual water sites was also investigated. Figure 4 shows the predicted free energies for the individual water sites (W1, W2, W3, and W4), providing an overview of the stability of each site in different bromodomain families; 95% of the water binding free energies fall in the range between -2 and +2 kcal mol-1. W1 was the site for which the distribution of scores was most shifted towards values indicating lower stability. Family I, II, and III displayed a relatively balanced water stability across all four sites. In Family IV, the W2 site appeared stable across all proteins, while W1 was predicted to be highly unstable for some bromodomains. In Family V, waters at W1 were predicted to be the least stable. In this scenario where a single water site seems particularly unstable, trying to rationally target a single water molecule for displacement might be an alternative strategy to the displacement of the whole network. In Family VII, there is a trend for which water was predicted to bind more tightly going from W1 to W4. However, targeting W2 or W3 alone for displacement might be challenging considering they sit below W1 and W4; from the viewpoint of ligand geometry it might therefore be easier to target W1 or W4 only, W1 and W2 together, or W3 and W4 together. The waters in the pockets of Family VIII bromodomains are poorly stable overall; it is the only family for which the median of the free energy distributions is above zero for all four water sites. In particular, W1 and W4 were predicted to be unstable (ΔG > 0 kcal mol-1) in most cases.
Figure 4.

Swarm and box plots showing the distribution of the stabilities of individual water sites by family. The boxes show the first, second, and third quartiles of the data, while the whiskers are up to 1.5 times the interquartile range.
Figure 5 provides more detail on the results obtained for all four water sites. The heatmap on the left-hand side of the figure shows the weighted mean of the binding free energies for the water site W1 to W4 obtained from the three water models; the map on the right-hand side shows the standard deviations, which summarises the discrepancy between the water models. Of interest are the different stabilities of the four water sites in FALZ, where W1 and W2 were predicted to be considerably more unstable than W3 and W4. In Family II, the waters were predicted to be stable not only as a network but also as individual sites. Figure 5 reveals that the lower predicted stability of the water network in BRD4(1) was due to an overall lower stability of all water sites, rather than to the instability of specific sites. In Family III, a trend of poor W1 stability emerged. In PHIP(2), also W2 was predicted to be rather unstable. In Family IV, the least stable sites were identified as being W1 in ATAD2, KIAA1240, and BRD9. In addition, W3 and W4 in ATAD2, BRD1, and KIAA1240 were predicted to be slightly unstable. The ΔGW1 value in ATAD2 is particularly large (+5.0 kcal mol-1); the fact that the closely related protein KIAA1240 also shows an unstable water at the W1 site (+1.6 kcal mol-1) supports the hypothesis that this site might indeed have low affinity for water and thus be more easily targetable than the other sites. Among the members of Family V, BAZ2B and TIF1α were predicted to have a poorly stable W1 site. In TIF1α, also W2 was predicted to be unstable, suggesting that this part of the binding pocket could be a good target for water replacement. These results are in line with what was observed by Huang et al.23 in BAZ2B with mixed solvent simulations, where W1 was the site most likely to be displaced by methanol, ethanol, and DMSO (when considering the four sites here studied). In CREBBP, ethanol and DMSO were found to be most likely to displace W1, again in agreement with the results of this study, while methanol displaced W3 more often than W1. In Family VII, PRKCBP1 displayed poor stability for all four of the water sites. Similarly, in Family VIII bromodomains most sites were identified as being poorly stable. The trend of high instability at W4 is in agreement with a previous molecular dynamics study of water thermodynamics in PB1(5) versus BRD4(1), in which it was hypothesized that the instability at this position is caused by a ~90° rotation of a backbone carbonyl group adjacent to W4.10
Figure 5.
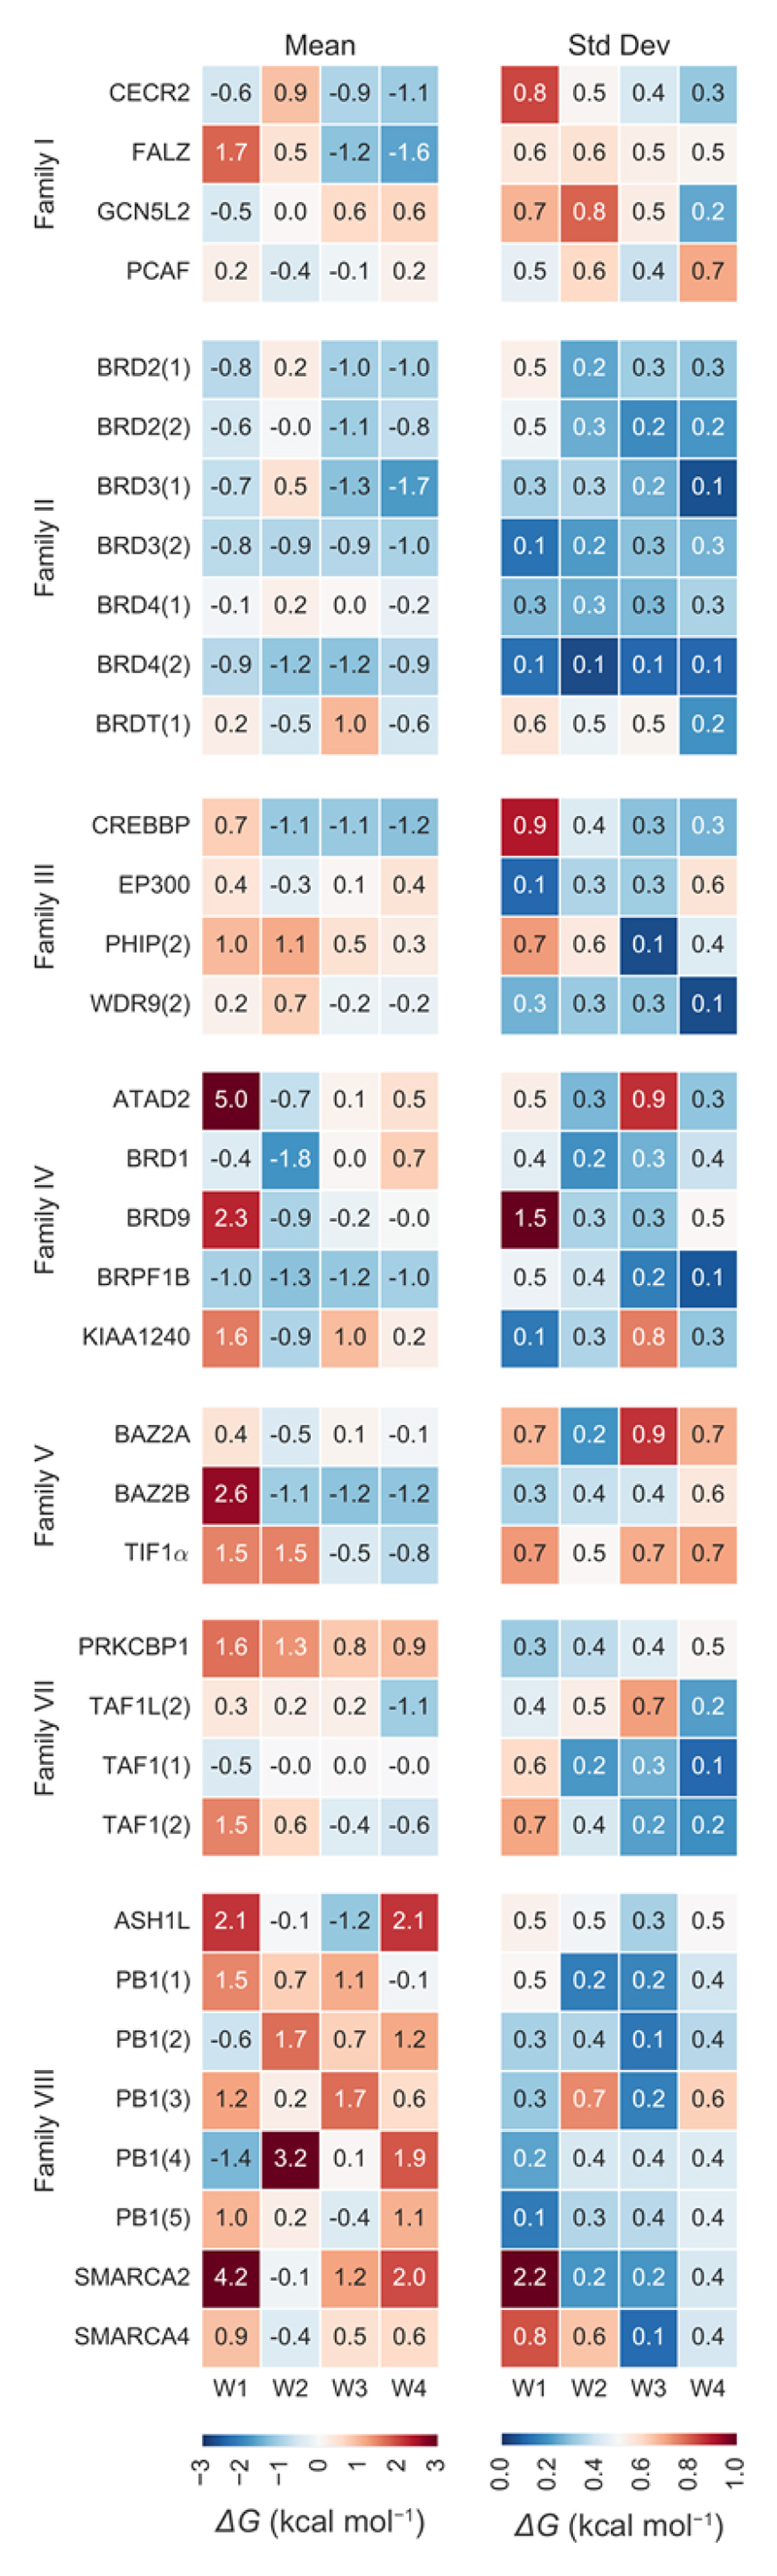
Stability of individual water sites. The heatmap on the left shows the predicted binding free energies as the weighted mean of the three water models for each of the four water sites. The heatmap on the right shows the uncertainty in the estimate as the weighted standard deviation from the free energy values obtained with the different water models.
The water at site W1 has been shown to be displaceable from the pockets of BRPF1B and PHIP(2).14,15 In the fragment screen that discovered a number of BRPF1B binders,15 only fragment 5 (1-isoquinolinone; PDB-ID 5C87) out of nineteen ligands displaced W1. In the fragment screen that identified four hits for the atypical bromodomain PHIP(2),14 only one (a thiourea; PDB-ID 5ENB) displaced W1. In both cases, the displacement did not result in higher affinities when compared to other hits. W1 was indeed predicted to be one of the least stable sites in both BRPF1B and PHIP(2), despite the relatively large statistical error (Figure 5). However, for BRPF1B, the displacement of W1 was predicted to carry a large free energy penalty of about 1 kcal mol-1. Harner et al.9 showed instead how W4 could be displaced from ATAD2 by a fragment containing an aminothiazole group (fragment 12,; PDB-ID 4TZ8). W4 was indeed predicted to be the second least stable site in ATAD2.
Implications for the design of selective bromodomain ligands
Reports in the literature have showed how differential displacement of water molecules can lead to selective ligands. 25–30 The rationale behind the engineering or enhancing of the selectivity of a ligand for similar proteins directly follows from the displacement energetics: if the displacement of one or more water molecules from protein “A” carries a small free energy penalty, but the displacement from protein “B” carries a large penalty, then the difference in the displacement free energies will result in the ligand binding with higher affinity to protein “A” than protein “B”. However, it is important to note that differential water stability is not the only contribution towards ligand selectivity. As the different water stabilities must arise from differences in protein sequence and structure, the ligand will, by necessity, also interact differently with the protein target. It is nonetheless plausible that differential water stabilities would at least contribute toward the observed selectivity. Whilst bearing this in mind, the data in this study may be used to estimate the contribution of differential water stability in bromodomains towards the selectivity of a hypothetical ligand displacing one or more of the four conserved water molecules.
Based on this argument, plots where bromodomains are ranked according to their predicted water binding free energies (Figure 2a and Figure 6) could help guide medicinal chemists in the design of selective bromodomain probes. From Figure 2a one can infer that a ligand that were to displace the whole network from SMARCA4, which has a water binding free energy score of about 2 kcal mol-1, would also be able to bind to all other bromodomains in Family VII, as well as PHIP(2), PRKCBP1, and ATAD2. On the other hand, it would incur in a large free energy penalty for the binding to BRD2, BRD3, or BRD4 bromodomains. The same rationale can be exploited for intra-family selectivity: e.g. PRKCBP1 was predicted to have a particularly unstable water network (Figure 2a), contrary to other proteins in the same family, TAF1(1), TAF1(2), and TAF1L(2). Similarly, BRD4(1) and BRDT(1) appeared to have more weakly bound water molecules when compared to other bromodomains in Family II, and this may provide a strategy for the selective targeting and thus further study of these bromodomains with established pharmacological interest. 31 Another interesting case is that of PHIP(2), which was predicted to have an unstable water network as compared to the other bromodomains in the same family.
Figure 6.

Ranked water stability for each hydration site. The 35 bromodomains considered are sorted by the predicted stability of water in their W1, W2, W3, and W4 sites. The more negative the free energy, the more difficult to displace water from the site; at the top of the plots are the bromodomains for which it is expected to be most difficult to displace a water from the specific site, while at the bottom of the plots are those bromodomains for which it is expected to be energetically easier to displace the water molecule. Bromodomains are colour-coded by family, the bars and their errors show the weighted means and standard deviations of the three water models. Analogous plots for combination of water sites can be found in Supplementary Figure 6.
Analogous considerations can be made for the partial displacement of the water network. In Figure 6, bromodomains are ranked according to the water binding free energy to each of their four hydration sites (W1 to W4), from stronger (top) to weaker (bottom) affinities. As an example, W4 was predicted to be unstable mainly in PB1 and SMARCA bromodomains; thus, one can speculate that not only ligands displacing the whole network, but also those displacing only W4, might retain their selectivity against other bromodomain families. Bromodomains from Family IV and V have among the lowest stability for W1, so that displacing W1 might help if selectivity for these families is of interest; given the fact that W2, W3, and W4 were all predicted to be more stable than W1, targeting W1 alone rather than the whole network may be a more viable strategy. A similar analysis can be done for the other bromodomains, and for all four water sites. In addition, any combination of water sites could be targeted by the same ligand. Supplementary Figure 6 ranks bromodomains by the stability of the combinations of hydration sites that are expected to be most easily targetable with a single ligand (displacement of W1+W2, W3+W4, W1+W2+W3, and W2+W3+W4), and can be interpreted as it was done here for the whole network and the individual sites.
It is interesting to compare the water stabilities calculated here with the work of Crawford et al.16 The authors systematically modified the size of the aliphatic side chain in a 6-methyl pyrrolopyridone ligand (compound 2), targeting the conserved water network, and studied how this affected the affinity of the ligand for eight different bromodomains across five families. The authors found that two different substituents could displace W3 and W4 from their canonical location in BRD4(1) and TAF1(2). Specifically, replacing the methyl with a trans-crotyl (compound 4 in Crawford et al.) or with 1-butene moiety (compound 5) resulted in the displacement of W3 and W4 from BRD4(1) and TAF1(2) (PDB-IDs 5I88 and 5I1Q). The authors studied the effect of these substitutions on ligand affinity also in BRD4(2), CREBBP, BRPF1B, BRD9, TAF1(1), and CECR(2). However, it was shown how the longer aliphatic side chain is accommodated into the pocket without displacing any water in BRD9 and CECR2.16,32 Extending the methyl group by three more carbon atoms generally resulted in different degrees of affinity loss for the six bromodomains in which displacement took place, which can be related to the free energy penalty associated with the displacement of W3 and W4 (– ΔGW3 – ΔGW4). To attempt a quantitative comparison to the data in Crawford et al., we derive approximate binding free energies from the IC50 values and assume an equal affinity (20 μM) for all measurements over the limit of detection of 20 μM. In such a way, we can directly compare the loss of affinity of ligands 4 and 5 over ligand 2 (ΔΔGbinding) to the free energy penalty for the displacement of W3 and W4 (– ΔGW3 – ΔGW4). It is found that the calculated free energy scores are in good agreement with the changes in binding free energy for compounds 4 and 5, with a root mean square error of 0.8 kcal mol-1 (Figure 3b). The Pearson correlation is 0.57, with a 95% confidence interval of 0.23–0.89; when assuming affinities >20 μM for the ones over the limit of detection, the correlation increases further (0.61, 0.64, and 0.65 for affinities of 30, 50, and 100 μM respectively). Thus, despite the limitations in our model and approach, the present results are in broad agreement with the trends observed by Crawford and colleagues. In fact, Supplementary Figure 6 readily highlights how displacing this pair of water molecules (W3 and W4) would be expected to be more arduous in CREBBP, BRPF1B, and BRD4(2), and easier in BRD4(1), TAF1(1), and TAF1(2). We anticipate that full binding free energy calculations of the individual ligands with the bromodomains in combination with GCMC will improve the quantitative accuracy of the relative affinity predictions.
Discussion
In this work, we estimated the stability of the water network found in bromodomains using all-atom Monte Carlo simulations and free energy calculations in the grand canonical ensemble. To limit the deficiencies of specific water models, multiple models have been used, and their ability to predict the position of the structured waters was taken as a proxy for the reliability of the free energy estimates.
It is important to bear in mind that the energetics of water displacement is only one of the factors determining the ligand binding affinity. Eventually, it is the specific nature of the ligand that will determine whether it can bind a pocket and displace conserved waters. Different ligands will have different abilities to target certain bromodomains and water sites, but it is expected that it will be easier to discover a ligand that displaces the waters that are predicted to be less tightly bound. Experimental and computational observations together suggest that it is possible to design ligands that displace water molecules with a predicted displacement free energy penalty of about 1-2 kcal mol-1. However, the displacement penalty needs to be compensated by favourable ligand-protein interactions, so that the displacement alone does not result in any affinity gain per se. This is in line with the fact that in the work by Crawford et al. 16,32 it was observed how in almost all instances the displacement of stable water molecules resulted in an affinity loss for the ligands studied.
As already mentioned, the current study is based on a number of approximations that may limit its predictive ability, such as the use of apo structures, single X-ray starting models, and classical force fields. Despite all the known (and unknown) limitations in the study, the presence of a detectable signal in the ROC analysis and the moderate accuracy in the relative binding free energy predictions (Figure 3) gives us confidence that the results shown, while imperfect, are still useful. Therefore, whilst bearing in mind the necessary assumptions and approximations that concern computer simulation of biomolecules, these predictions are expected to provide better guidance than human judgment based only on visual inspection of protein structures, and provide a quantitative measure of the relative difficulty of displacing water molecules from different bromodomain proteins. Our results offer a state-of-the-art estimate of water stability across many bromodomains and, by virtue of the discussed relation with ligand selectivity, also guidance and testable predictions for future medicinal chemistry efforts.
Methods
Systems Preparation
The three-dimensional coordinates of the 35 bromodomains here studied were taken from the Protein Data Bank (PDB)33; all PDB-IDs are provided in Table 1. Only structures determined by X-ray crystallography and without missing non-terminal residues were selected. If multiple structures for a bromodomain were available, a single structure was manually chosen based on resolution and model fit. If multiple chains were present in the deposited structure, only chain A was retained. All organic molecules and ions were removed, while water molecules were kept. Missing side-chain atoms were modelled using the WHAT-IF server.34 All structures were superimposed to the BRD4(1) structure based on the position of the Cα atoms using PyMOL v1.4. This allowed the definition of a single grand canonical region (i.e. GCMC box), which was then used for the free energy calculations of all bromodomains. The grand canonical region is that volume of the simulation box which is simulated in the grand canonical ensemble, and in which the number of water molecules is allowed to fluctuate. Proteins were protonated with the program reduce35 provided with the Amber16 package, which also optimizes the orientations of Asn/Gln side chain amides, and His rings. Values of pka were determined with propka v3.136,37 for Asp, Glu, Lys and Cys residues, and they were (de)protonated only in the presence of a large difference (>1.0) between predicted pka and the target pH of 7.0. Finally, a short minimization (100 steps) in vacuo using a steepest descent algorithm was carried out with the sander program (Amber16)38 in order to remove potential steric clashes.
Water Hydration Free Energy
The water binding free energies (and binding free energy scores) express the free energies of adding water to the bromodomain pockets relative to adding the same quantity of water to bulk solvent. The reference state of the reported binding free energies is therefore bulk water, such that the hydration free energy of water required estimation. The hydration free energy of the TIP3P, TIP4P, and SPC water models were calculated using a replica-exchange double-decoupling protocol with the ProtoMS 3.2 simulation package. A dual topology protocol was used for the water molecule to be decoupled, which was simulated in a solvated cubic box of approximately 22 x 22 x 22 Å. The system was simulated in the isothermal-isobaric ensemble, at 1 atm and 298 K, with periodic boundary conditions. A 10 Å molecular cut off was applied to the non-bonded interactions. A water molecule was decoupled using 32 linearly spaced λ windows; a soft-core potential was used both for electrostatic and Lennard-Jones interactions. 5 million (M) equilibration Monte Carlo (MC) moves were performed before starting to collect data from 500 M moves. Exchanges between neighboring λ windows were attempted every 0.2 M steps with a Hamiltonian replica exchange scheme. Data for analysis were saved to file every 0.1 M moves, while coordinates every 10 M moves. The calculations were repeated five times for each water model. Hydration free energies were estimated using the Multiple Bennet Acceptance Ratio (MBAR)39 using the calc_dg.py script part of the ProtoMS 3.2 tools, and taking into account the data from all five calculations. Using this protocol, the hydration free energies for the TIP3P, TIP4P, and SPC water models were estimated to be respectively -6.18 ± 0.04, -6.16 ± 0.04, and -6.26 ± 0.02 kcal mol-1, in good agreement with the experimental value of -6.32 kcal mol-1.40
Replica-Exchange Grand Canonical Monte Carlo Simulations
The simulation package ProtoMS 3.3 was used for replica-exchange grand canonical Monte Carlo simulations and data analysis. Proteins were modelled with the Amber ff14SB force field, 41 and water with the TIP3P, TIP4P, and SPC models.42,43 The grand canonical box was defined manually so to encompass the binding site of the four-water network of interest. The same box was used for all proteins, which had been previously aligned for this purpose. Protein residues that were further than between 16 and 20 Å away from the grand canonical region were removed, with the exact distance chosen to retain whole residues. The systems were solvated up to a radius of 30 Å around the grand canonical region. All simulations were carried out at 298 K, and non-bonded interactions were calculated with 10 Å molecular cut off. Before initiating the GCMC simulations, the systems were equilibrated using 50 M solvent-only moves in the canonical ensemble, in order to allow the water to equilibrate around the protein. Water molecules present in the pre-defined GCMC box were then removed, and this set of coordinates represented the starting point of the GCMC simulations.
A set of 32 replica-exchange simulations were performed at a range of Adams values from -32 to -1 at unit increments. For each window, 15M equilibration moves were performed only on the grand canonical solvent, with insertion, deletion, and translation/rotation moves generated at the same ratio. An additional 5 M equilibration moves followed where the protein and solvent molecules were also sampled, before starting the production simulation of 50 M moves. Protein sampling was carried out over angles and dihedrals. If a protein had residues removed because they were further than 20 Å from the grand canonical region, the backbone of their neighboring residue(s) was fixed. Half of the MC moves were dedicated to the grand canonical water molecules, and the other half was split between protein residues and solvent in proportion to the number of solvent molecules and protein residues, according to the ratio of 1:5. Exchanges between neighboring replicas were allowed every 0.2 M steps. Data for analysis, such as energies, number of GC solutes present, and coordinates were saved to file every 0.1 M moves. This procedure was repeated three times for each protein and water model studied, i.e. for each bromodomain 9 calculations were carried out, 3 for each water model here considered (TIP3P, TIP4P, and SPC).
Grand Canonical Integration and Data Analysis
The binding free energy of water molecules was computed using grand canonical integration (GCI). 20,21 This method consists of running a series of GCMC simulations at a range of Adams values (or equivalently chemical potentials) and recording the average water occupancy of the GCMC region. As water content increases with the Adams value, the GCMC simulations act as in silico water titration experiments. As Supplementary Figure 7a highlights, the area under the titration curve is related to the binding affinity of water to the GCMC region.
GCI was calculated using the calc_gci.py script that is part of the ProtoMS 3.3 tools, and the data from the three repeats was analyzed together. The amount of data discarded as equilibration was determined using the automatic equilibration detection tool calc_series.py from ProtoMS 3.3. The same amount of data was discarded from all windows after determining the average number of moves needed for equilibration.
GCMC simulations were performed where water was only inserted and deleted within the predefined cuboid (Supplementary Figure 7a). In order to focus only on the four water molecules forming the conserved network in bromodomains, the water occupancy within sub-volumes that represented the individual four water molecules were analyzed separately with GCI. Typical titration data for these sub-volumes is shown in Supplementary Figure 7b. These sub-volumes were defined as spheres with a radius of 1.4 Å where the centers were determined by the positions of the four crystallographically resolved water oxygens forming the network (Supplementary Figure 7b).The average number of grand canonical waters found within the volume of these 4 spheres was obtained for every Adams value by post-processing the simulation frames. With this information, it was possible to perform the GCI procedure for each of the four individual water sites (as in Supplementary Figure 7b), taking into account only the contribution from these sub-volumes; the binding free energies shown for the individual sites are the result of this procedure. The binding free energy of the four-water network was obtained by adding the binding free energies of each individual site. In some instances, the location of water molecules within the network is not resolved in the X-ray structures: W1 to W4 in ASH1L; W2 to W4 in KIAA1240; W1, W2, and W4 in PB1(3); W4 in PB1(4); W2 and W4 in SMARCA2. For these water sites, their predicted locations as obtained from the MC simulations were used as the centers of the spheres defining the sub-volumes. Water locations in the binding site were calculated by clustering the grand canonical waters from the simulations at the Adams value corresponding to the state with the lowest binding free energy. An average linkage hierarchical clustering procedure with a cut-off of 2 Å was performed with the calc_clusters.py script to identify the location with highest water occupancies. For hydration sites where the location of the water oxygen is resolved, the cluster center closest to it was selected as being the predicted location for that site. For hydration sites without a reference positions obtained by X-ray, the cluster centers forming the typical network found in bromodomain pockets were identified by visual inspection.
It is important to note that while the water binding free energy that is calculated for the whole GCMC region rigorously represents the free energy of water binding to this volume, the binding free energies obtained via the sub-volume analysis are less rigorous. Fully rigorous binding free energy calculations for these sub-volumes would require running GCMC calculations where the grand canonical waters are only allowed to be inserted/deleted within the volume of the four spheres. Nonetheless, it represents an approximation of the binding free energy to specific sites in the presence of more stable grand canonical waters (e.g. the fifth highly structural water molecule in bromodomain pockets), and in the absence of less stable ones (e.g water molecules that are only present at higher Adams values). Strictly speaking, the quantity returned by this analysis should thus be considered as a semi-rigorous binding free energy score, rather than a rigorous binding free energy.
For each of the four water sites, in each bromodomain, the error of the water placement was measured as the distance between the X-ray crystallographic coordinates and the clustered GCMC positions (Supplementary Figure 1). For the whole network, the root mean square deviation (RMSD) based on these distances was calculated. The binding free energies shown in the Results are the weighted mean and standard deviation from the results obtained with the TIP3P, TIP4P, and SPC water models, where the distances and RMSDs were used for weighting. For each water site, the free energy values obtained with the different water models were averaged using weights equal to the inverse of the respective distance errors (i.e. higher weights for lower errors):
| (1) |
| (2) |
| (3) |
where is the weight for water site x ∈ {W1, W2, W3, W4} and water model i ∈ M, with M = {TIP3P, TIP4P, SPC}; is the distance from the GCMC prediction using model i for site x; ΔGx is the average binding free energy of a water molecule for site x, and σx its standard deviation. Effectively, this procedure considered as more reliable the free energies that were obtained with water model(s) for which the predicted water positions were in better agreement with the X-ray structures. Similarly, for the four-water network, the results were weighted based on the root-mean-squared distance (RMSD) of the predicted water locations:
| (4) |
| (5) |
| (6) |
For simplicity, in the text we refer to these average binding free energies (ΔG) simply as binding free energies (ΔG). The analysis was performed via scripts written in Python 2.7 using the matplotlib and seaborn libraries for plotting, and pandas and numpy for data handling and statistics.
Supplementary Material
Acknowledgements
M.A. is supported by the EPSRC and Evotec via the Systems Approaches to Biomedical Sciences Doctoral Training Centre (EP/G037280/1). The authors acknowledge the use of the University of Oxford Advanced Research Computing (ARC) facility (http://dx.doi.org/10.5281/zenodo.22558), the EPSRC UK National Service for Computational Chemistry Software (NSCCS) at Imperial College London (grant no. EP/J003921/1) and the ARCHER UK National Supercomputing Services for computer time granted via the UK High-End Computing Consortium for Biomolecular Simulation, HECBioSim (http://www.hecbiosim.ac.uk), supported by EPSRC (grant no. EP/L000253/1). S.K. is supported by the SGC, a registered charity (number 1097737) that receives funds from AbbVie, Bayer, Boehringer Ingelheim, the Canada Foundation for Innovation, the Canadian Institutes for Health Research, Genome Canada, GlaxoSmithKline, Janssen, Lilly Canada, the Novartis Research Foundation, the Ontario Ministry of Economic Development and Innovation, Pfizer, Takeda, and the Wellcome Trust [092809/Z/10/Z].
Footnotes
Data availability
The PDB files of the input protein structures and the predicted and experimental water networks, as well as coordinates of the GC region used in the calculations, are provided in Supplementary Data 1. Other data that support the findings of this study are available from the corresponding author upon reasonable request.
Author contributions
M.A. performed the calculations. M.A. and G.A.R. analysed the data. M.A., G.A.R, S.K., and P.C.B. designed the study and interpreted the results. M.J.B., J.W.E., S.K., and P.C.B. supervised the project and provided scientific guidance. M.A., G.A.R., and P.C.B wrote the manuscript and all authors reviewed it.
Competing Interests
The authors declare no competing interests.
ORCID
Matteo Aldeghi: 0000-0003-0019-8806
Philip C. Biggin: 0000-0001-5100-8836
References
- 1.Filippakopoulos P, et al. Histone recognition and large-scale structural analysis of the human bromodomain family. Cell. 2012;149:214–231. doi: 10.1016/j.cell.2012.02.013. [DOI] [PMC free article] [PubMed] [Google Scholar]
- 2.Filippakopoulos P, Knapp S. The bromodomain interaction module. FEBS Letts. 2012;586:2692–2704. doi: 10.1016/j.febslet.2012.04.045. [DOI] [PubMed] [Google Scholar]
- 3.Picaud S, et al. Promiscuous targeting of bromodomains by bromosporine identifies BET proteins as master regulators of primary transcription response in leukemia. Sci Adv. 2016;2:e1600760. doi: 10.1126/sciadv.1600760. [DOI] [PMC free article] [PubMed] [Google Scholar]
- 4.Muller S, Filippakopoulos P, Knapp S. Bromodomains as therapeutic targets. Expert Rev Mol Med. 2011;13:e29. doi: 10.1017/S1462399411001992. [DOI] [PMC free article] [PubMed] [Google Scholar]
- 5.Filippakopoulos P, Knapp S. Targeting bromodomains: epigenetic readers of lysine acetylation. Nat Rev Drug Discov. 2014;13:337–356. doi: 10.1038/nrd4286. [DOI] [PubMed] [Google Scholar]
- 6.Muller S, Knapp S. Discovery of BET bromodomain inhibitors and their role in target validation. Med Chem Commun. 2014;5:288–296. [Google Scholar]
- 7.Brand M, et al. Small molecule inhibitors of bromodomain-acetyl-lysine interactions. ACS Chem Biol. 2015;10:22–39. doi: 10.1021/cb500996u. [DOI] [PubMed] [Google Scholar]
- 8.Vidler LR, Brown N, Knapp S, Hoelder S. Druggability analysis and structural classification of bromodomain acetyl-lysine binding sites. J Med Chem. 2012;55:7346–7359. doi: 10.1021/jm300346w. [DOI] [PMC free article] [PubMed] [Google Scholar]
- 9.Harner MJ, Chauder BA, Phan J, Fesik SW. Fragment-Based Screening of the Bromodomain of ATAD2. J Med Chem. 2014;57:9687–9692. doi: 10.1021/jm501035j. [DOI] [PMC free article] [PubMed] [Google Scholar]
- 10.Fedorov O, et al. Selective targeting of the BRG/PB1 bromodomains impairs embryonic and trophoblast stem cell maintenance. Science Advances. 2015;1:e1500723. doi: 10.1126/sciadv.1500723. [DOI] [PMC free article] [PubMed] [Google Scholar]
- 11.Gerstenberger BS, et al. Identification of a chemical probe for family VIII bromodomains through optimization of a fragment hit. J Med Chem. 2016;59:4800–4811. doi: 10.1021/acs.jmedchem.6b00012. [DOI] [PMC free article] [PubMed] [Google Scholar]
- 12.Sutherell CL, et al. Identification and development of 2,3-dihydropyrrolo[1,2-a]quinazolin-5(1H)-one inhibitors targeting bromodomains within the switch/sucrose nonfermenting complex. J Med Chem. 2016;59:5095–5101. doi: 10.1021/acs.jmedchem.5b01997. [DOI] [PMC free article] [PubMed] [Google Scholar]
- 13.Myrianthopoulos V, et al. Discovery and optimization of a selective ligand for the switch/sucrose nonfermenting-related bromodomains of polybromo protein-1 by the use of virtual screening and hydration analysis. J Med Chem. 2016;59:8787–8803. doi: 10.1021/acs.jmedchem.6b00355. [DOI] [PMC free article] [PubMed] [Google Scholar]
- 14.Cox OB, et al. A poised fragment library enables rapid synthetic expansion yielding the first reported inhibitors of PHIP(2), an atypical bromodomain. Chem Sci. 2016;7:2322–2330. doi: 10.1039/c5sc03115j. [DOI] [PMC free article] [PubMed] [Google Scholar]
- 15.Zhu J, Caflisch A. Twenty crystal structures of bromodomain and PHD finger containing protein 1 (BRPF1)/ligand complexes reveal conserved binding motifs and rare interactions. J Med Chem. 2016;59:5555–5561. doi: 10.1021/acs.jmedchem.6b00215. [DOI] [PubMed] [Google Scholar]
- 16.Crawford TD, et al. Diving into the water: Inducible binding conformations for BRD4, TAF1(2), BRD9, and CECR2 bromodomains. J Med Chem. 2016;59:5391–5402. doi: 10.1021/acs.jmedchem.6b00264. [DOI] [PubMed] [Google Scholar]
- 17.Flynn EM, et al. A subset of human bromodomains recognizes butyryllysine and crotonyllysine histone peptide modifications. Structure. 2015;23:1801–1814. doi: 10.1016/j.str.2015.08.004. [DOI] [PubMed] [Google Scholar]
- 18.Barillari C, Taylor J, Viner R, Essex JW. Classification of water molecules in protein binding sites. J Am Chem Soc. 2007;129:2577–2587. doi: 10.1021/ja066980q. [DOI] [PubMed] [Google Scholar]
- 19.Vukovic S, Brennan PE, Huggins DJ. Exploring the role of water in molecular recognition: predicting protein ligandability using a combinatorial search of surface hydration sites. J Phys Condens Matter. 2016;28:344007. doi: 10.1088/0953-8984/28/34/344007. [DOI] [PubMed] [Google Scholar]
- 20.Ross GA, Bodnarchuk MS, Essex JW. Water sites, networks, and free energies with grand canonical Monte Carlo. J Am Chem Soc. 2015;137:14930–14943. doi: 10.1021/jacs.5b07940. [DOI] [PubMed] [Google Scholar]
- 21.Ross GA, Bruce Macdonald HE, Cave-Ayland C, Cabedo Martinez AI, Essex JW. Replica exchange and standard state binding free energies with grand canonical Monte Carlo. J Chem Theor Comput. 2017;13:6373–6381. doi: 10.1021/acs.jctc.7b00738. [DOI] [PMC free article] [PubMed] [Google Scholar]
- 22.Bodnarchuk MS. Water, water, everywhere… It's time to stop and think. Drug Discovery Today. 2016;21:1139–1146. doi: 10.1016/j.drudis.2016.05.009. [DOI] [PubMed] [Google Scholar]
- 23.Bodnarchuk MS, Viner R, Michel J, Essex JW. Strategies to calculate water binding free energies in protein–ligand complexes. J Chem Inf Model. 2014;54:1623–1633. doi: 10.1021/ci400674k. [DOI] [PubMed] [Google Scholar]
- 24.Huang D, Rossini E, Steiner S, Caflisch A. Structured water molecules in the binding site of bromodomains can be displaced by cosolvent. Chem Med Chem. 2014;9:573–579. doi: 10.1002/cmdc.201300156. [DOI] [PubMed] [Google Scholar]
- 25.Geroult S, Virdee S, Waksman G. The role of water in computational and experimental derivation of binding thermodynamics in SH2 domains. Chem Biol Drug Desi. 2006;67:38–45. doi: 10.1111/j.1747-0285.2005.00315.x. [DOI] [PubMed] [Google Scholar]
- 26.Pearlman DA, Connelly PR. Determination of the differential effects of hydrogen bonding and water release on the binding of fk506 to native and Tyr82→Phe82 FKBP-12 proteins using free energy simulations. J Mol Biol. 1996;248:696–717. doi: 10.1006/jmbi.1995.0252. [DOI] [PubMed] [Google Scholar]
- 27.Tame JR, Sleigh SH, Wilkinson AJ, Ladbury JE. The role of water in sequence-independent ligand binding by an oligopeptide transporter protein. Nat Struct Biol. 1996;3:998–1001. doi: 10.1038/nsb1296-998. [DOI] [PubMed] [Google Scholar]
- 28.Robinson D, et al. Differential water thermodynamics determine PI3K-Beta/Delta selectivity for solvent-exposed ligand modifications. J Chem Inf Model. 2016;56:886–894. doi: 10.1021/acs.jcim.5b00641. [DOI] [PubMed] [Google Scholar]
- 29.Huggins DJ, Sherman W, Tidor B. Rational approaches to improving selectivity in drug design. J Med Chem. 2012;55:1424–1444. doi: 10.1021/jm2010332. [DOI] [PMC free article] [PubMed] [Google Scholar]
- 30.Ladbury JE. Just add water! The effect on the specificity of protein-ligand binding sites and its potential application to drug design. Chem Biol. 1996;3:973–980. doi: 10.1016/s1074-5521(96)90164-7. [DOI] [PubMed] [Google Scholar]
- 31.Filippakopoulos P, et al. Selective inhibition of BET bromodomains. Nature. 2010;468:1067–1073. doi: 10.1038/nature09504. [DOI] [PMC free article] [PubMed] [Google Scholar]
- 32.Crawford TD, et al. GNE-886: A potent and selective inhibitor of the cat eye syndrome chromosome region candidate 2 bromodomain (CECR2) ACS Med Chem Letts. 2017;8:737–741. doi: 10.1021/acsmedchemlett.7b00132. [DOI] [PMC free article] [PubMed] [Google Scholar]
- 33.Berman H, Henrick K, Nakamura H. Announcing the worldwide Protein Data Bank. Nat Struct Mol Biol. 2003;10:980. doi: 10.1038/nsb1203-980. [DOI] [PubMed] [Google Scholar]
- 34.Vriend G. A molecular modelling and drug design program. J Mol Graph. 1990;8:52–56. doi: 10.1016/0263-7855(90)80070-v. [DOI] [PubMed] [Google Scholar]
- 35.Word JM, Lovell SC, Richardson JS, Richardson DC. Asparagine and glutamine: Using hydrogen atom contacts in the choice of side-chain amide orientation. J MOl Biol. 1999;285:1735–1747. doi: 10.1006/jmbi.1998.2401. [DOI] [PubMed] [Google Scholar]
- 36.Olsson MHM, Søndergaard CR, Rostkowski M, Jensen JH. PROPKA3: Consistent treatment of internal and surface residues in empirical pKa predictions. J Chem Theory Comput. 2011;7:525–537. doi: 10.1021/ct100578z. [DOI] [PubMed] [Google Scholar]
- 37.Søndergaard CR, Olsson MHM, Rostkowski M, Jensen JH. Improved treatment of ligands and coupling effects in empirical calculation and rationalization of pKa values. J Chem Theory Comput. 2011;7:2284–2295. doi: 10.1021/ct200133y. [DOI] [PubMed] [Google Scholar]
- 38.AMBER 14. University of California; San Francisco: 2014. [Google Scholar]
- 39.Shirts MR, Chodera JD. Statistically optimal analysis of samples from multiple equilibrium states. J Chem Phys. 2008;129:124105. doi: 10.1063/1.2978177. [DOI] [PMC free article] [PubMed] [Google Scholar]
- 40.Ben-Naim A, Marcus Y. Solvation thermodynamics of nonionic solutes. J Chem Phys. 1984;81:2016–2027. [Google Scholar]
- 41.Maier JA, et al. ff14SB: Improving the accuracy of protein side chain and backbone parameters from ff99SB. J Chem Theor Comput. 2015;11:3696–3713. doi: 10.1021/acs.jctc.5b00255. [DOI] [PMC free article] [PubMed] [Google Scholar]
- 42.Jorgensen WL, Chandresekhar J, Madura JD, Impey RW, Klein ML. Comparison of simple potential functions for simulating liquid water. J Chem Phys. 1983;79:926–935. [Google Scholar]
- 43.Berendsen HJC, Postma JPM, van Gunsteren WF, Hermans J. Intermolecular Forces. Reidel; 1981. [Google Scholar]
Associated Data
This section collects any data citations, data availability statements, or supplementary materials included in this article.