

SUMMARY
The antidiabetic potential of glucagon receptor antagonism presents an opportunity for use in an insulin-centric clinical environment. To investigate the metabolic effects of glucagon receptor antagonism in type 2 diabetes, we treated Leprdb/db and Lepob/ob mice with REMD 2.59, a human monoclonal antibody and competitive antagonist of the glucagon receptor. As expected, REMD 2.59 suppresses hepatic glucose production and improves glycemia. Surprisingly, it also enhances insulin action in both liver and skeletal muscle, coinciding with an increase in AMP-activated protein kinase (AMPK)-mediated lipid oxidation. Furthermore, weekly REMD 2.59 treatment over a period of months protects against diabetic cardiomyopathy. These functional improvements are not derived simply from correcting the systemic milieu; nondiabetic mice with cardiac-specific overexpression of lipoprotein lipase also show improvements in contractile function after REMD 2.59 treatment. These observations suggest that hyperglucagonemia enables lipotoxic conditions, allowing the development of insulin resistance and cardiac dysfunction during disease progression.
In Brief
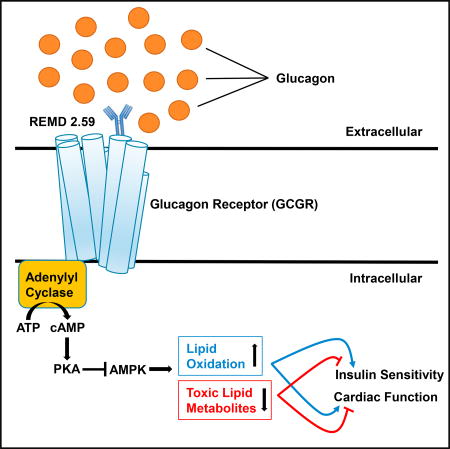
Sharma et al. highlight the regulatory roles for glucagon in managing type 2 diabetes and diabetic cardiomyopathy. REMD 2.59 is a fully humanized antibody that competitively inhibits glucagon receptor signaling, increasing lipid oxidation in liver, skeletal muscle, and heart and improving whole-body insulin sensitivity and cardiac function.
INTRODUCTION
Glycemic control is mediated by both insulin and glucagon, which function in a counter-regulatory manner. Both are vital in the maintenance of metabolic homeostasis. Since the discovery of insulin in 1922 by Banting, Best, and Collip, the clinical management of both type 1 and type 2 diabetes has largely focused on the role of insulin in disease pathology (Banting et al., 1922). Though the first radioimmunoassay for the detection of glucagon was developed in 1959 (Unger et al., 1959), the therapeutic potential of targeting glucagon action has been historically underappreciated; this is despite the established efficacy of glucagon receptor antagonism in restoring stable euglycemia in both type 1 and type 2 diabetes (Kazda et al., 2016; Pettus et al., 2017). Insulin-based therapies continue to be the standard of care for both type 1 and type 2 diabetes (Pearson et al., 2016), and targeting glucagon and glucagon signaling as effective antidiabetic therapies has only recently started gaining traction. First-generation glucagon receptor antagonists were able to successfully lower glycemia, but they had unacceptable side effects, such as hyperlipidemia, elevated liver transaminase, and hypertension (Gu et al., 2010; Guan et al., 2015; Sammons and Lee, 2015). Due to the nature of their allosteric binding, specificity issues have also been noted (Jazayeri et al., 2016; Koth et al., 2012). Here we use a human monoclonal antibody that competitively inhibits glucagon binding to the glucagon receptor (GcgR) and exhibits high specificity at very low concentrations (Gu et al., 2009). Previous studies with such antibody antagonists support strong glycemic improvements in type 1 diabetic rodents (Wang et al., 2015), type 2 diabetic rodents, non-human primates (Okamoto et al., 2015; Yan et al., 2009), and recently, in type 1 diabetic subjects (Pettus et al., 2017). However, the effects on lipid metabolism and insulin action have not been addressed by previous work.
Glucagon acts through cAMP-PKA (cyclic AMP protein kinase A) signaling to promote hepatic glucose production. Recent work demonstrated that metformin, a known activator of AMP-activated protein kinase (AMPK), blunts glucagon action by preventing cAMP accumulation (Cao et al., 2014; He et al., 2016; Miller et al., 2013). As such, we hypothesized that glucagons antagonism may have similar influence on AMPK activation. AMPK is known to promote mitochondrial lipid oxidation via the phosphorylation and inhibition of acetyl-CoA carboxylase (ACC), which in turn minimizes malonyl-CoA formation and subsequent carnitine palmitoyltransferase I (CPT1) inhibition (McGarry et al., 1991). This leads us to believe that excessive glucagon signaling during diabetes in target tissues, such as liver, blunts lipid oxidation and promotes the formation of insulin-desensitizing lipid intermediates, such as ceramide and diacylglycerol (Holland and Summers, 2008).
Both type 1 and 2 diabetes enhance the risk for congestive heart failure (Radovits et al., 2009; Wang et al., 2014a), and the elevated glucagon levels characteristic of diabetes might be crucially involved in the development of diabetes-induced heart dysfunction. Notably, cardiac-specific ablation of glucagon receptors in rodents protects against cardiac damage in coronary ligation models (Ali et al., 2014). Leprdb/db mice (db/db), which lack leptin receptor function due to a point mutation, display diabetic hyperglucagonemia (Gu et al., 2010). This strain is also reported to have impaired left ventricular function and remodeling (Aasum et al., 2002; Barouch et al., 2003). However, the role of lipid metabolism in glucagon-mediated cardiac alterations has not been evaluated. As AMPK has an established role in maintaining cardiac function and energetics (Kim and Dyck, 2015; Liao et al., 2005), we believe that the loss in AMPK activation during diabetes may be linked to the accumulation of ectopic lipids that is characteristic of various models of diabetic cardiomyopathy, including leptin-defective models of diabetes (Demarco et al., 2013; Mori et al., 2014; Unger, 2003; Wang and Unger, 2005). These lipid intermediates may be more than markers of cardiac dysfunction; reducing sphingolipid overaccumulation improves cardiac outcomes in a variety of mouse models that mimic diabetic cardiomyopathy (Holland et al., 2011; Mori et al., 2014; Park et al., 2008a; Russo et al., 2012). This potentially suggests a causal role for sphingolipid overaccumulation in the progression of cardiac dysfunction during diabetes.
Here we assess the mechanisms by which REMD 2.59 rescues hyperglycemia in Lepob/ob (which lack functional expression of leptin) and Leprdb/db mice, two effectively equivalent mouse models of type 2 diabetes. In these models, defects in leptin action blunt satiety signaling, which causes hyperphagia and diet-induced obesity, leading to type 2 diabetes and diabetic cardiomyopathy. Collectively, these data reveal that glucagon receptor antagonism does more than just prevent the inadequate suppression of hepatic glucose production during type 2 diabetes. Glucagon receptor antagonism confers improvements in overall glycemic control and heart function through increased AMPK activation, which promotes normalized lipid metabolism and helps counter the lipotoxic conditions that blunt insulin signaling and diminish cardiac function.
RESULTS AND DISCUSSION
REMD 2.59 Rescues Hyperglycemia and Improves Glucose Tolerance in Type 2 Diabetes Models
Glucagon has notable effects on energy homeostasis (Campbell and Drucker, 2015). We and others have previously reported that GcgR−/− mice display reductions in food intake and are resistant to diet-induced obesity (Conarello et al., 2007; Lee et al., 2014). In light of these apparent effects, we first looked to confirm that acute glucagon receptor antagonism leads to metabolic improvements in type 2 diabetic mouse models independent of changes in body weight. When placed in metabolic cages, it was evident that REMD 2.59 reduced food intake in Leprdb/db mice (Figure 1A). Therefore, we also established a pair-fed Leprdb/db cohort to control for any confounds from body mass. Concomitant with the reduction in food intake, REMD 2.59 blunted weight gain by diminishing adiposity (Figure 1B). Pair-feeding of Leprdb/db mice resulted in equivalent degrees of adiposity relative to the REMD 2.59-treated Leprdb/db mice (Figure 1B). At the end of the 10-day period, pair-fed mice gained slightly less weight than REMD 2.59-treated mice without changes in lean mass (Figure 1C).
Figure 1. REMD 2.59 Rescues Hyperglycemia and Improves Glucose Tolerance in a Type 2 Diabetes Model.

(A) 10-week-old Leprdb/db mice were treated with REMD 2.59 (5 mg/kg). 5days after treatment they were placed in metabolic cages and food intake was assessed over 4 days.
(B–D) Weight gain (B) and blood glucose (D) were measured over a 10-day period before and after treatment of 10-week-old Leprdb/db mice with REMD 2.59 (5 mg/kg, days 0 and 5) or vehicle. Lean body mass (C) and overall change in body fat composition (B) were assessed via NMR.
(E) Oral glucose tolerance assessed 5 days after treatment of Lepob/ob mice.
(F) Immunoblot of pAMPK Thr172, total AMPK, pCREB Ser133, total CREB, total PEPCK, and γ-tubulin from the livers of wild-type, Leprdb/db, pair-fed Leprdb/db, and REMD-treated Leprdb/db mice (2 representative samples shown, representative of 5/group).
(G) Relative abundance of PEPCK mRNA was assessed by real-time qPCR from livers of Leprdb/db mice.
(H) Circulating glucagon levels were measured by ELISA in the serum and CSF of rats 5 days after treatment with REMD 2.59 (5 mg/kg) or vehicle.
(I) Representative immunoblot of human IgG or REMD 2.59 in the serum and CSF of rats 5 days after treatment with REMD 2.59 or IgG4 vehicle, as in (H). n = 5/ group; *p < 0.05, **p < 0.01, ***p < 0.001. See also Figure S1. Data are represented as mean ± SEM.
Fed blood glucose was assessed in Leprdb/db mice over a 10-day period. Prior to antibody injection, mice in all groups exhibited equivalent hyperglycemia (~400 mg/dL). Within 3 days of treatment with REMD 2.59, Leprdb/db mice became euglycemic and remained stable for the duration of the time course, while vehicle-treated Leprdb/db mice were hyperglycemic throughout the 10-day period (Figure 1D). This could not be explained by the reduction in food intake as there was no glycemic improvement over the 10-day period in the pair-fed Leprdb/db cohort, which remained as hyperglycemic as the vehicle-treated controls (Figure 1D). To further characterize these metabolic improvements, we performed an oral glucose tolerance test (OGTT), which was done 5 days after REMD 2.59 treatment. Compared to controls, REMD 2.59-treated Leprdb/db mice had significantly lower blood glucose at all time points, indicating improved glucose tolerance (Figure 1E). These findings suggest that acute REMD 2.59 treatment can protect against the metabolic disruptions induced by hyperglucagonemia during type 2 diabetes. Importantly, these effects occur prior to changes in body mass (Figure S2C).
As glucagon primarily acts through signaling at the liver, we evaluated the hepatic response to glucagon receptor antagonism (Figure 1F). REMD 2.59 blunted phosphorylation (Ser133) of cAMP response element protein (Creb), a key regulator of glucagon’s gluconeogenic effects. Moreover, glucagon receptor antagonism greatly diminished PEPCK expression, an important gluconeogenic enzyme (Figure 1F). Pair-feeding did not elicit comparable changes. AMPK phosphorylation was also increased by 2.1-fold (pAMPK/AMPK ratio, p < 0.05 as compared to vehicle-treated db/db) in the livers of REMD 2.59-treated Leprdb/db mice (Figure 1F), which coincided with diminished lipid accumulation in the livers (Figure S1A). Additionally, the transcriptional suppression of PEPCK was evident after REMD 2.59 treatment, while pair-feeding did not mimic these alterations (Figure 1G). To validate the effectiveness of REMD 2.59 treatment, we measured plasma glucagon levels 7 days after injecting Leprdb/db mice. Plasma glucagon levels were elevated (~35-fold) in the REMD 2.59-treated Leprdb/db mice, which is consistent with previous observations (Dean et al., 2017; Gu et al., 2009) (Figure S1B). Given the possibility that elevated serum glucagon levels would be reflected in the cerebrospinal fluid (CSF) of REMD 2.59-treated animals, we assayed glucagon levels in the CSF and serum of lean Sprague-Dawley rats 5 days after the administration of REMD 2.59. There was no detectable glucagon in the CSF of vehicle-treated rats. However, glucagon was shown to be elevated in both the serum and CSF of REMD 2.59-treated rats, while these antibodies remain devoid in CSF (Figures 1H and 1I). As has been previously observed (Langhans et al., 1987; Quiñones et al., 2015), the central effects of increased glucagon could explain the decrease in food intake seen in REMD 2.59-treated Leprdb/db mice. However, it remains unclear if glucagon actions on appetite regulation in the brain occur via cognate glucagon receptors (Abraham et al., 2013; Prigeon et al., 2003) or the activation of GLP-1 receptors, which can occur at the pharmacologic levels reached during glucagon receptor antagonism (Ayala et al., 2009; Barrera et al., 2011).
REMD 2.59 Suppresses Hepatic Glucose Production
We further evaluated the effects of glucagon receptor antagonism on hepatic insulin signaling in Leprdb/db mice. These evaluations were made 5 days after REMD 2.59 or vehicle treatment, at which point the mice were stimulated with insulin and tissues were collected. Glucagon receptor antagonism markedly increased the insulin-stimulated phosphorylation of Akt (Ser473, 3.4-fold, p < 0.05) and Erk (Thr202/Tyr204) in comparison to stand-alone insulin stimulation (Figure 2A). Strikingly, though insulin by itself did not decrease PEPCK expression in Leprdb/db mice, REMD 2.59 treatment strongly blunted PEPCK expression in either the presence or absence of insulin (Figure 2A). To further assess the effects of REMD 2.59 on hepatic gluconeogenesis, we performed a pyruvate tolerance test (PTT) on Lepob/ob mice 5 days after REMD 2.59 or vehicle treatment. REMD 2.59-treated Lepob/ob mice displayed a significantly lower blood glucose over a 2-hr period following pyruvate injection, indicative of decreased hepatic gluconeogenesis (Figure 2B).
Figure 2. REMD 2.59 Suppresses Hepatic Gluconeogenesis.

(A) Leprdb/db mice were treated with REMD 2.59 or vehicle 5 days prior to acute administration of insulin. Downstream insulin signaling targets were measured via immunoblot. Results are shown in triplicate, representative of 6/group.
(B) Pyruvate tolerance tests were performed 5 days after treatment with REMD 2.59 or vehicle.
(C) Insulin tolerance tests were performed in 10-week-old wild-type, Leprdb/db, REMD-treated Leprdb/db, and glucagon-receptor knockout Lepob/ob mice.
(D) Immunoblots of total and phosphorylated Thr172 AMPK from soleus muscle of 6 mice per treatment group (11.5-fold increase in pAMPK/AMPK ratio in REMD 2.59 versus vehicle, p < 0.05).
(E) Circulating adiponectin was quantified by immunoblot 5 days after treatment of Lepob/ob mice with REMD 2.59.
(F) Levels of sphingoid bases in the liver (left), soleus (center), and serum (right) were assessed by mass spectrometry. n = 6/group; *p < 0.05, **p < 0.01, ***p < 0.001. Data are represented as mean ± SEM.
Given that glucagon receptor antagonism enhances insulin signaling in the liver of Leprdb/db mice, we also looked at the potential effects of REMD 2.59 treatment on whole-body insulin sensitivity. First, we conducted insulin tolerance tests (ITTs) on wild-type, glucagon receptor knockout Lepob/ob (GcgRKO Lepob/ob), 5-week-old Leprdb/db, and 10-week-old REMD 2.59-treated Leprdb/db mice. REMD 2.59-treated Leprdb/db and GcgRKO Lepob/ob mice did not display any lowering of their already normal blood glucose following insulin stimulation (Figure 2C). We attribute this to the disparate starting blood glucose levels between the cohorts, which complicated measurements of insulin sensitivity as a decline in blood glucose following insulin challenge.
We also analyzed signaling intermediates in skeletal muscle, namely the soleus. Like liver, the soleus muscle of REMD 2.59-treated Lepob/ob mice shows an increase in the activating (Thr172) phosphorylation of AMPK (11.5-fold increase in pAMPK/AMPK ratio, p < 0.05) (Figure 2D). This is surprising, as muscle is not a canonical target of glucagon action. However, previous work using in vitro hepatocyte models has not resolved a clear relationship between glucagon signaling and AMPK activation. Aw and colleagues reported that glucagon blunted AMPK Thr172 phosphorylation in human Huh7 cells (Aw et al., 2014). On the other hand, Longuet and colleagues demonstrated that glucagon activates AMPK in isolated hepatocytes (Longuet et al., 2008). Others have seen no explicit link (Miller et al., 2013). This variability suggests that the effects on AMPK activation in skeletal muscle may be indirect. This led us to measure adiponectin, which is an AMPK-activating adipokine. Circulating levels of adiponectin were increased by 75% only 5 days after treating Lepob/ob mice with REMD 2.59 (Figure 2E); however, these were unchanged in pair-fed mice (Figure S1C). Consistent with enhanced adiponectin signaling, there was a trend toward increased sphingosine and sphinganine in the liver after REMD 2.59 treatment (Figure 2F, left). Sphingosine-1-phosphate (S1P) and sphinganine-1-phosophate (Spa-1-P) were significantly increased in soleus muscle (Figure 2F, middle) and serum (Figure 2F, right). The formation of these sphingoid bases, which are by-products of adiponectin receptor ceramidase activity, suggests a functional activation of these receptors (AdipoR1 and AdipoR2) in muscle and liver in response to increased circulating adiponectin levels.
REMD 2.59 Improves Whole-Body Insulin Sensitivity in a Type 2 Diabetes Model
To conclusively evaluate changes in insulin sensitivity during type 2 diabetes due to glucagon receptor antagonism, we conducted hyperinsulinemic-euglycemic clamps 5 days after REMD 2.59 treatment. The average fasted blood glucose of REMD 2.59-treated Lepob/ob mice (~108.7 ± 13.3 mg/dL) was substantially lower than the vehicle-treated Lepob/ob mice (~322.8 ± 39.7 mg/dL) (Figure S2A). Interestingly, this difference in basal fasted blood glucose was present despite equivalent insulin levels, indicating a difference in insulin sensitivity between the two groups, which was borne out during the clamp. The glucose infusion rate (GIR) required to maintain blood glucose near 200 mg/dL was approximately 8-fold higher in the REMD 2.59-treated Lepob/ob mice (Figure 3A). This suggests a substantial improvement in whole-body insulin sensitivity, which was not seen in the previous ITT. Basal hepatic glucose production trended lower in the REMD 2.59-treated Lepob/ob mice (Figure 3B), and it was completely suppressed in the REMD 2.59-treated Lepob/ob mice during the clamped state (Figure 3C). These data imply that an improvement in hepatic insulin sensitivity in the REMD 2.59-treated Lepob/ob mice was partly responsible for the differences in GIR and endogenous glucose production.
Figure 3. REMD 2.59 Improves Whole-Body Insulin Sensitivity in a Type 2 Diabetes Model.

(A–F) Hyperinsulinemic-euglycemic clamps were performed on conscious unrestrained 10-week-old Lepob/ob mice 5 days after treatment with REMD 2.59 or vehicle (n = 11 for both groups).
(A) Glucose infusion rate required to maintain constant blood glucose (200 mg/dL) during clamp.
(B) Hepatic glucose output prior to the clamp.
(C) Hepatic glucose output during the clamped state.
(D) Rate of whole-body glucose disposal, Rd.
(E) Radioactive 2-deoxyglucose uptake (Rd’) quantification in skeletal muscle and heart during the clamped state.
(F) Serum non-esterified fatty acids (NEFAs) were quantified by colorimetric assay in both the pre-clamped and clamped states. See also Figure S2. *p < 0.05, **p < 0.01, ***p < 0.001. Data are represented as mean ± SEM.
Surprisingly, in the clamped state, the rate of glucose disposal was significantly increased in the REMD 2.59-treated mice (Figure 3D), which was a completely unanticipated finding; the magnitude of the change suggested an improvement in glucose clearance by skeletal muscle. To directly determine if this was due to an improvement in skeletal muscle insulin sensitivity, we assessed 2-deoxyglucose uptake in the clamped state. Specifically, we assayed soleus, a highly oxidative skeletal muscle, diaphragm, a largely glycolytic skeletal muscle, and heart. We found that REMD 2.59-treated Lepob/ob mice had significantly increased 2-deoxyglucose uptake in soleus and heart and strong trends toward increased uptake in diaphragm (p = 0.13) (Figure 3E). REMD 2.59-treated Lepob/ob mice showed a significant decrease in serum non-esterified fatty acids (NEFAs) compared to vehicle-treated Lepob/ob mice (Figure 3F). While there was no change in circulating NEFAs between the basal and clamped states of the control mice, NEFAs in the REMD 2.59-treated Lepob/ob mice did decrease in the clamped state (Figure 3F). This suggests that REMD 2.59 enhances the insulin-induced suppression of lipolysis in Lepob/ob mice. These data are consistent with previous work that implicates glucagon-induced cAMP in regulating white adipose tissue lipolysis (Kuroda et al., 1987; Perea et al., 1995), and they further solidify the idea that glucagon receptor antagonism enhances insulin sensitivity during type 2 diabetes, given the well-known effects of insulin on lipolysis.
REMD 2.59 Improves Lipid Metabolism via the Activation of AMPK
During the course of our metabolic characterization, we noted that glucagon receptor antagonism prompted a rapid decrease in hepatic steatosis, as determined by a biochemical quantification of triglycerides (Figure 4A). This decrease in hepatic lipid content is consistent with liver histology from prior experiments, which showed an improvement in hepatic steatosis in GcgR−/−Leprdb/db mice compared to GcgR+/+ Leprdb/db mice (Figure 4D). These histological findings were confirmed by quantification of hepatic triglycerides, which were significantly decreased by approximately 4-fold in GcgR−/− Leprdb/db mice. To further evaluate lipid metabolism following acute REMD 2.59 treatment, we carried out an in vivo assessment of lipid uptake and oxidation in Lepob/ob mice. Although lipid uptake was unchanged in most tissues (Figure 4B, left), we found that oxidation in the livers of REMD 2.59-treated Lepob/ob mice was significantly increased, though oxidation in skeletal muscle was not improved (Figure 4B, right). This is consistent with the enhanced hepatic phosphorylation of AMPK seen in our experiments (Figure 1F).
Figure 4. REMD 2.59 Improves Lipid Metabolism and Activates AMPK.

(A and B) 10-week-old Lepob/ob mice were treated with REMD 2.59 (5 mg/kg) or vehicle 5 days prior to all assessments. Liver triglycerides were quantified and normalized by weight (A). Total 3H-triolein lipid uptake and oxidation in tissues of REMD 2.59- and vehicle-treated Lepob/ob mice (B) (n = 8 and 10 for vehicle and REMD groups, respectively).
(C) Total 3H-triolein lipid uptake and oxidation in tissues following 2 days of acyl-glucagon (5 nmol/kg) or vehicle treatment of wild-type mice (n = 5 for both groups).
(D) In control and whole-body glucagon-receptor knockout db/db mice, lipid accumulation in the liver was assessed histologically with oil red O staining.
(E) Ceramide content from soleus muscle or liver was quantified from Lepob/ob mice treated with REMD 2.59 or vehicle.
(F) Total O-acyl ceramides were assessed and expressed as a percentage relative to vehicle-treated control. n = 6 unless indicated; *p < 0.05, **p < 0.01, ***p < 0.001. See also Figure S3. Data are represented as mean ± SEM.
The unchanged skeletal muscle lipid oxidation was unexpected given that we observed an increase in activated AMPK within the soleus (Figure 2D). In muscle, AMPK activation is known to play a critical role as a mediator of contraction-stimulated glucose uptake (Cokorinos et al., 2017; Kjøbsted et al., 2017). As an alternative means to establish the connection between glucagon signaling and decreased lipid oxidation in skeletal muscle, wild-type mice were treated subcutaneously with acyl-glucagon for 2 days prior to an in vivo radioactive 3H-triolein assay. Acyl-glucagon was used to provide sustained glucagon receptor agonism. Lipid oxidation was significantly decreased in soleus and brown adipose tissue (Figure 4C, right), and it trended toward being reduced in heart (p = 0.07), liver (p = 0.13), and white adipose tissue. In contrast, lipid uptake was unchanged in all of the assessed tissues (Figure 4C, left).
Blunting lipid oxidation can enhance acyl-CoA bioavailability for competing pathways, including the Kennedy pathway for phospholipid production and the de novo synthesis pathway for ceramide production. We hypothesized that glucagon receptor antagonism, by preventing a glucagon-mediated decline in AMPK-induced lipid oxidation, would reduce levels of various toxic lipid species, specifically sphingolipids like ceramide. Glucagon receptor antagonism decreased total ceramides in the soleus (Figure 4E, left), however, total ceramides were unchanged in the liver (Figure 4E, right). Individual ceramide species (such as C14, C16, and C18 ceramides), which are thought to be particularly strong insulin desensitizers (Raichur et al., 2014; Turpin et al., 2014; Xia et al., 2015), were decreased in both liver and soleus (Figure 4E). Concomitant with these decreases was an observed decrease in circulating serum ceramides and liver glucosylceramides (Figures S3A and S3B). These data suggest that glucagon receptor antagonism partially improves insulin sensitivity through the degradation of the ceramide precursor pool, made up of free fatty acids (FFAs). We also saw changes in 1-O-acyl-ceramide levels in liver and soleus between REMD 2.59- and vehicle-treated Lepob/ob mice. Specifically, REMD 2.59 treatment resulted in decreased 1-O-acyl-ceramides in the liver and increased 1-O-acyl-ceramides in the soleus (Figure 4F). These differences were universally reflected across individual 1-O-acylceramide species (Figure S3C). Recent work has suggested that these minimally studied sphingolipid metabolites partition with triglycerides and may be protective against ceramide-mediated cellular distress (Senkal et al., 2017).
Collectively, these studies suggest some highly beneficial glucose-lowering mechanisms, which have been previously overlooked during the treatment of type 2 diabetes by glucagon receptor antagonism. Most notably, consistent AMPK activation in the liver may drive an increase in lipid oxidation, which coincides with rapid improvement of hepatic steatosis. Moreover, AMPK activation in skeletal muscle may be responsible for the unexpected improvements in muscle glucose uptake, perhaps functioning through similar signaling pathways as exercise-induced glucose transport. Such AMPK activation may be indirectly caused by adiponectin, which is increased in the serum following just 3 days of REMD 2.59 treatment (Figure 2E). Consistent with adiponectin signaling, S1P and sphingosine bases were elevated in muscle and liver, respectively (Figure 2F). Our previous work suggests that the formation of these sphingoid bases is necessary and sufficient for adiponectin to induce AMPK activation in cultured myotubes (Holland et al., 2011). Overall, glucagon receptor antagonism promotes profound and varied metabolic improvements during type 2 diabetes.
REMD 2.59 Prevents Cardiomyopathy in a Type 2 Diabetes Model
In the heart, AMPK activation is thought to be cardioprotective (Kim and Dyck, 2015). Given the enhancement of AMPK activation in skeletal muscle caused by REMD 2.59 and changes in insulin-stimulated glucose uptake into the heart, we also evaluated cardiac health. Like the soleus muscle, we noted impaired lipid metabolism in the heart when exogenous glucagon was administered (Figure 4C). To determine if glucagon receptor antagonism could benefit cardiac health, we assessed the effect of extended REMD 2.59 treatment on cardiac hypertrophy and ventricular function, which is normally impaired in diabetic mice. 8-week-old Leprdb/db mice were treated weekly with either PBS or REMD 2.59. Ventricular contractility and ventricular diameters were measured by echocardiography prior to the experiment and at 6, 12, and 18 weeks after the first dose of REMD 2.59. Leprdb/+ littermates were used as lean controls.
REMD 2.59 treatment reduced weight gain over the 18-week time course (Figure 5A), consistent with our earlier observations (Figure 1B). The reduction in cardiac function that is normally seen in Leprdb/db mice was prevented in the REMD 2.59-treated Leprdb/db cohort. Fractional shortening and ejection fraction are positively correlated with heart function and are reliable parameters by which cardiac health can be assessed. While the Leprdb/db control cohort showed decreased fractional shortening and ejection fraction, which worsened for the duration of the experiment, the cardiac function of REMD 2.59-treated mice was preserved (Figures 5B and 5C). Furthermore, the REMD 2.59-treated Leprdb/db mice were protected from declines in early diastolic filling peak velocity/late filling peak velocity (E/A) ratio (Figure 5D), which specifically reflects left ventricular function during diastole. Cardiac output, which measures the volume of blood pumped per minute, was also preserved by the antibody treatment (Figure 5E). REMD 2.59 treatment also prevented an increase in isovolumic relaxation time (IVRT) (Figure 5F), indicative of a slowing heart rate, which may contribute to the declining cardiac output seen in the control Leprdb/db mice. Using Micro-Cardiac catheters, pressure transducers that were inserted into the left ventricles of mice at the end of the 18-week time course, we also looked at left ventricular developed pressure (LVDP). REMD 2.59-treated Leprdb/db mice showed significantly higher left ventricular pressure, further indicating preserved contractility due to glucagon receptor antagonism (Figure 5G).
Figure 5. REMD 2.59 Prevents Cardiomyopathy in Leprdb/db Mice.

(A–K) 8-week-old Leprdb/db and Leprdb/+ mice were treated with REMD 2.59 (3 mg/kg, weekly) or vehicle for 18 weeks.
(A) Body weight was measured weekly.
(B–F) Via echocardiography, various parameters of ventricular contractility were measured, including fractional shortening (B), ejection fraction (C), E/A ratio (D), cardiac output (E), and IVRT time (F).
(G) LVDP was measured using Mikro-cardiac catheters at the end of the 18-week time course.
(H and I) Echocardiography was used to assess ventricular diameter during diastole (H) and systole (I).
(J) At 18 weeks, mice were sacrificed and heart weights were obtained.
(K and L) Heart tissue was assayed for sphingolipid content (K) and ceramides (L) via mass spectrometry.
(M) Immunoblots of total and phosphorylated (Thr172) AMPK in 4 hearts/group. n = 9 Leprdb/+/group, n = 15 Leprdb/db/group. *Comparisons between Leprdb/db, *p < 0.05, **p < 0.01, ***p < 0.001. #Comparisons between PBS-treated Leprdb/db and Leprdb/+, #p < 0.05, ##p < 0.01, ###p < 0.001. &Drug effects in Leprdb/+, &p < 0.05. Data are represented as mean ± SEM.
Glucagon receptor antagonism also prevented cardiac hypertrophy. Though PBS-treated Leprdb/db mice experienced a significant increase in left ventricular end systolic dimension (LVESD) and interventricular septal end diastolic dimension (IVSD), REMD 2.59-treated Leprdb/db mice displayed no such changes over the course of the experiment (Figures 5H and 5I). Overall, REMD 2.59-treated Leprdb/db mice displayed decreased heart weights (Figure 5J) and decreases in a variety of sphingolipid species (Figure 5K). Although total ceramide levels were unchanged following acute REMD 2.59 treatment, there was a significant decline in many toxic ceramide species, such as C16:0 and C18:0 ceramides (Figure 5L). This is consistent with previous reports that implicate ceramide synthase 5 in the generation of the most deleterious ceramides for the heart (Russo et al., 2012). For almost all measured parameters of cardiac function, except for left ventricle end diastolic diameter (LVEDD), PBS-treated Leprdb/db mice were markedly worse when compared to both PBS and REMD 2.59-treated lean controls. As seen in liver and soleus, the hearts of Leprdb/db mice acutely treated with REMD 2.59 displayed a trend toward improved AMPK activation (70% increase, p < 0.10) (Figure 5M), which plays an important role in promoting cardiac lipid metabolism. Additionally, as previously noted, the hearts of Lepob/ob mice showed increased insulin-stimulated glucose uptake during hyperinsulinemic-euglycemic clamps, suggesting improved overall cardiac energetics (Figure 3E).
REMD 2.59-Mediated AMPK Activation and Protection against Diabetic Cardiomyopathy Is Independent of Changes in Glycemia
In the Leprdb/db and Lepob/ob mouse models, it is evident that treatment with REMD 2.59 improves multiple components of the systemic milieu that may affect cardiac health. Given that glucagon receptor antagonism corrects hyperglycemia in Lepob/ob mice, we wanted to evaluate the possibility that AMPK activation in liver, heart, and skeletal muscle is a result of the stark differences in blood glucose rather than REMD 2.59 treatment; typically, following REMD 2.59 administration, blood glucose of Leprdb/db mice decreases from ~400 mg/dL to approximately 85–100 mg/dL, which is slightly low compared to the normal fed blood glucose of a mouse.
To address this concern, we conducted hyperinsulinemic clamps on age-matched and glucose-matched wild-type mice, with somatostatin included to maintain equivalent glucagon levels between groups. One cohort was clamped at euglycemia (~130 mg/dL) and the other at hypoglycemia (~60 mg/dL) (Figure S4A). At the end of the clamp, the mice were sacrificed and AMPK activation was quantified in heart, liver, soleus muscle, and diaphragm by immunoblot. No increased AMPK activation was seen in heart, liver, or skeletal muscle of the mice clamped at a glucose of 60 mg/dL (Figure S4B). This suggests that the mild hypoglycemia observed with REMD 2.59 treatment of the wild-type mice would be insufficient to induce AMPK activation in these tissues. Furthermore, to determine whether protection against cardiomyopathy can occur independently of systemic metabolic improvements, we evaluated mice with a cardiac-specific overexpression of lipoprotein lipase (LPLGPI). LPLGPI mice overexpress glycosylphosphatidylinositol (GPI) membrane-anchored LPL specifically in cardiomyocytes (Yagyu et al., 2003), resulting in local absorption of FFAs into the heart. These mice develop lipid-induced cardiac dysfunction in a similar manner to that seen in type 2 diabetes. However, these transgenic mice are lean and do not display overt changes in circulating glucose or lipid levels. The LPLGPI mice are used as a reliable model of lipotoxicity-induced cardiac injury, which may be partially driven by the accumulation of ceramides in the heart (Park et al., 2008a; Yagyu et al., 2003).
LPLGPI mice were treated weekly with either REMD 2.59 or vehicle from 10 to 15 weeks of age, at which time echocardiography was performed. Glycemia was not significantly different in these non-diabetic mice after treatment with REMD 2.59 (Figure S4C). The REMD 2.59-treated LPLGPI mice showed marked improvements in ventricular function, as both fractional shortening and ejection fraction were significantly increased (Figures 6A and 6B). REMD 2.59-treated LPLGPI mice also displayed reduced LVESD and heart weights, measured as a ratio of body weight (Figures 6C and 6D), indicating protection against cardiac hypertrophy. Consistent with our observations with Leprdb/db mice, AMPK activation was also increased (70% increase in pAMPK/AMPK ratio, p < 0.05), as compared to vehicle treatment in the hearts of REMD 2.59-treated LPLGPI mice (Figure 6E). Furthermore, REMD 2.59-treated LPLGPI mice also had lowered C20, C24, and C24:1 ceramide levels and a 12% reduction (p < 0.05) in total cardiac ceramides (Figure 6F). Interestingly, REMD 2.59 treatment also significantly reduced various species of lactosylceramides, sphingomyelins, and dihydroceramides in the hearts of LPLGPI mice (Figures S4D–S4H).
Figure 6. REMD 2.59 Protects against Lipotoxic Cardiomyopathy.

(A–F) Lean LPLGPI mice were treated weekly with REMD 2.59 (3 mg/kg) or vehicle from 10 to 15 weeks of age.
(A–C) At 15 weeks of age, echocardiography was conducted. Fractional shortening (A), ejection fraction (B), and left ventricular end systolic dimension (C) were assessed.
(D–F) At 15 weeks of age, LPLGPI mice were sacrificed and tissues were collected.
(D) Heart weights were calculated as a ratio of body weight.
(E) Immunoblot for activated Thr172 AMPK, total AMPK, and tubulin in hearts.
(F) Cardiac ceramides were assessed via mass spectrometry. n= 5/group; *p < 0.05, **p < 0.01, ***p < 0.001. See also Figure S4. Data are represented as mean ± SEM.
These results help identify glucagon as a potential contributing factor to the development of diabetic cardiomyopathy, and they indicate a manner in which such impairments can be prevented. Specifically, we implicate glucagon as a facilitator in the dysregulation of lipid metabolism, offering a mechanism by which glucagon promotes cardiac dysfunction. Impaired AMPK activation in the heart can broadly impact cardiac energetics and impair lipid oxidation. Our data suggest that impaired lipid utilization may lead to an accumulation of toxic lipid metabolites, promoting hypertrophy and negatively impacting ventricular function; cardiac lipotoxicity has previously been shown to play a causal role in cardiomyopathy (Lee et al., 2004; Park et al., 2008b; Russo et al., 2012). Our studies suggest that inhibiting glucagon action may prevent cardiac dysfunction in multiple models of lipotoxic cardiomyopathy.
Collectively, these studies suggest benefits for glucagon receptor antagonism in the treatment of diabetes and diabetic cardiomyopathy. Also, while glucagon receptor antagonists have been pursued for the treatment of type 2 diabetes (Pearson et al., 2016), they may also hold promise for type 1 diabetes (Pettus et al., 2017; Wang et al., 2015). However, two primary challenges continue to caution their development as a drug class. Pharmacological glucagon receptor antagonism has been shown to induce alpha cell hyperplasia in rodent and non-human primate models, and it can cause dose-dependent increases in aspartate and alanine aminotransferases enzymes (though without other signs of liver toxicity) (Pearson et al., 2016).
Paradoxically, glucagon agonism has also been pursued independently or as a coagonist with other peptide hormones, as glucagon agonism aids weight loss by promoting satiety and energy expenditure (Habegger et al., 2010). Here we suggest a potential explanation for this paradox, as peripheral glucagon receptor antagonism with REMD 2.59 enhances endogenous glucagon exposure to the CNS. This appears to occur as this monoclonal antibody fails to cross the blood-brain barrier while effectively prompting hyperglucagonemia via feedback regulation. The net increase in glucagon exposure to the CNS and simultaneous blockade of peripheral glucagon signaling may reconcile these seemingly incompatible results. Glucagon agonism has also been tested in cardiac patients, where it causes short-term improvements in cardiac output due to acute energy mobilization and cAMP-induced increases in heart rate (Ceriello et al., 2016). Additional studies using glucagon receptor agonism and tissue-specific glucagon receptor ablation models will be needed to help address the paradoxical effects of glucagon on glucose metabolism and cardiac health.
EXPERIMENTAL PROCEDURES
Animals
All animal experimental protocols were approved by the Institutional Animal Care and Use Committee of University of Texas Southwestern Medical Center at Dallas or the Dallas VA Medical Center. Lepob/ob mice were on an FVB genetic background to allow for consistent hyperglycemia (Haluzik et al., 2004). The dose of REMD 2.59 used for all glycemic experiments (Figures 1, 2, 3, and 4) was 5 mg/kg; prolonged treatment for cardiac experiments was performed with 3 mg/kg provided once weekly. Acyl glucagon was administered to wild-type mice (50 nmol/kg, intraperitoneally [i.p.]) for 2 consecutive days at 24-hr intervals prior to 3H-triolein assay. For pair-feeding studies, Leprdb/db mice were housed individually and fed 5.5 g chow daily (average for LepRdb/db mice receiving REMD 2.59).
Systemic Tests
For tolerance tests, mice were fasted for 3 hr prior to the administration of glucose (2.5 g/kg body weight by gastric gavage), pyruvate (2.5 g/kg, i.p.), or insulin (1.5 U/kg, i.p.). At the indicated time points, venous blood samples were collected in EDTA-coated capillary tubes from the tail vein. Glucose levels were measured using an oxidase-peroxidase assay (Sigma-Aldrich). Mice did not have access to food throughout the experiment. Glucose levels were determined using an oxidase-peroxidase assay (Sigma-Aldrich). Insulin levels were measured using commercial ELISA kits (Crystal Chem).
Hyperinsulinenmic-Euglycemic Clamps
Hyperinsulinemic-euglycemic clamps were performed on conscious unrestrained mice, as previously described (Holland et al., 2011; Kusminski et al., 2012). In brief, hyperinsulinemia was intitiated with a primed-continuous infusion of insulin (10 mU/kg/min), while variable infusion of 50% dextrose allowed for the achievement of a targeted blood glucose near 200 mg/dL. Constant infusion of 3H-Glucose for 90 min prior to the clamp and throughout the duration of the experiment allowed for calculations of glucose kinetics. 2-deoxyglucose (13 (µCi/mouse) was administered at the end of a 2-hr clamp, during steady-state conditions.
3H-triolein Uptake and β-Oxidation
For measurements of lipid clearance rates, tissue-specific lipid uptake, and b-oxidation rates in transgenic tissues, methodologies were adapted from previously detailed studies (Kusminski et al., 2012). Briefly, 3H-triolein was tail vein-injected (2 µCi per mouse in 100 µL 5% intralipid) into mice after a 5-hr fast. Blood samples (10 µL) were then collected at 1, 2, 5,10, and 15 min after injection. At 20 min post-injection, mice were euthanized; blood samples were taken; and tissues were quickly excised, weighed, and frozen at −80°C until processing. Lipids were then extracted using a chloroform-to-methanol-based extraction method (Bligh and Dyer, 1959). The radioactivity content of tissues, including blood samples, was quantified as described previously.
Real-Time qPCR
Tissues were excised from mice and snap-frozen in liquid nitrogen. Total RNA was isolated following tissue homogenization in Trizol (Invitrogen, Carlsbad, CA) using a Tissue Lyser (MagNA Lyser, Roche), then isolated using an RNeasy RNA extraction kit (QIAGEN). The quality and quantity of the RNA was determined by absorbance at 260/280 nm. cDNA was prepared by reverse-transcribing 1 µg RNA with an iScript cDNA Synthesis Kit (Bio-Rad). Results were calculated using the threshold cycle method (Livak and Schmittgen, 2001), with β-actin used for normalization.
Lipid Quantifications
Sphingolipid was quantified as described previously by liquid Chromatography, electrospray ionization, tandem mass spectrometry (LC/ESI/MS/MS) using a TSQ Quantum Ultra-triple quadrupole mass spectrometer (Thermo Fisher Scientific) equipped with an electrospray ionization (ESI) probe and interfaced with an Agilent 1100 HPLC (Agilent Technologies) (Holland et al., 2011). Diacylglycerol was quantified as previously described (Barnes et al., 1977).
Immunoblotting Analysis
Insulin stimulation was achieved by the injection of insulin (1.5 U/kg, i.p.) 30 min before sacrifice. Total protein extracts were prepared from tissues of mice using a preparation of tissue lysis buffer (Cell Signaling Technology) with protease inhibitor cocktail and phosphatase inhibitor cocktail (both Sigma-Aldrich). Total protein content was quantified using Bio-Rad Protein Assay, and final mass of protein assayed was standardized to a multiple of the lowest yield. Protein was resolved by SDS-PAGE and transferred to a nitrocellulose membrane (Bio-Rad, Hercules, CA). The blotted membrane was blocked in 1× Tris-buffered saline (TBS) containing 0.1% Tween and 5% nonfat dry milk (TBST-MLK) for 1 hr at room temperature with gentle, constant agitation. After incubation with primary antibodies (pAMPKa Thr172 [8340], AMPK [2535], Akt [9272], pAkt Ser473 [9271], Erk [9102], pErk Thr202/Tyr204 [9101], CREB [9197], and pCREB S133 [9191] from Cell Signaling Technology; PEPCK, Abcam Ab70358; and Anti-g-tubulin T6557, Sigma) in freshly prepared TBST-MLK at 4°C overnight with agitation, the membrane was washed 3 times with 1 × TBST buffer. This was followed by incubation with secondary anti-rabbit horseradish peroxidase-conjugated Ig antibodies in TBST-MLK for 1 hr at room temperature with agitation. The membrane was then washed three times with TBST buffer, and the proteins of interest on immunoblots were detected by an ECL plus western blotting detection system (GE Healthcare, Pittsburgh, PA). The corresponding bands were quantified using NIH Image software (version 1.6; available at https://imagej.nih.gov/nih-image/).
Energy Expenditure
Metabolic measurements were obtained continuously using TSE metabolic chambers (TSE Labmaster System, Germany) in an open-circuit indirect calorimetry system. Studies were performed from days 4 to 6 after implanting osmotic pumps. Data were normalized to lean body mass as determined using a Bruker MQ10 NMR analyzer.
Liquid Chromatography-Tandem Mass Spectrometry of 1-O-Acyl Ceramides
Samples of liver and soleus were homogenized using the Omni Bead Ruptor 24 (Omni International, Kennesaw, GA). Preparations of soleus and liver (1 mg wet weight) were diluted with 50 mM PBS to a total volume of 200 µL. Then 750 µL methanol:chloroform (2:1; v/v) was added, products were extracted in the chloroform layer, dried under a stream of nitrogen, and they were then resuspended in 100 µL buffer A (100% Isooctane). For normal-phase separation, samples (extracted lipids from 32 µg tissue) were injected onto an Ascentis-Si HPLC column (150 × 2.1 mm, 5 µm; Supelco) at a flow rate of 0.3 mL/min at 5% solvent B (Methyl tert-butyl ether:isooctane, 1:1; v/v). Solvent B was maintained at 5% for 8 min, increased to 30% over 17 min, and then to 90% over 4 min. The system was held at 90% B for 10 min prior to reequilibration at 5% for 14 min. Buffer C (acetonitrile:water [95:5; v/v] with 10 mM ammonium acetate) was incorporated post-column at 0.03 mL/min. 1-o-acyl ceramides were measured using an API5000 triple quadrupole mass spectrometer (AB Sciex, Framingham, MA) in positiveion mode using multiple reaction monitoring (MRM) of the m/z transitions: 800.8 →264.4 (d16:1)-(34:2), 802.8 →264.4 (d16:1)-(34:1), 804.8 →264.4 (d16:1)-(34:0), 828.8 →264.4 (d16:1)-(36:2), 830.8 →264.4 (d16:1)-(36:1), 832.8 →264.4 (d16:1)-(36:0), 856.8 →264.4 (d16:1)-(38:2), 858.8 →264.4 (d16:1)-(38:1), 860.8 →264.4 (d16:1)-(38:0), 884.8 →264.4 (d16:1)-(40:2), 886.8 →264.4 (d16:1)-(40:1), 888.8 →264.4 (d16:1)-(40:0), 910.8 →264.4 (d16:1)-(42:3), 912.8 →264.4 (d16:1)-(42:2), and 914.8 →264.4 (d16:1)-(42:1). Chromatographic separation and retention time were confirmed using 1-oleoyl-N-heptadecanoyl-D-erythro-sphingosine (Avanti Polar Lipids, Alabaster, AL). Quantitation was performed using AB Sciex MultiQuant software.
Echocardiography
In vivo cardiac function was assessed by transthoracic echocardiography (Acuson P300,18-MHz transducer; Siemens) in conscious mice, as described previously (Wang et al., 2014b). From left ventricle short-axis view, M-mode echocardiogram was acquired to measure interventricular septal thickness at end diastole (IVSD), left ventricular posterior wall thickness at end diastole (LVPWd), LVEDD, LVESD. Fractional shortening (FS) was calculated from the end-diastolic diameter (EDD) and end-systolic diameter (ESD) using the following equation: FS = 100% × [(EDD – ESD)/EDD]. Early diastolic filling peak velocity (E), late filling peak velocity (A), and isovolumic relaxation time (IVRT) were measured from the medial or septal wall at the mitral valve level from tissue Doppler image. LV diastolic function was assessed by measuring the E/A ratio and IVRT. In addition, a pulsed Doppler of the LV outflow was performed to obtain velocity time integral (VTI). Dimensional mode image and cine loop were acquired in parasternal long-axis view to measure the aortic diameter (AOD). Cardiac output (CO) was calculated by stroke volume (SV = AOD2/4 × VTI) and heart rate (CO = SV × HR). Three to five beats were averaged for each mouse study. Studies and analysis were performed by investigators blinded to treatments.
Left Ventricular Pressure
After the heart was exposed in anesthetized mice, a Mikro-tip catheter (SPR1000, Millar Instruments, Houston, TX) was inserted into the left ventricle as described previously (Zu et al., 2010). Left ventricular pressure was directly measured with the Powerlab Data Acquisition System and displayed on a computer. LVDP was calculated as end systolic pressure minus end diastolic pressure. Positive maximal left ventricular pressure derivative (+dp/dtm) and negative maximal left ventricular pressure derivative (−dp/dtm) were automatically measured using Chart 7 software (ADInstruments, Colorado Springs, CO).
Statistics
All results are provided as means ± SEM. All statistical analyses were performed using GraphPad Prism. Differences between the two groups over time (indicated in the relevant figure legends) were determined by a two-way ANOVA for repeated measures. For comparisons between two independent groups, a Student’s t test was used. Significance was accepted at p < 0.05.
Supplementary Material
Highlights.
REMD 2.59 restores euglycemia, glucose tolerance, and insulin action
REMD 2.59 suppresses hepatic gluconeogenesis by improving insulin signaling to Akt
REMD 2.59 enhances AMPK-induced lipid oxidation in liver, muscle, and heart
REMD 2.59 improves cardiac function in mouse models of heart injury
Acknowledgments
W.L.H. is supported by grants from the NIH (R01DK108833 and R01DK112826) and JDRF (2-SRA-2016-149-Q-R). R.H.U. was supported by a VA Merit Grant and NIH R42DK108305 (to D.T.). A.X.S. was supported by AHA 15UFEL25090280. J.A.J. was supported by NIH F30DK1088534. S.A.M. was supported by NIH F32 DK112529. M.J.P. was supported by the NWNARCH and NIH T32GM008203. We thank Sihem Boudina for advice on this work. We thank Maureen Charron for glucogon receptor knockout mice (Gelling et al., 2003). This work was sponsored in part by a strategic research agreement with REMD Biotherapeutics.
Footnotes
Supplemental Information includes four figures and can be found with this article online at https://doi.org/10.1016/j.celrep.2018.01.065.
AUTHOR CONTRIBUTIONS
A.X.S., E.B.Q.-S., and W.L.H. wrote the manuscript. A.X.S., E.B.Q.-S., Y.L., S.C., M.-y.W., X.Y., J.A.J., Y.Z., M.J.P., and A.C.D. performed metabolic phenotyping and designed experiments with W.L.H. and R.H.U. S.A.M., M.J.P., J.G.M., and R.G. performed experiments related to lipidomic analysis. J. Lu, J. Li, Z.C., and Z.V.W. designed and performed cardiac phenotyping experiments. H.Y. and D.T. supervised aspects of REMD 2.59 production and use. All authors read the manuscript and contributed to revisions. W.L.H. is responsible for the integrity of this work.
DECLARATION OF INTERESTS
H.Y., J. Lu, and D.T. are employees and shareholders of REMD Biotherapeutics.
References
- Abraham MA, Yue JT, LaPierre MP, Rutter GA, Light PE, Filippi BM, Lam TK. Hypothalamic glucagon signals through the KATP channels to regulate glucose production. Mol. Metab. 2013;3:202–208. doi: 10.1016/j.molmet.2013.11.007. [DOI] [PMC free article] [PubMed] [Google Scholar]
- Ali S, Ussher JR, Baggio LL, Kabir MG, Charron MJ, Ilkayeva O, Newgard CB, Drucker DJ. Cardiomyocyte glucagon receptor signaling modulates outcomes in mice with experimental myocardial infarction. Mol. Metab. 2014;4:132–143. doi: 10.1016/j.molmet.2014.11.005. [DOI] [PMC free article] [PubMed] [Google Scholar]
- Aasum E, Belke DD, Severson DL, Riemersma RA, Cooper M, Andreassen M, Larsen TS. Cardiac function and metabolism in Type 2 diabetic mice after treatment with BM 17.0744, a novel PPAR-alpha activator. Am. J. Physiol. Heart Circ. Physiol. 2002;283:H949–957. doi: 10.1152/ajpheart.00226.2001. [DOI] [PubMed] [Google Scholar]
- Aw DK, Sinha RA, Xie SY, Yen PM. Differential AMPK phosphorylation by glucagon and metformin regulates insulin signaling in human hepatic cells. Biochem. Biophys. Res. Commun. 2014;447:569–573. doi: 10.1016/j.bbrc.2014.04.031. [DOI] [PubMed] [Google Scholar]
- Ayala JE, Bracy DP, James FD, Julien BM, Wasserman DH, Drucker DJ. The glucagon-like peptide-1 receptor regulates endogenous glucose production and muscle glucose uptake independent of its incretin action. Endocrinology. 2009;150:1155–1164. doi: 10.1210/en.2008-0945. [DOI] [PMC free article] [PubMed] [Google Scholar]
- Banting FG, Best CH, Collip JB, Campbell WR, Fletcher AA. Pancreatic extracts in the treatment of Diabetes Mellitus. Can. Med. Assoc. J. 1922;12:141–146. [PMC free article] [PubMed] [Google Scholar]
- Barnes AJ, Bloom SR, Goerge K, Alberti GM, Smythe P, Alford FP, Chisholm DJ. Ketoacidosis in pancreatectomized man. N. Engl. J. Med. 1977;296:1250–1253. doi: 10.1056/NEJM197706022962202. [DOI] [PubMed] [Google Scholar]
- Barouch LA, Berkowitz DE, Harrison RW, O’Donnell CP, Hare JM. Disruption of leptin signaling contributes to cardiac hypertrophy independently of body weight in mice. Circulation. 2003;108:754–759. doi: 10.1161/01.CIR.0000083716.82622.FD. [DOI] [PubMed] [Google Scholar]
- Barrera JG, Sandoval DA, D’Alessio DA, Seeley RJ. GLP-1 and energy balance: an integrated model of short-term and long-term control. Nat. Rev. Endocrinol. 2011;7:507–516. doi: 10.1038/nrendo.2011.77. [DOI] [PMC free article] [PubMed] [Google Scholar]
- Bligh EG, Dyer WJ. A rapid method of total lipid extraction and purification. Can. J. Biochem. Physiol. 1959;37:911–917. doi: 10.1139/o59-099. [DOI] [PubMed] [Google Scholar]
- Campbell JE, Drucker DJ. Islet α cells and glucagon-critical regulators of energy homeostasis. Nat. Rev. Endocrinol. 2015;11:329–338. doi: 10.1038/nrendo.2015.51. [DOI] [PubMed] [Google Scholar]
- Cao J, Meng S, Chang E, Beckwith-Fickas K, Xiong L, Cole RN, Radovick S, Wondisford FE, He L. Low concentrations of metformin suppress glucose production in hepatocytes through AMP-activated protein kinase (AMPK) J. Biol. Chem. 2014;289:20435–20446. doi: 10.1074/jbc.M114.567271. [DOI] [PMC free article] [PubMed] [Google Scholar]
- Ceriello A, Genovese S, Mannucci E, Gronda E. Glucagon and heart in type 2 diabetes: new perspectives. Cardiovasc. Diabetol. 2016;15:123. doi: 10.1186/s12933-016-0440-3. [DOI] [PMC free article] [PubMed] [Google Scholar]
- Cokorinos EC, Delmore J, Reyes AR, Albuquerque B, Kjøbsted R, Jørgensen NO, Tran JL, Jatkar A, Cialdea K, Esquejo RM, et al. Activation of Skeletal Muscle AMPK Promotes Glucose Disposal and Glucose Lowering in Non-human Primates and Mice. Cell Metab. 2017;25:1147–1159.e10. doi: 10.1016/j.cmet.2017.04.010. [DOI] [PubMed] [Google Scholar]
- Conarello SL, Jiang G, Mu J, Li Z, Woods J, Zycband E, Ronan J, Liu F, Roy RS, Zhu L, et al. Glucagon receptor knockout mice are resistant to diet-induced obesity and streptozotocin-mediated beta cell loss and hyperglycaemia. Diabetologia. 2007;50:142–150. doi: 10.1007/s00125-006-0481-3. [DOI] [PubMed] [Google Scholar]
- Dean ED, Li M, Prasad N, Wisniewski SN, Von Deylen A, Spaeth J, Maddison L, Botros A, Sedgeman LR, Bozadjieva N, et al. Interrupted Glucagon Signaling Reveals Hepatic α Cell Axis and Role for L-Glutamine in α Cell Proliferation. Cell Metab. 2017;25:362–1373.e5. doi: 10.1016/j.cmet.2017.05.011. [DOI] [PMC free article] [PubMed] [Google Scholar]
- Demarco VG, Ford DA, Henriksen EJ, Aroor AR, Johnson MS, Habibi J, Ma L, Yang M, Albert CJ, Lally JW, et al. Obesity-related alterations in cardiac lipid profile and nondipping blood pressure pattern during transition to diastolic dysfunction in male db/db mice. Endocrinology. 2013;154:159–171. doi: 10.1210/en.2012-1835. [DOI] [PMC free article] [PubMed] [Google Scholar]
- Gelling RW, Du XQ, Dichmann DS, Romer J, Huang H, Cui L, Obici S, Tang B, Holst JJ, Fledelius C, et al. Lower blood glucose, hyperglucagonemia, and pancreatic alpha cell hyperplasia in glucagon receptor knockout mice. Proc. Natl. Acad. Sci. USA. 2003;100:1438–1443. doi: 10.1073/pnas.0237106100. [DOI] [PMC free article] [PubMed] [Google Scholar]
- Gu W, Yan H, Winters KA, Komorowski R, Vonderfecht S, Atangan L, Sivits G, Hill D, Yang J, Bi V, et al. Long-term inhibition of the glucagon receptor with a monoclonal antibody in mice causes sustained improvement in glycemic control, with reversible alpha-cell hyperplasia and hyperglucagonemia. J. Pharmacol. Exp. Ther. 2009;331:871–881. doi: 10.1124/jpet.109.157685. [DOI] [PubMed] [Google Scholar]
- Gu W, Winters KA, Motani AS, Komorowski R, Zhang Y, Liu Q, Wu X, Rulifson IC, Sivits G, Jr, Graham M, et al. Glucagon receptor antagonist-mediated improvements in glycemic control are dependent on functional pancreatic GLP-1 receptor. Am. J. Physiol. Endocrinol. Metab. 2010;299:E624–E632. doi: 10.1152/ajpendo.00102.2010. [DOI] [PubMed] [Google Scholar]
- Guan HP, Yang X, Lu K, Wang SP, Castro-Perez JM, Previs S, Wright M, Shah V, Herath K, Xie D, et al. Glucagon receptor antagonism induces increased cholesterol absorption. J. Lipid Res. 2015;56:2183–2195. doi: 10.1194/jlr.M060897. [DOI] [PMC free article] [PubMed] [Google Scholar]
- Habegger KM, Heppner KM, Geary N, Bartness TJ, DiMarchi R, Tschöp MH. The metabolic actions of glucagon revisited. Nat. Rev. Endocrinol. 2010;6:689–697. doi: 10.1038/nrendo.2010.187. [DOI] [PMC free article] [PubMed] [Google Scholar]
- Haluzik M, Colombo C, Gavrilova O, Chua S, Wolf N, Chen M, Stannard B, Dietz KR, Le Roith D, Reitman ML. Genetic background (C57BL/6J versus FVB/N) strongly influences the severity of diabetes and insulin resistance in ob/ob mice. Endocrinology. 2004;145:3258–3264. doi: 10.1210/en.2004-0219. [DOI] [PubMed] [Google Scholar]
- He L, Chang E, Peng J, An H, McMillin SM, Radovick S, Stratakis CA, Wondisford FE. Activation of the cAMP-PKA pathway antagonizes metformin suppression of hepatic glucose production. J. Biol. Chem. 2016;291:10562–10570. doi: 10.1074/jbc.M116.719666. [DOI] [PMC free article] [PubMed] [Google Scholar]
- Holland WL, Summers SA. Sphingolipids, insulin resistance, and metabolic disease: new insights from in vivo manipulation of sphingolipid metabolism. Endocr. Rev. 2008;29:381–402. doi: 10.1210/er.2007-0025. [DOI] [PMC free article] [PubMed] [Google Scholar]
- Holland WL, Miller RA, Wang ZV, Sun K, Barth BM, Bui HH, Davis KE, Bikman BT, Halberg N, Rutkowski JM, et al. Receptor-mediated activation of ceramidase activity initiates the pleiotropic actions of adiponectin. Nat. Med. 2011;17:55–63. doi: 10.1038/nm.2277. [DOI] [PMC free article] [PubMed] [Google Scholar]
- Jazayeri A, Doré AS, Lamb D, Krishnamurthy H, Southall SM, Baig AH, Bortolato A, Koglin M, Robertson NJ, Errey JC, et al. Extra-helical binding site of a glucagon receptor antagonist. Nature. 2016;533:274–277. doi: 10.1038/nature17414. [DOI] [PubMed] [Google Scholar]
- Kazda CM, Ding Y, Kelly RP, Garhyan P, Shi C, Lim CN, Fu H, Watson DE, Lewin AJ, Landschulz WH, et al. Evaluation of efficacy and safety of the glucagon receptor antagonist LY2409021 in patients with type 2 diabetes: 12- and 24-week phase 2 studies. Diabetes Care. 2016;39:1241–1249. doi: 10.2337/dc15-1643. [DOI] [PubMed] [Google Scholar]
- Kim TT, Dyck JR. Is AMPK the savior of the failing heart? Trends Endocrinol. Metab. 2015;26:40–48. doi: 10.1016/j.tem.2014.11.001. [DOI] [PubMed] [Google Scholar]
- Kjøbsted R, Munk-Hansen N, Birk JB, Foretz M, Viollet B, Björnholm M, Zierath JR, Treebak JT, Wojtaszewski JF. Enhanced muscle insulin sensitivity after contraction/exercise is mediated by AMPK. Diabetes. 2017;66:598–612. doi: 10.2337/db16-0530. [DOI] [PubMed] [Google Scholar]
- Koth CM, Murray JM, Mukund S, Madjidi A, Minn A, Clarke HJ, Wong T, Chiang V, Luis E, Estevez A, et al. Molecular basis for negative regulation of the glucagon receptor. Proc. Natl. Acad. Sci. USA. 2012;109:14393–14398. doi: 10.1073/pnas.1206734109. [DOI] [PMC free article] [PubMed] [Google Scholar]
- Kuroda M, Honnor RC, Cushman SW, Londos C, Simpson IA. Regulation of insulin-stimulated glucose transport in the isolated rat adipocyte. cAMP-independent effects of lipolytic and antilipolytic agents. J. Biol. Chem. 1987;262:245–253. [PubMed] [Google Scholar]
- Kusminski CM, Holland WL, Sun K, Park J, Spurgin SB, Lin Y, Askew GR, Simcox JA, McClain DA, Li C, Scherer PE. Mito NEET-driven alterations in adipocyte mitochondrial activity reveal a crucial adaptive process that preserves insulin sensitivity in obesity. Nat. Med. 2012;18:1539–1549. doi: 10.1038/nm.2899. [DOI] [PMC free article] [PubMed] [Google Scholar]
- Langhans W, Duss M, Scharrer E. Decreased feeding and supraphysiological plasma levels of glucagon after glucagon injection in rats. Physiol. Behav. 1987;41:31–35. doi: 10.1016/0031-9384(87)90127-2. [DOI] [PubMed] [Google Scholar]
- Lee Y, Naseem RH, Duplomb L, Park BH, Garry DJ, Richardson JA, Schaffer JE, Unger RH. Hyperleptinemia prevents lipotoxic cardiomyopathy in acyl CoA synthase transgenic mice. Proc. Natl. Acad.Sci. USA. 2004;101:13624–13629. doi: 10.1073/pnas.0405499101. [DOI] [PMC free article] [PubMed] [Google Scholar]
- Lee Y, Berglund ED, Yu X, Wang MY, Evans MR, Scherer PE, Holland WL, Charron MJ, Roth MG, Unger RH. Hyperglycemia in rodent models of type 2 diabetes requires insulin-resistant alpha cells. Proc. Natl. Acad. Sci. USA. 2014;111:13217–13222. doi: 10.1073/pnas.1409638111. [DOI] [PMC free article] [PubMed] [Google Scholar]
- Liao Y, Takashima S, Maeda N, Ouchi N, Komamura K, Shimomura I, Hori M, Matsuzawa Y, Funahashi T, Kitakaze M. Exacerbation of heart failure in adiponectin-deficient mice due to impaired regulation of AMPK and glucose metabolism. Cardiovasc. Res. 2005;67:705–713. doi: 10.1016/j.cardiores.2005.04.018. [DOI] [PubMed] [Google Scholar]
- Livak KJ, Schmittgen TD. Analysis of relative gene expression data using real-time quantitative PCR and the 2(-Delta Delta C(T)) Method. Methods. 2001;25:402–408. doi: 10.1006/meth.2001.1262. [DOI] [PubMed] [Google Scholar]
- Longuet C, Sinclair EM, Maida A, Baggio LL, Maziarz M, Charron MJ, Drucker DJ. The glucagon receptor is required for the adaptive metabolic response to fasting. Cell Metab. 2008;8:359–371. doi: 10.1016/j.cmet.2008.09.008. [DOI] [PMC free article] [PubMed] [Google Scholar]
- McGarry JD, Sen A, Esser V, Woeltje KF, Weis B, Foster DW. New insights into the mitochondrial carnitine palmitoyltransferase enzyme system. Biochimie. 1991;73:77–84. doi: 10.1016/0300-9084(91)90078-f. [DOI] [PubMed] [Google Scholar]
- Miller RA, Chu Q, Xie J, Foretz M, Viollet B, Birnbaum MJ. Biguanides suppress hepatic glucagon signalling by decreasing production of cyclic AMP. Nature. 2013;494:256–260. doi: 10.1038/nature11808. [DOI] [PMC free article] [PubMed] [Google Scholar]
- Mori J, Patel VB, Abo Alrob O, Basu R, Altamimi T, Desaulniers J, Wagg CS, Kassiri Z, Lopaschuk GD, Oudit GY. Angiotensin 1–7 ameliorates diabetic cardiomyopathy and diastolic dysfunction in db/db mice by reducing lipotoxicity and inflammation. Circ Heart Fail. 2014;7:327–339. doi: 10.1161/CIRCHEARTFAILURE.113.000672. [DOI] [PubMed] [Google Scholar]
- Okamoto H, Kim J, Aglione J, Lee J, Cavino K, Na E, Rafique A, Kim JH, Harp J, Valenzuela DM, et al. Glucagon receptor blockade with a human antibody normalizes blood glucose in diabetic mice and monkeys. Endocrinology. 2015;156:2781–2794. doi: 10.1210/en.2015-1011. [DOI] [PubMed] [Google Scholar]
- Park TS, Hu Y, Noh HL, Drosatos K, Okajima K, Buchanan J, Tuinei J, Homma S, Jiang XC, Abel ED, Goldberg IJ. Ceramide is a cardiotoxin in lipotoxic cardiomyopathy. J. Lipid Res. 2008a;49:2101–2112. doi: 10.1194/jlr.M800147-JLR200. [DOI] [PMC free article] [PubMed] [Google Scholar]
- Park TS, Rosebury W, Kindt EK, Kowala MC, Panek RL. Serine palmitoyltransferase inhibitor myriocin induces the regression of atherosclerotic plaques in hyperlipidemic ApoE-deficient mice. Pharmacol. Res. 2008b;58:45–51. doi: 10.1016/j.phrs.2008.06.005. [DOI] [PubMed] [Google Scholar]
- Pearson MJ, Unger RH, Holland WL. Clinical trials, triumphs, and tribulations of glucagon receptor antagonists. Diabetes Care. 2016;39:1075–1077. doi: 10.2337/dci15-0033. [DOI] [PMC free article] [PubMed] [Google Scholar]
- Perea A, Clemente F, Martinell J, Villanueva-Penacarrillo ML, Valverde I. Physiological effect of glucagon in human isolated adipocytes. Horm. Metab. Res. 1995;27:372–375. doi: 10.1055/s-2007-979981. [DOI] [PubMed] [Google Scholar]
- Pettus J, Reeds D, Cavaiola TS, Boeder S, Levin M, Cava E, Thai D, Shi J, Yan H, Bautista E, et al. REMD-477, a human glucagon receptor antibody, reduces daily insulin requirements and improves glycemic control in people with type 1 diabetes. Diabetes. 2017;66(Supplement 1):A100. [Google Scholar]
- Prigeon RL, Quddusi S, Paty B, D’Alessio DA. Suppression of glucose production by GLP-1 independent of islet hormones: a novel extrapancreatic effect. Am. J. Physiol. Endocrinol. Metab. 2003;285:E701–E707. doi: 10.1152/ajpendo.00024.2003. [DOI] [PubMed] [Google Scholar]
- Quiñones M, Al-Massadi O, Gallego R, Fernø J, Diéguez C, López M, Nogueiras R. Hypothalamic CaMKKb mediates glucagon anorectic effect and its diet-induced resistance. Mol. Metab. 2015;4:961–970. doi: 10.1016/j.molmet.2015.09.014. [DOI] [PMC free article] [PubMed] [Google Scholar]
- Radovits T, Korkmaz S, Loganathan S, Barnucz E, Bömicke T, Arif R, Karck M, Szabó G. Comparative investigation of the left ventricular pressure-volume relationship in rat models of type 1 and type 2 diabetes mellitus. Am. J. Physiol. Heart Circ. Physiol. 2009;297:H125–H133. doi: 10.1152/ajpheart.00165.2009. [DOI] [PubMed] [Google Scholar]
- Raichur S, Wang ST, Chan PW, Li Y, Ching J, Chaurasia B, Dogra S, Öhman MK, Takeda K, Sugii S, et al. CerS2 haploinsufficiency inhibits β-oxidation and confers susceptibility to diet-induced steatohepatitis and insulin resistance. Cell Metab. 2014;20:687–695. doi: 10.1016/j.cmet.2014.09.015. [DOI] [PubMed] [Google Scholar]
- Russo SB, Baicu CF, Van Laer A, Geng T, Kasiganesan H, Zile MR, Cowart LA. Ceramide synthase 5 mediates lipid-induced autophagy and hypertrophy in cardiomyocytes. J. Clin. Invest. 2012;122:3919–3930. doi: 10.1172/JCI63888. [DOI] [PMC free article] [PubMed] [Google Scholar]
- Sammons MF, Lee EC. Recent progress in the development of small-molecule glucagon receptor antagonists. Bioorg. Med. Chem. Lett. 2015;25:4057–4064. doi: 10.1016/j.bmcl.2015.07.092. [DOI] [PubMed] [Google Scholar]
- Senkal CE, Salama MF, Snider AJ, Allopenna JJ, Rana NA, Koller A, Hannun YA, Obeid LM. Ceramide Is metabolized to Acylceramide and stored in lipid droplets. Cell Metab. 2017;25:686–697. doi: 10.1016/j.cmet.2017.02.010. [DOI] [PMC free article] [PubMed] [Google Scholar]
- Turpin SM, Nicholls HT, Willmes DM, Mourier A, Brodesser S, Wunderlich CM, Mauer J, Xu E, Hammerschmidt P, Brönneke HSA, et al. Obesity-induced CerS6-dependent C16:0 ceramide production promotes weight gain and glucose intolerance. Cell Metab. 2014;20:678–686. doi: 10.1016/j.cmet.2014.08.002. [DOI] [PubMed] [Google Scholar]
- Unger RH. Minireview: weapons of lean body mass destruction: the role of ectopic lipids in the metabolic syndrome. Endocrinology. 2003;144:5159–5165. doi: 10.1210/en.2003-0870. [DOI] [PubMed] [Google Scholar]
- Unger RH, Eisentraut AM, McCall MS, Keller S, Lanz HC, Madison LL. Glucagon antibodies and their use for immunoassay for glucagon. Proc. Soc. Exp. Biol. Med. 1959;102:621–623. doi: 10.3181/00379727-102-25338. [DOI] [PubMed] [Google Scholar]
- Wang MY, Unger RH. Role of PP2C in cardiac lipid accumulation in obese rodents and its prevention by troglitazone. Am. J. Physiol. Endocrinol. Metab. 2005;288:E216–E221. doi: 10.1152/ajpendo.00004.2004. [DOI] [PubMed] [Google Scholar]
- Wang ZV, Li DL, Hill JA. Heart failure and loss of metabolic control. J. Cardiovasc. Pharmacol. 2014a;63:302–313. doi: 10.1097/FJC.0000000000000054. [DOI] [PMC free article] [PubMed] [Google Scholar]
- Wang ZV, Deng Y, Gao N, Pedrozo Z, Li DL, Morales CR, Criollo A, Luo X, Tan W, Jiang N, et al. Spliced X-box binding protein 1 couples the unfolded protein response to hexosamine biosynthetic pathway. Cell. 2014b;156:1179–1192. doi: 10.1016/j.cell.2014.01.014. [DOI] [PMC free article] [PubMed] [Google Scholar]
- Wang MY, Yan H, Shi Z, Evans MR, Yu X, Lee Y, Chen S, Williams A, Philippe J, Roth MG, Unger RH. Glucagon receptor antibody completely suppresses type 1 diabetes phenotype without insulin by disrupting a novel diabetogenic pathway. Proc. Natl. Acad. Sci. USA. 2015;112:2503–2508. doi: 10.1073/pnas.1424934112. [DOI] [PMC free article] [PubMed] [Google Scholar]
- Xia JY, Holland WL, Kusminski CM, Sun K, Sharma AX, Pearson MJ, Sifuentes AJ, McDonald JG, Gordillo R, Scherer PE. Targeted Induction of Ceramide Degradation Leads to Improved Systemic Metabolism and Reduced Hepatic Steatosis. Cell Metab. 2015;22:266–278. doi: 10.1016/j.cmet.2015.06.007. [DOI] [PMC free article] [PubMed] [Google Scholar]
- Yagyu H, Chen G, Yokoyama M, Hirata K, Augustus A, Kako Y, Seo T, Hu Y, Lutz EP, Merkel M, et al. Lipoprotein lipase (LpL) on the surface of cardiomyocytes increases lipid uptake and produces a cardiomyopathy. J. Clin. Invest. 2003;111:419–426. doi: 10.1172/JCI16751. [DOI] [PMC free article] [PubMed] [Google Scholar]
- Yan H, Gu W, Yang J, Bi V, Shen Y, Lee E, Winters KA, Komorowski R, Zhang C, Patel JJ, et al. Fully human monoclonal antibodies antagonizing the glucagon receptor improve glucose homeostasis in mice and monkeys. J. Pharmacol. Exp. Ther. 2009;329:102–111. doi: 10.1124/jpet.108.147009. [DOI] [PubMed] [Google Scholar]
- Zu L, Bedja D, Fox-Talbot K, Gabrielson KL, Van Kaer L, Becker LC, Cai ZP. Evidence for a role of immunoproteasomes in regulating cardiac muscle mass in diabetic mice. J. Mol. Cell Cardiol. 2010;49:5–15. doi: 10.1016/j.yjmcc.2010.02.007. [DOI] [PMC free article] [PubMed] [Google Scholar]
Associated Data
This section collects any data citations, data availability statements, or supplementary materials included in this article.