Abstract
MicroRNA is an endogenous, small RNA controlling multiple target genes and playing roles in various biological processes including tumorigenesis. Here, we addressed the function of miR-155 using LC-MS/MS-based metabolic profiling of miR-155 deficient breast cancer cells. Our results revealed the loss of miR-155 hampers glucose uptake and glycolysis, via the down-regulation of glucose transporters and metabolic enzymes including HK2, PKM2, and LDHA. We showed this is due to the down-regulation of cMYC, controlled through phosphoinositide-3-kinase regulatory subunit alpha (PIK3R1)-PDK1/AKT-FOXO3a pathway. UTR analysis of the PIK3R1 and FOXO3a indicated miR-155 directly represses these genes. A stable expression of miR-155 in patient-derived cells (PDCs) showed activated glucose metabolism whereas a stable inhibition of miR-155 reduced in vivo tumor growth with retarded glucose metabolism. Furthermore, analysis of 50 triple-negative breast cancer (TNBC) specimens and specific uptake value (SUV) of PET images revealed a positive correlation between miR-155 level and glucose usage in human breast tumors via PIK3R1-PDK/AKT-FOXO3a-cMYC axis. Collectively, these data demonstrate the miR-155 is a key regulator of glucose metabolism in breast cancer.
Introduction
MicroRNA (miRNAs) is a class of non-coding, 20–25 nucleotide-long RNAs. Particularly, they can interact with 3′-untranslated regions (3′-UTRs) of target messenger RNAs (mRNAs) thereby regulate target gene expression by translation inhibition or mRNA degradation at post-transcriptional level. Among many miRNAs that have been linked to cancer, MicroRNA-155 is a well-known oncogenic microRNA with various functional targets [1–5]. However, because each microRNA can regulate the expression of hundreds of genes [6–8], understanding the functional consequence for the change in microRNA expression is challenging.
Abnormal metabolic shift by increased aerobic glycolysis (Warburg effect) is a common feature of cancer cells [9]. This metabolic shift in is required for the rapid cell proliferation, rather than energy production. Understanding how cancer cells drive such metabolic shift is crucial to identify potential targets for cancer therapeutics. A recent study has demonstrated that miR-155 upregulates HK2 through the activation of STAT3 and suppression of miR-143 that can target HK2 [10].
Here, we report the miR-155 positively regulates energy metabolism through PIK3R1-PDK/AKT-FOXO3a-cMYC axis in breast cancer. Using breast cancer model with miR-155ko/ko or miR-155+/ko backgrounds, we investigated miR-155 dependent metabolic alterations. We found that miR-155+/ko tumor cells increase glucose uptake and lactate production compared to the miR-155ko/ko tumor cells. We further showed that miR-155 directly repress the PIK3R1 or FOXO3a in breast cancer cells, and showed the PIK3R1-PDK1/AKT-FOXO3a pathway to be important in regulating glucose metabolism. Furthermore, we confirmed the regulation of glucose metabolism by miR155 in vivo, and revealed a positive correlation between miR-155 and standardized uptake values (SUV) in triple negative breast tumors.
Results
Retarded glucose metabolism in miR-155KO/KO mammary tumor cells
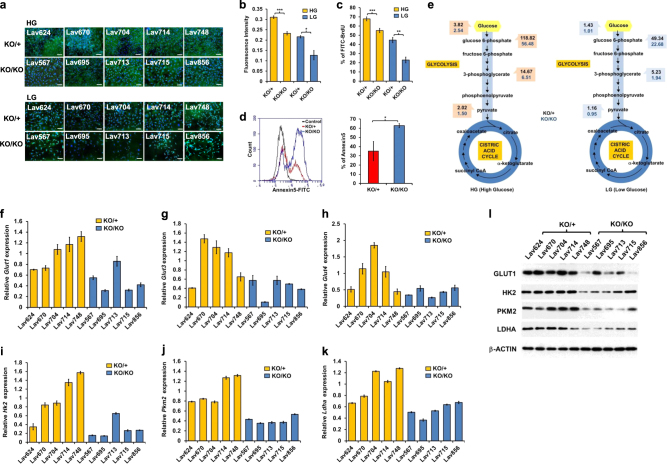
Our previous study suggested that the inhibition of miR-155 impedes breast tumor growth in mice [11, 12]. To understand the underlying mechanism of the oncogenic function of the miR-155, a miR-155 deficient-mouse breast cancer model was generated [12]. Phenotypic analysis of the miR-155 deficient tumor cells (miR-155ko/ko cells hereafter) revealed a reduction in the mitochondrial oxygen consumption (Supplementary Fig 1a), suggesting a compromised energy metabolism. Based on this data, we challenged miR-155ko/+ and miR-155ko/ko cells by culturing it in regular (with high glucose, HG) or low glucose (LG) media. Interestingly, we found fewer number of miR-155ko/ko cells compared to miR-155ko/+ cells in both media but the difference was more evident in LG media, visualized by CellMask assay (Fig. 1a and Supplementary Fig 1b for phase contrast images). Proliferation assay (Fig. 1b and Supplementary Fig 1c for confirmation results), cell cycle analysis (Fig. 1c) and apoptosis assay (Fig. 1d) also indicated that the miR-155ko/ko cells have enhanced proliferation defects in low glucose condition.
Fig. 1.
Retarded glucose metabolism in miR-155ko/ko mammary tumor cells. a CellMask plasma membrane/DAPI stain images of miR-155ko/+ or miR-155ko/ko cells cultured in media with high glucose (HG) or low glucose (LG) for 3 days (scale bar: 200μM). b Cell proliferation assay results after culture in HG (in yellow) or LG (in blue) media for 3 days. AlamarBlue assay was performed using a fluorescence spectrophotometer. ***p < 0.001 c BrdU cell proliferation assay results measured by Flow Cytometry (See Methods). The portion of BrdU positive cells were indicated as yellow (HG) or blue bar (LG). ***p < 0.001 d Left: representative picture of Annexin-V apoptosis assay results. The Annexin-V positive cells were indicated as red (for KO/+) or blue (for KO/KO). Right panel shows a graph for the AUC (area under curve) value of the left panel. Error bar means ± SEM (n = 5). e Graphical presentation of LC-MS/MS results by flow diagram, showing glucose and its metabolite levels of miR-155ko/+(marked in black numbers) or miR-155ko/ko (marked in blue numbers) cells cultured in HG (left) or LG media (right). f–k qRT-PCR analysis of Glut1 (f), Glut3 (g), Glut4 (h), Hh2 (i), Pkm2 (j) and Ldha (k) genes. Data were normalized to human RPL13a level. Error bar means ± SEM (n = 3). *p < .0.05, **p < 0.01, ***p < 0.001 (l). Western blot results of GLUT1, HK2, PKM2, and LDHA proteins in miR-155ko/+ or miR-155ko/ko cells. β-ACTIN was used as loading control
Based on the results of Fig. 1a–c, we performed targeted metabolomics focused on the glycolysis and TCA cycle, and found the absence of miR-155 caused less level of intracellular glucose as well as downstream glycolytic metabolites (Supplementary Table 1 and Fig. 1e for flow diagram). Consistent with the cellular phenotype, the metabolic difference between miR-155ko/+ and miR-155ko/ko cells became more evident under the low-glucose condition (Fig. 1e right side). To understand this observation further, we first measured the expression of major genes involved in the glucose transport and glycolysis. The miR-155ko/ko cells showed reduced expression of Glut1,3,4 (Fig. 1f–h), Hk2, Pkm2, and Ldha RNAs (Fig. 1i–k) as well as proteins (Fig. 1l and Supplementary Fig. d–g). These data suggest that the loss of miR-155 causes a shift in glucose metabolism via altered regulation of multiple genes involved in glucose usage.
Upregulation of PIK3R1-FOXO3a-cMYC pathway by miR-155 augments glucose metabolism
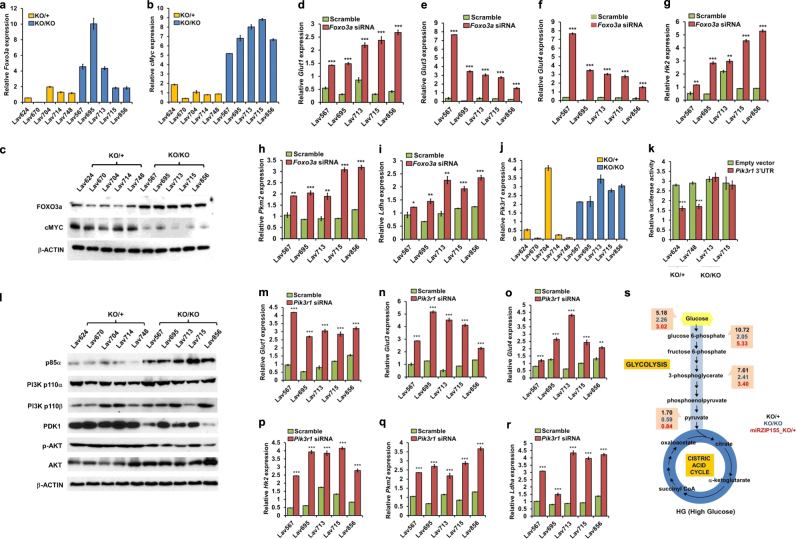
To clarify the underlying mechanism of the miR-155-mediated shift in glucose metabolism, we searched for a miR-155 target gene responsible for the gene regulation shown above. Considering miRNA generally down-regulates its target genes, and the reduced gene expression shown in Fig. 1f–l was observed in miR-155 deficient cells, we speculated a mediator that is negatively controlled by miR-155 and deliver its signal to drive the expression change of metabolic genes. Among such mediator candidates, we first focused on FOXO3a-cMYC as the cMYC is a known master regulator of glycolysis [13, 14] and Foxo3a is a target of miR-155 in breast cancer [15]. Indeed, we found the Foxo3a expression to be dramatically up-regulated in miR-155ko/ko cells (Fig. 2a, b). As the FOXO3a is known to destabilize cMYC [16], we also could detect repressed cMYC expression in miR-155ko/ko cells (Fig. 2c and Supplementary Fig. c and d). Importantly, the siRNA mediated knock-down of Foxo3a (Supplementary Fig 2a) in miR-155ko/ko cells dramatically increased the expression of glucose transporters (Fig. 2d–f) as well as glycolytic enzymes (Fig. 2g–i), demonstrating that FOXO3a is a key regulator of the miR-155 mediated metabolic shift. However, the Foxo3a does not have miR-155 binding site in its 3’UTR (in murine sequence), suggesting a presence of another upstream regulator targeted by miR-155 and initiate the signal for the metabolic shift.
Fig. 2.
Upregulation of Pik3r1-Foxo3a-cMyc pathway by miR-155 augments glucose metabolism. a, b qRT-PCR results of Foxo3a and cMyc genes in miR-155ko/+ or miR-155ko/ko cells. Data are normalized to mouse Rpl13a. Error bar means ± SEM (n = 3). *p < .0.05, **p < 0.01, ***p < 0.001. c Western blot results of FOXO3a and cMYC protein from miR-155ko/+ or miR-155ko/ko cells. β-ACTIN was used as loading control. d–i qRT-PCR results of Glut1 (d), Glut3 (e), Glut4 (f), Hk2 (g), Pkm2 (h), and Ldha (i) genes in miR-155ko/ko cells after knockdown of Foxo3a by siRNA. (j) A graph showing qRT-PCR results of Pik3r1 gene in miR-155ko/+ or miR-155ko/ko cells. Normalized to mouse Rpl13a. Error bar means ± SEM (n = 3). *p < .0.05, **p < 0.01, ***p < 0.001. k Luciferase reporter activity for the Pik3r1 3′UTR. A Luciferase reporter vector containing Pik3r 3′UTR region or an empty vector was transfected into miR-155ko/+ or miR-155ko/ko cells and the luciferase activity was measured after 24 h. Error bar means ± SEM (n = 3). **p < 0.01, ***p < 0.001 (l). Western blot results of p85α, PI3K p100α, PI3K p110β, PDK1, p-AKT, AKT and cMYC proteins from miR-155ko/+ or miR-155ko/ko cells. β-ACTIN was used as a loading control. m–r qRT-PCR results of Glut1 (m), Glut3 (n), Glut4 (o), Hk2 (p), Pkm2 (q), and Ldha (r) genes after knockdown of the Pik3r1 in miR-155ko/ko cells by siRNA. s A flow diagram presentation of LC-MS/MS results measuring glucose and its metabolites, from miR-155ko/+ (Marked in black) or miR-155ko/ko (marked in blue). miR-155ko/+ cells with stable inhibition of miR-155 (miRZIP), were also analyzed and marked in red (miRZIP155_ko/+)
PI3K pathway has been one of the known upstream regulator of the FOXO3a [17]. Specifically, the PI3K induces phosphorylation of FOXO3a via AKT that results in its degradation [18]. Interestingly, p85α (The protein from Pik3r1 gene) that negatively regulates the catalytic activity of PI3K [19, 20], was reported as a target of miR-155 in B-cell lymphoma [21]. Hence, we reasoned that the inhibition of Pik3r1 by miR-155 can result in PI3K-AKT activation and consequently cause a reduction in the Foxo3a level in breast cancer cell. Indeed, the Pik3r1 gene is upregulated in miR-155ko/ko cells (Fig. 2j) and the absence of miR-155 increases Pik3r1-UTR reporter (Fig. 2k), suggesting it is negatively regulated by miR-155. Moreover, we found the loss of miR-155 inhibits PI3K-PDK1/AKT pathway via the up-regulation of p85α, as shown by western blotting (Fig. 2l and Supplementary Fig. e–f). The siRNA mediated knock-down of Pik3r1 in miR-155ko/ko cells (Supplementary Fig 2b) phenocopied the knock-down of Foxo3a in the metabolic gene regulation, as shown in Fig. 2m–r. This data suggests that these two genes are involved in the same regulatory pathway for the glucose usage. Furthermore, a stable knockdown of miR-155 (by miRZIP lentivirus; Supplementary Fig 1k) in five miR-155ko/+ cells caused a similar proliferation defect (Supplementary Fig 1l) in low glucose condition as well as a decreased glucose metabolism, consistent to the data from the miR-155ko/ko cells (Fig. 2s for flow diagram and Supplementary Table 2). These data indicate the miR-155 acts as a strong regulatory factor in glucose metabolism, overriding diverse mutation backgrounds of the primary cancer cells.
miR-155, a modulator of PIK3R1 and FOXO3a expression, positively regulates glucose metabolism in human breast cancer cells
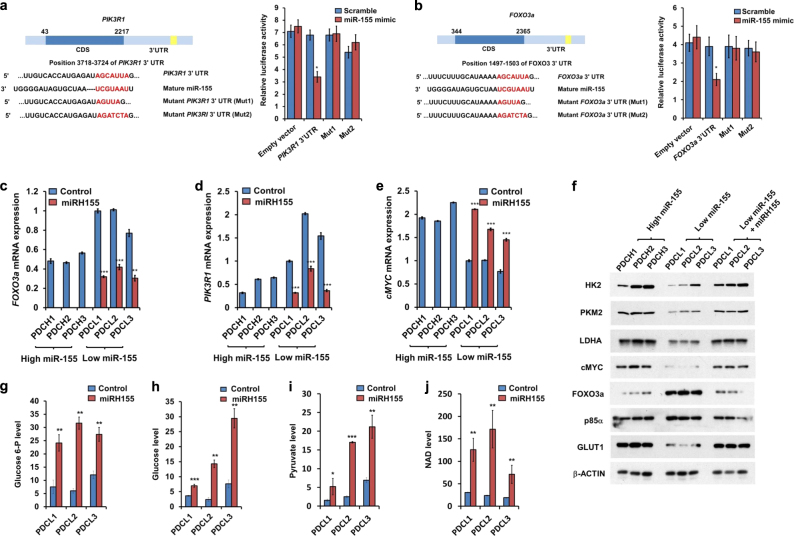
We next examined if the miR-155 mediated metabolic shift is also valid in human cancer. In MCF7 breast cancer cells, UTR reporter assay of PIK3R1 and FOXO3a with miR-155 mimic indicated that miR-155 negatively regulates PIK3R1 (Fig. 3a) and FOXO3a (Fig. 3b) genes. Alternatively, we established a set of PDC (Patient Derived Cells) from TNBC specimen and stably expressed miR-155 in miR-155 low-PDCs (PDCL, Supplementary Fig. a and b). In these cells, we observed restoration of upregulated FOXO3a and PIK3R1 (Fig. 3c, d) as well as increased cMYC level (Fig. 3e), comparable to the miR-155 high cells (PDCH). Consequently, the stable expression of miR-155 boosted glucose metabolism via up-regulated GLUT1 and glycolytic enzymes at the protein level (Fig. 3f and Supplementary Fig. g–m). In the miR-155 low PDCs, the level of glucose metabolites was lower than miR-155 high cells (Supplementary Fig 3c–f and Supplementary Table 3). Upon the stable expression of miR-155, we observed up-regulated glucose metabolites and NAD level (Fig. 3g–j). Altogether, these data demonstrate that miR-155 controls p85α-AKT-FOXO3a axis and causes a shift in glucose metabolism via cMYC in human breast cancer cells.
Fig. 3.
miR-155, a modulator of PIK3R1 and FOXO3a protein expression, positively regulate glucose metabolism in human breast cancer cells. a Left: A schematic diagram of the PIK3R1 cDNA with 3′UTR. The predicted miR-155 binding site is indicated as yellow. Light panel: A graph showing luciferase activity of control (empty) or WT or Mutant PIK3R1 UTR (Mut1 or Mut2) reporters. Luciferase reporters were transfected with either scrambled (in blue) or miR-155 mimics (in red). b Left: A schematic diagram of the FOXO3a cDNA with 3′UTR. The predicted miR-155 binding site is indicated as yellow. Light panel: A Graph showing measurement of luciferase activity to confirm whether FOXO3a is a direct target of miR-155. Luciferase constructs containing the 3′UTR of FOXO3a or 3′UTR with point mutations (Mut1 or Mut2) in the miR-155 binding site were transfected with either scrambled (in blue) or miR-155 mimics (in red). (c–e) qRT-PCR results of PIK3R1 (c), FOXO3a (d), and cMYC (e) in human primary breast cancer cells. The human primary breast cancer cells are classified into miR-155 high (PDCH1,2,3) or low (PDCL1,2,3) groups by miR-155 level (See Supplementary Fig 3b). f Western blot results of GLUT1, HK2, PKM2, and LDHA proteins in human primary breast cancer cells used in (c–e). β-ACTIN was used as loading control. g–j Relative glucose-6P (g), glucose (h), pyruvate (i), and NAD (j) levels, measured by LC-MS/MS in miR-155 low control (in blue) or miR-155 over-expressed cells via lentiviral infection (miRH155, in red)
miR-155 promotes glucose metabolism through the activation of p85α-FOXO3a-cMYC axis in vivo
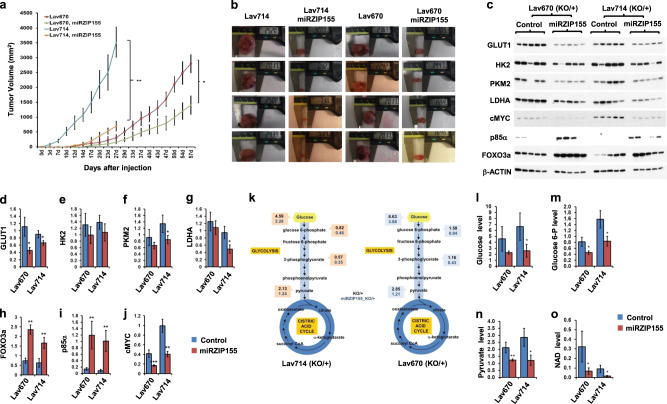
Based on these results in cancer cells, we further examined the positive role of miR-155 in glucose metabolism in vivo. First, an allograft model using two primary murine cancer cells (Lav670 and Lav714) with stable miR-155 knockdown (by miRZIP, Supplementary Fig 4a) showed slower in vivo growth compared to their isogenic, paired clones (Fig. 4a–b and Supplementary Fig. EV4b–d). In these control/miRZIP allograft tumors, we found increased p85α and FOXO3a protein expression as well as decreased cMYC, GLUT1, HK2, PKM2, and LDHA expression (Fig. 4c–j). Consistent with these expression regulations, metabolic profiling also revealed decreased glucose metabolites in both the xenograft pairs (Fig. 4k for flow diagram, Fig. 4l–o for graphs of each metabolite and Supplementary Table 4).
Fig. 4.
miR-155 promotes glucose metabolism through activation of p85α-FOXO3a-cMYC in vivo. a Growth curve of allografts (n = 6 for each group). miR-155+/ko cells (Lav670, red; Lav714, in Blue) or paired miRZIP155 cells (Lav670 miRZIP155, in green; Lav714 miRZIP155, in orange) were allografted and tumor growth was measured. b Pictures showing the size measurement of xenograft tumors (n = 5 for each group) that were generated in the panel (a). c Western blot images showing the level of GLUT1, HK2, PKM2, LDHA, cMYC, p85α and FOXO3a in allograft tumors. d–j Graphs showing the densitometry results of the panel (c). Normalized band intensity of GLUT1 (d), HK2 (e), PKM2 (f), LDHA (g), FOXO3a (h), p85α (i), and cMYC (j) are shown. k Flow diagram showing the results of LC-MS/MS analysis measuring glucose and its metabolite from miR-155ko/+ (in black) or paired miRZIP155 cells (in blue). The left panel shows data from Lav714 and the right panel is from Lav 670. l–o Graphs showing the level of glucose and its metabolites as well as NAD measured from the control (in blue) or miRZIp155 (in red) allograft tumors. Relative levels of glucose (l), glucose-6-phosphate (m), pyruvate (n), NAD (o) are shown
miR-155 is positively correlated with the elevated glucose usage in human TNBC samples
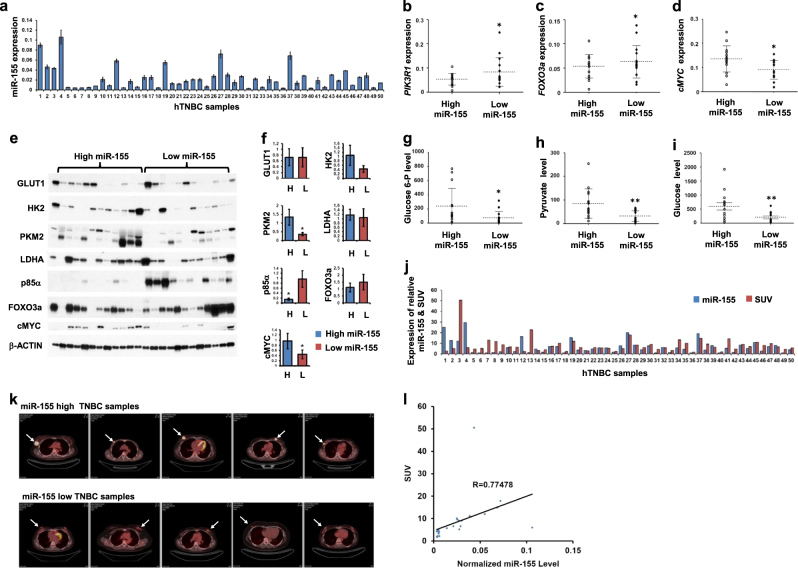
Next, we examined whether the miR-155 driven metabolic shift also occurs in human breast tumors (Clinical information summarized in Supplementary Table 6). Measurement of miR-155 (Fig. 5a) along with FOXO3a, PIK3R1, and cMYC mRNA expressions in 50 TNBC tumors revealed significant negative correlations between miR-155 and FOXO3a or PIK3R1 (Fig. 5b, c). In contrast, there was a positive correlation between miR-155 and cMYC expression (Fig. 5d), supporting the observations in cancer cells. These expression correlations are further confirmed by western blot analysis for a subset of breast tumors with miR-155 high or low, showing significant correlations for FOXO3a, cMYC and PKM2 (Fig. 5e, f, see discussion). In addition, the analysis of major metabolites in glucose metabolism including glucose, glucose-6-phosphate(G6P) and pyruvate also consistently showed a positive correlation to miR-155 levels (Fig. 5g–i, Supplementary 4e–g, Supplementary Table 5). Furthermore, we addressed whether miR-155 high tumors can uptake more glucose by checking the standard uptake value (SUV) score of the tumors (Fig. 5j), obtained from PET images (Fig. 5k as representative pictures). The results showed a significant, positive correlation between normalized SUV score (see methods) and miR-155 level (Fig. 5l) validating the results from cancer cells as well as in vivo models. Altogether, these data strongly demonstrate that miR-155 upregulation drives glucose metabolism in human breast tumors (Fig. 6).
Fig. 5.
miR-155 level is correlated with the activity of PIK3R1-FOXO3a-cMYC axis, glucose and its metabolites and SUV scores in human TNBC samples. a qRT-PCR results of miR-155 in 50 human TNBC samples. The MDA-MB-436 cell line was used as a cut-off control to divide the TNBC samples into miR-155 high or low groups. b–d qRT-PCR results of PIK3R1, FOXO3a, and cMYC gene in TNBC samples from miR-155 high or low groups. Normalized to human RpL13a level. Error bar means ± SEM (n = 3). *p < .0.05001. e, f Images of western blot analysis (e) and its quantitation (f) obtained form 24 human TNBC specimen with miR-155 high or miR-155 low expression. The protein expression of miR-155 dependent regulators including p85α, FOXO3a and cMYC as well as key enzymes in glucose metabolism including GLUT1, HK2, PKM2, and LDHA were examined. β-ACTIN was used as loading control. Graphs on the right shows densitometry results (f). g–i Relative glucose-6P (g), pyruvate (h) and glucose (i) levels in miR-155 high and low TNBC samples, measured by LC-MS/MS. *p < .0.05, **p < 0.01, p = 0.03392 (g), 0.008835 (h), and 0.0059 (i). j A graph showing the expression of relative miR-155 level and SUV score in 50 human TNBC samples. k Representative images of FDG-PET obtained from miR-155 high or low human TNBC samples. Arrows indicates the location of tumors. l Scattered plot showing a positive correlation between SUV score and normalized miR-155 level in 50 human TNBC samples. R = 0.77478
Fig. 6.
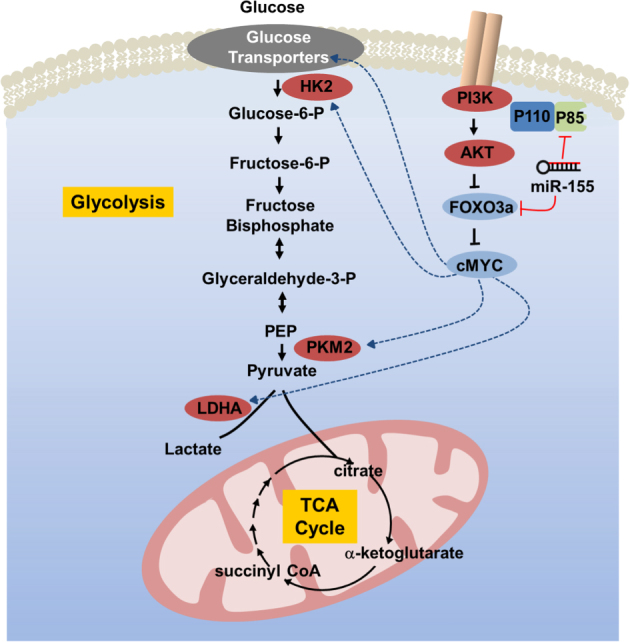
A graphical abstract showing a proposed mechanism of the miR-155-driven shift in glucose metabolism
Discussion
Our study described here provides a mechanistic insight for how the oncogenic miR-155 promotes tumor growth by activating glucose metabolism (a graphical summary in Fig. 5m). A previous report showed miR-155/143 controls HK2 via STAT3 or C/EBP beta [10], and a recent report also showed that miR-155 control HK2 expression in NSCLC [22]. Another study using knockout mice showed that the loss of miR-155 confers insulin resistance [23]. Our group also reported that miR-155 controls thiamine, a critical cofactor for energy metabolic enzymes [24]. Considering the miR-155 controls the expression of approximately 250 genes [25, 26], we reason that analyzing its physiological output, i.e., metabolism in this study, will enable us to understand its function better. As shown here, we were able to identify multiple metabolic enzymes and upstream regulators as targets of miR-155. Moreover, we showed the miR-155 can promote glucose usage in multiple breast cancer cells as well as human breast cancer specimen. Collectively, we have demonstrated that a metabolic profiling followed by mechanistic study is an effective way to dissect the complex biological functions of microRNA that have the potential to regulate the expression of hundreds of genes.
Our data provided here demonstrates a pivotal role of miR-155 in multiple steps of glucose metabolism. Of note, our finding showed the genes involved in glucose uptake and metabolism was reduced in miR-155 deficient cells. This data suggested an indirect regulation by miR-155 onto the genes, considering a repressive nature of miRNA-target gene regulation. Further study revealed that the regulation is primarily achieved by the cMYC, but the cMyc gene was not a direct target of miR-155 either because there was no miR-155 binding site in cMyc UTR. Therefore, we investigated how the cMYC is regulated by miR-155. As FOXO3a and PIK3R1 been reported as targets of miR-155 in human breast cancer cells [15] or B-cell lymphoma [21], we examined the possible mechanism by which PIK3R1 and FOXO3a can regulate the cMYC level. Therefore, our study shown here presents a typical bottom-up approach that reveals multiple layers of regulation by miR-155. Even though we demonstrated here PIK3R1-FOXO3a-cMYC as critical axis regulated by miR-155, the functional interactions among these players can be more complicated than linear pathway. Further study will tackle more network-based approach to clarify these relations. Importantly, because the cMYC is not only a known master regulator of glucose metabolism [27, 28], but also a regulator of glutamine metabolism [28]. Therefore, future study will also focus on the effect of miR-155 on glutamine metabolism in cancer.
Finally, we have demonstrated that our findings are valid not only in mouse model but also in human TNBC. Some of the target genes we identified in cancer cell study did not show significant correlations with miR-155 in tumor protein level (Fig. 5f). We think this is due to the heterogeneity in the tumor cell content in each specimen and differences of the sampling history. Despite of that, we could detect significant correlations between the FOXO3a, cMYC, and HK2 proteins with miR-155 level, supporting cellular and in vivo model data. Although the oncogenic role of miR-155 in human breast cancer has been reported [4, 29, 30], our study provides a more precise and novel function of miR-155 in terms of glucose metabolism. We expect other unknown functions of the miR-155 will be uncovered via more studies on the miR-155-deficient tumor models. Such studies will help us to fully understand this multifunctional, oncogenic microRNA.
Materials and methods
Cell isolation and culture
miR-155-deficient, breast cancer mouse model was generated by mating, as described previously [31]. Isolation and culture of miR-155ko/+ and miR-155ko/ko cells was performed as described [11] with minor modification. Human primary breast cancer cells obtained from patients with triple negative breast cancer (TNBC) (ASAN medical center, IRB No. 2013-0939) were previously described [24]. Depending on the level of miR-155, six of the primary cells were grouped as patient-derived cells (PDC) H1-H3 or L1-L3. 293TN, MCF7 and HeLa cells were cultured in DMEM supplemented with 10% FBS and 1% PS (Penicillin Streptomycin).
CellMask plasma membrane stain
To check cell density and morphology of murine mammary tumor cells with or without glucose restriction, the cells were washed and incubated with CellMask Green (1/1000 diluted, Invitrogen) for 15 min at room temperature (RT). The cells were rinsed twice with distilled water and then stained with DAPI for 5 min. After staining, the cells were fixed with 3.75% formaldehyde for 15 min and imaged using an inverted fluorescence microscope (Carl Zeiss AG, Oberkochen, Germany).
alamarBlue® cell viability and BrdU cell proliferation assay
To measure the cell proliferation and viability, the cell alamarBlue assay was performed as previously described [24]. FITC-BrdU kit (BD Pharmingen, San Diego, CA, USA) was also used to analyze cell cycle progression as previously described [24].
Annexin V assay
For apoptosis assay, mouse primary cancer cells were seeded onto a six-well plate and incubated overnight under high or low glucose condition. Apoptotic cells were measured by using FITC-Annexin V Apoptosis Detection Kit (BD Pharmingen) described by the manufacture. Briefly, cells were incubated with FITC-Annexin V in FACS staining buffer for 15 min. Stained cells were subjected to the CFlow software analyses using an AccuriFlow Cytometry (BD Biosciences).
LC-MS/MS analysis
A liquid chromatography-tandem mass spectrometry (LC-MS/MS) system was used to measure metabolites according to a previously described method [24].
OXPHOS measurements
Oxygen consumption rate (OCR) was detected using a Seahorse XF24 analyser (Seahorse Bioscience), per the manufacturer’s instructions. Briefly, miR-155+/KO or miR-155KO/KOcells were cultured to approximately 70–80% confluence in DMEM medium. Cells were seeded at 50,000 cells per well in an XF24 cell culture microplate and then incubated at 37 °C with 5% CO2 for 3 h. Before OCR detection, culture medium was changed, and the plate was incubated at 37 °C without CO2 for 1 h. Finally, the plate was transferred to the XF24 analyser. OCR was measured by sequential additions of oligomycin A (Sigma), FCCP (Sigma) and antimycin A (Sigma).
Quantitative RT-PCR (qRT-PCR)
Total RNA extraction was performed using TRizol (Invitrogen), by the manufacturer’s instruction. The primer sequences are shown in Supplementary Table 7. The mRNA expression levels of major glucose transporters (Glut1, 3, and 4), glycolysis enzymes (Hk2, Pkm2, and Ldha), as well as PIK3R1 and FOXO3a genes were measured according to a previously described method [24]. Relative expression value was normalized to RPL13a and calculated by using the 2-(ΔΔCt) method as previously described [32]. Quantitative measurement of miR-155 were performed by a previously described method [12]. The expression was normalized with small nuclear RNA U6 (RNU6).
Antibody and western blot analysis
Preparation of total cell lysates and Western blot analysis were performed as described previously [33]. A total of 10–50 µg of protein was used per lane. The blot was probed with anti-GLUT1 (1:500; Santa Cruz Biotechnology, Santa Cruz, CA, USA), anti-HK2 (1:1000, Cell Signaling Technology, Danvers, MA, USA), anti-PKM2 (1:1000, Cell Signaling), anti-LDHA (1:1000, Cell Signaling), anti-p85α (1:1000, Cell Signaling), anti-PI3 kinase p110α (1:1000, Cell Signaling), anti-PI3 kinase p110β (1:1000, Cell Signaling), anti-phospho-AKT (Ser473) (1:1000, Cell Signaling), anti-AKT (1:1000, Cell Signaling), anti-PDK1 (1:1000, Cell Signaling), anti-FOXO3a (1:1000, Cell Signaling), and anti-cMYC (1:1000, Cell Signaling) antibodies. The relative densities of bands were analyzed with NIH image J 1.47v software.
Knockdown of PIK3R1 and FOXO3a by siRNA
Small-interfering RNAs (siRNAs) that effectively inhibit mouse Pik3r1 and Foxo3a were purchased from Genolution Pharmaceuticals Inc (Genolution, Seoul, Republic of Korea). siRNA sequences of Pik3r1 and Foxo3a were as follows; Pik3r1, 5′- UUGUUGGCUCACAGUAGUGG-3′; Foxo3a, 5′-UGAUGAUCCAAGAGCUCUUGCC-3′. Primary mouse cancer cells were transfected with either 200 nmol/L of target siRNAs (Pik3r1 or Foxo3a) or scramble siRNA using lipofectamine 2000 (Invitrogen).
miR-155 knockdown and overexpression
Lentiviral vector system from SBI (Mountain View, CA, USA) was used for miR-155 inhibition, as previously described [12]. For the overexpression of miR-155, we performed two kinds of methods, using lentiviral vector encoding miR-155 (miRH155, SBI) and miR-155 mimic. The lentivirus (miRH155 or control) was produced as described above for miRZIP. Human primary breast cancer cells (PDCL1-L3) were infected with miRH155 lentiviral vectors for 24 h. For the miRNA overexpression, MCF7 cells were seeded in 24-well plates and 24 h post seeding, cells were transiently transfected with 30 nM of miR-155 mimic (or the corresponding scrambled miRNAs).
Reporter construction and luciferase assay
The 3′ UTR sequences from PIK3R1 and FOXO3a gene (NM_001077495, NM_181524 and NM_201559) were cloned and inserted into the pMIR-REPORTTM Luciferase vector (Applied Biosystems). Luciferase activity assay was performed as described previously [12].
Animal experiments
1 × 10⁶ miR-155ko/+ cells were infected with control or miRZIP155 lentiviruses and resuspended in 100 µl of PBS. The cells were then injected into the back of 6-week-old female NOD/SCID mice subcutaneously. Tumor growth was measured as described previously [24].
Human TNBC sample preparation and measurement of FDG uptake (SUV max)
Human TNBC samples were obtained from the Asan Medical Center (Seoul, Korea). Total RNAs were extracted using miRNeasy FFPE kit (Qiagen) using the manufacturer’s instructions. For western blot, tumor samples were homogenized in RIPA buffer. To measure the FDG uptake, patients were injected with 370–555 MBq (10–15 mCi) of FDG. A skull base-to-mid thigh PET/CT scan was performed at 60 min after intravenous administration of FDG. A volume of interest was placed on the primary tumor. The maximum standardized uptake value (SUV max) was normalized by the lean body mass. The SUV max was defined as the highest single maximum pixel value within the primary tumor.
Statistical analysis
Data are presented as standard error of mean (SEM). Statistical significance was determined by the two tailed Student’s T-test. p-value less than 0.05 was regarded as statistically significant.
Electronic supplementary material
Acknowledgements
We thank to Dr. Ahn, Sung Gwe (Department of Surgery, Gangnam Severance Hospital, Yonsei University College of Medicine) for valuable suggestions. The biospecimen and data used in this study was provided by Asan Bio-Resource Center, Korea Biobank Network (2014-3(72)). This work is supported by a grant from the Korean Health Technology R&D Project, Ministry of Health &Welfare (Grant number: HI13C1538) and by the National R&D Program for Cancer Control, Ministry of Health & Welfare (No.1320140), Republic of Korea.
Compliance with ethical standards
Conflict of interest
The authors declare that they have no competing interests.
Electronic supplementary material
The online version of this article (10.1038/s41388-018-0124-4) contains supplementary material, which is available to authorized users.
References
- 1.Calin GA, Croce CM. MicroRNA-cancer connection: the beginning of a new tale. Cancer Res. 2006;66:7390–4. doi: 10.1158/0008-5472.CAN-06-0800. [DOI] [PubMed] [Google Scholar]
- 2.Croce CM, Calin GA. miRNAs, cancer, and stem cell division. Cell. 2005;122:6–7. doi: 10.1016/j.cell.2005.06.036. [DOI] [PubMed] [Google Scholar]
- 3.Tili E, Croce CM, Michaille JJ. miR-155: on the crosstalk between inflammation and cancer. Int Rev Immunol. 2009;28:264–84. doi: 10.1080/08830180903093796. [DOI] [PubMed] [Google Scholar]
- 4.Wang J, Wu J. Role of miR-155 in breast cancer. Front Biosci. 2012;17:2350–5. doi: 10.2741/4056. [DOI] [PubMed] [Google Scholar]
- 5.Zhang B, Pan X, Cobb GP, Anderson TA. microRNAs as oncogenes and tumor suppressors. Dev Biol. 2007;302:1–12. doi: 10.1016/j.ydbio.2006.08.028. [DOI] [PubMed] [Google Scholar]
- 6.Brodersen P, Voinnet O. Revisiting the principles of microRNA target recognition and mode of action. Nat Rev Mol Cell Biol. 2009;10:141–8. doi: 10.1038/nrm2619. [DOI] [PubMed] [Google Scholar]
- 7.Lewis BP, Shih IH, Jones-Rhoades MW, Bartel DP, Burge CB. Prediction of mammalian microRNA targets. Cell. 2003;115:787–98. doi: 10.1016/S0092-8674(03)01018-3. [DOI] [PubMed] [Google Scholar]
- 8.Lewis BP, Burge CB, Bartel DP. Conserved seed pairing, often flanked by adenosines, indicates that thousands of human genes are microRNA targets. Cell. 2005;120:15–20. doi: 10.1016/j.cell.2004.12.035. [DOI] [PubMed] [Google Scholar]
- 9.Vander Heiden MG, Cantley LC, Thompson CB. Understanding the Warburg effect: the metabolic requirements of cell proliferation. Science. 2009;324:1029–33. doi: 10.1126/science.1160809. [DOI] [PMC free article] [PubMed] [Google Scholar]
- 10.Jiang S, Zhang LF, Zhang HW, Hu S, Lu MH, Liang S, et al. A novel miR-155/miR-143 cascade controls glycolysis by regulating hexokinase 2 in breast cancer cells. EMBO J. 2012;31:1985–98. doi: 10.1038/emboj.2012.45. [DOI] [PMC free article] [PubMed] [Google Scholar]
- 11.Chang S, Wang RH, Akagi K, Kim KA, Martin BK, Cavallone L, et al. Tumor suppressor BRCA1 epigenetically controls oncogenic microRNA-155. Nat Med. 2011;17:1275–82. doi: 10.1038/nm.2459. [DOI] [PMC free article] [PubMed] [Google Scholar]
- 12.Kim S, Song JH, Kim S, Qu P, Martin BK, Sehareen WS, et al. Loss of oncogenic miR-155 in tumor cells promotes tumor growth by enhancing C/EBP-beta-mediated MDSC infiltration. Oncotarget. 2016;7:11094–112. doi: 10.18632/oncotarget.7150. [DOI] [PMC free article] [PubMed] [Google Scholar]
- 13.Dang CV, Le A, Gao P. MYC-induced cancer cell energy metabolism and therapeutic opportunities. Clin Cancer Res. 2009;15:6479–83. doi: 10.1158/1078-0432.CCR-09-0889. [DOI] [PMC free article] [PubMed] [Google Scholar]
- 14.Dang CV. Therapeutic targeting of Myc-reprogrammed cancer cell metabolism. Cold Spring Harb Symp Quant Biol. 2011;76:369–74. doi: 10.1101/sqb.2011.76.011296. [DOI] [PubMed] [Google Scholar]
- 15.Kong W, He L, Coppola M, Guo J, Esposito NN, Coppola D, et al. MicroRNA-155 regulates cell survival, growth, and chemosensitivity by targeting FOXO3a in breast cancer. J Biol Chem. 2010;285:17869–79. doi: 10.1074/jbc.M110.101055. [DOI] [PMC free article] [PubMed] [Google Scholar] [Retracted]
- 16.Ferber EC, Peck B, Delpuech O, Bell GP, East P, Schulze A. FOXO3a regulates reactive oxygen metabolism by inhibiting mitochondrial gene expression. Cell Death Differ. 2012;19:968–79. doi: 10.1038/cdd.2011.179. [DOI] [PMC free article] [PubMed] [Google Scholar]
- 17.Huang H, Tindall DJ. Regulation of FOXO protein stability via ubiquitination and proteasome degradation. Biochim Biophys Acta. 2011;1813:1961–4. doi: 10.1016/j.bbamcr.2011.01.007. [DOI] [PMC free article] [PubMed] [Google Scholar]
- 18.Tzivion G, Dobson M, Ramakrishnan G. FoxO transcription factors; regulation by AKT and 14-3-3 proteins. Biochim Biophys Acta. 2011;1813:1938–45. doi: 10.1016/j.bbamcr.2011.06.002. [DOI] [PubMed] [Google Scholar]
- 19.Geltz NR, Augustine JA. The p85 and p110 subunits of phosphatidylinositol 3-kinase-alpha are substrates, in vitro, for a constitutively associated protein tyrosine kinase in platelets. Blood. 1998;91:930–9. [PubMed] [Google Scholar]
- 20.Terauchi Y, Tsuji Y, Satoh S, Minoura H, Murakami K, Okuno A, et al. Increased insulin sensitivity and hypoglycaemia in mice lacking the p85 alpha subunit of phosphoinositide 3-kinase. Nat Genet. 1999;21:230–5. doi: 10.1038/6023. [DOI] [PubMed] [Google Scholar]
- 21.Huang X, Shen Y, Liu M, Bi C, Jiang C, Iqbal J, et al. Quantitative proteomics reveals that miR-155 regulates the PI3K-AKT pathway in diffuse large B-cell lymphoma. Am J Pathol. 2012;181:26–33. doi: 10.1016/j.ajpath.2012.03.013. [DOI] [PMC free article] [PubMed] [Google Scholar]
- 22.Lv X, Yao L, Zhang J, Han P, Li C. Inhibition of microRNA-155 sensitizes lung cancer cells to irradiation via suppression of HK2-modulated glucose metabolism. Mol Med Rep. 2016;14:1332–8. doi: 10.3892/mmr.2016.5394. [DOI] [PubMed] [Google Scholar]
- 23.Lin X, Qin Y, Jia J, Lin T, Lin X, Chen L, et al. MiR-155 enhances insulin sensitivity by coordinated regulation of multiple genes in mice. PLoS Genet. 2016;12:e1006308. doi: 10.1371/journal.pgen.1006308. [DOI] [PMC free article] [PubMed] [Google Scholar]
- 24.Kim S, Rhee JK, Yoo HJ, Lee HJ, Lee EJ, Lee JW, et al. Bioinformatic and metabolomic analysis reveals miR-155 regulates thiamine level in breast cancer. Cancer Lett. 2015;357:488–97. doi: 10.1016/j.canlet.2014.11.058. [DOI] [PMC free article] [PubMed] [Google Scholar]
- 25.Faraoni I, Antonetti FR, Cardone J, Bonmassar E. miR-155 gene: a typical multifunctional microRNA. Biochim Et Biophys Acta. 2009;1792:497–505. doi: 10.1016/j.bbadis.2009.02.013. [DOI] [PubMed] [Google Scholar]
- 26.Loeb GB, Khan AA, Canner D, Hiatt JB, Shendure J, Darnell RB, et al. Transcriptome-wide miR-155 binding map reveals widespread noncanonical microRNA targeting. Mol Cell. 2012;48:760–70. doi: 10.1016/j.molcel.2012.10.002. [DOI] [PMC free article] [PubMed] [Google Scholar]
- 27.Dang CV. The interplay between MYC and HIF in the Warburg effect. Ernst Schering Found Symp Proc. 2007;4:35–53. doi: 10.1007/2789_2008_088. [DOI] [PubMed] [Google Scholar]
- 28.Dang CV. MYC on the path to cancer. Cell. 2012;149:22–35. doi: 10.1016/j.cell.2012.03.003. [DOI] [PMC free article] [PubMed] [Google Scholar]
- 29.Esquela-Kerscher A, Slack FJ. Oncomirs—microRNAs with a role in cancer. Nat Rev Cancer. 2006;6:259–69. doi: 10.1038/nrc1840. [DOI] [PubMed] [Google Scholar]
- 30.Mattiske S, Suetani RJ, Neilsen PM, Callen DF. The oncogenic role of miR-155 in breast cancer. Cancer epidemiology, biomarkers & prevention: a publication of the American Association for Cancer Research, cosponsored by the American Society of Preventive. Oncology. 2012;21:1236–43. doi: 10.1158/1055-9965.EPI-12-0173. [DOI] [PubMed] [Google Scholar]
- 31.Liu X, Holstege H, van der Gulden H, Treur-Mulder M, Zevenhoven J, Velds A, et al. Somatic loss of BRCA1 and p53 in mice induces mammary tumors with features of human BRCA1-mutated basal-like breast cancer. Proc Natl Acad Sci USA. 2007;104:12111–6. doi: 10.1073/pnas.0702969104. [DOI] [PMC free article] [PubMed] [Google Scholar]
- 32.Livak KJ, Schmittgen TD. Analysis of relative gene expression data using real-time quantitative PCR and the 2(-Delta Delta C(T)) method. Methods. 2001;25:402–8. doi: 10.1006/meth.2001.1262. [DOI] [PubMed] [Google Scholar]
- 33.Chang S, Biswas K, Martin BK, Stauffer S, Sharan SK. Expression of human BRCA1 variants in mouse ES cells allows functional analysis of BRCA1 mutations. J Clin Invest. 2009;119:3160–71. doi: 10.1172/JCI39836. [DOI] [PMC free article] [PubMed] [Google Scholar]
Associated Data
This section collects any data citations, data availability statements, or supplementary materials included in this article.


