Abstract
Suppressor of cytokine signaling 3 (SOCS-3) is a negative feedback regulator of IFN-γ signaling, shown up-regulated in mouse bone marrow cells by the proinflammatory cytokines interleukin-1β (IL-1β), tumor necrosis factor-α (TNF-α), and IFN-γ. IL-1β and IFN-γ alone, or potentiated by TNF-α, are cytotoxic to the insulin producing pancreatic β-cells and β-cell lines in vitro and suggested to contribute to the specific β-cell destruction in Type-1 diabetes mellitus (T1DM). Using a doxycycline-inducible SOCS-3 expression system in the rat β-cell line INS-1, we demonstrate that the toxic effect of both IL-1β or IFN-γ at concentrations that reduced the viability by 50% over 3 days, was fully preventable when SOCS-3 expression was turned on in the cells. At cytokine concentrations or combinations more toxic to the cells, SOCS-3 overexpression yielded a partial protection. Whereas SOCS-3-mediated inhibition of IFN-γ signaling is described in other cell systems, SOCS-3 mediated inhibition of IL-1β signaling has not previously been described. In addition we show that SOCS-3 prevention of IL-1β-induced toxicity is accompanied by inhibited transcription of the inducible nitric oxide synthase (iNOS) by 80%, resulting in 60% decreased formation of the toxic nitric oxide (NO). Analysis of isolated native rat islets exposed to IL-1β revealed a naturally occurring but delayed up-regulated SOCS-3 transcription. Influencing SOCS-3 expression thus represents an approach for affecting cytokine-induced signal transduction at a proximal step in the signal cascade, potentially useful in future therapies aimed at reducing the destructive potential of β-cell cytotoxic cytokines in T1DM, as well as other cytokine-dependent diseases.
Interleukin-1β (IL-1β) is specifically cytotoxic for the pancreatic β- but not α-cells in the islets of Langerhans (1–3), associating cytokines with the specific β-cell depletion seen in insulin dependent type 1 diabetes mellitus (T1DM). IL-1β-induced β-cell production of nitric oxide (NO) and oxygen free radicals is toxic and potentiated by two other proinflammatory cytokines, tumor necrosis factor-α (TNF-α) and IFN-γ (4, 5). NO-independent β-cell destruction also exists [e.g., IFN-γ-associated toxicity of human islets (6) and cultured β-cell lines (7)]. Although the mechanism behind this toxicity is not known, activation of caspases like the pro-caspase interleukin-1 converting enzyme (ICE or caspase-1) may be involved (7). The importance of these cytokines and their synergistic interaction in T1DM is supported by several studies in animal models of T1DM (reviewed in refs. 8 and 9).
Suppressors of cytokine signaling (SOCS) is a newly identified family of intracellular proteins controlling the magnitude and/or duration of signals propagated by diverse cytokine receptors by suppressing their signal transduction process (reviewed in ref. 10). Because their expression is induced by the same cytokine/receptor-mediated signal transduction that they subsequently inhibit, the SOCS proteins represent an intracellular negative feedback loop in cytokine signaling.
SOCS-1 and SOCS-3 have been demonstrated to inhibit signaling induced by IFN-γ by intervening at the proximal step in the signal cascade, inhibiting the JAK kinase-mediated phosphorylation and homodimerization of STAT, necessary for its translocation to the nucleus and interaction with gamma-activated sites (GAS) in the promoter region of target genes (reviewed in ref. 10). Studies in mouse bone marrow cells showed that only SOCS-1 was up-regulated by IFN-γ, whereas IL-1β and TNF-α also up-regulated SOCS-3 (11).
SOCS-3 is therefore an attractive candidate for an intercellular negative feedback mechanism that regulates cytokine action and thus the cellular fate after cytokine exposure (e.g., influence metabolism, proliferation, and apoptosis). The aim of the present work was therefore to investigate the potential role of SOCS-3 expression in protection of β-cells against the toxic effects of cytokines.
Materials and Methods
Cytokines.
The cytokines used were recombinant human IL-1β (4 × 10⁵ units/μg; Novo Nordisk, Bagsværd, Denmark), recombinant rat IFN-γ (Genzyme), and recombinant human TNFα (9 × 10⁴ units/mg; Genzyme).
Establishment of INS-r3#2 Clone.
Rat INS-1 β-cells stably transfected with the reverse tetracycline-dependent transactivator [INS-r3 cells (12)] were kindly supplied by P. B. Iynedjian, Devision de Biochimie Clinique et de Diabétologie Expérimentale, Centre Médical Universitaire, Geneva, Switzerland. Murine SOCS-3 cDNA was inserted downstream of the tetracycline operator-cytomegalovirus minimal promoter in the pTRE response plasmid and used for cotransfection of the INS-r3 cells with pTK-hygro using LipofectAmine Plus. Following selection in 200 μg/ml hygromycin B (Calbiochem), SOCS-3-expressing clones were identified by reverse transcription (RT)-PCR. The clone used in this study was named INS-r3#2.
Islet and Cell Culture.
Islets from 3–6-day-old Wistar Furth rats (Charles River Germany, Sulzfeldt) were isolated and cultured as described (13, 14). INS-1 and INS-r3#2 cells were cultured in RPMI 1640 medium with Glutamax-I (GIBCO/BRL Life Technologies), supplemented with 10% TeT System Approved FBS (CLONTECH), selected for low tetracycline content, and supplemented with penicillin, streptomycin (GIBCO/BRL), and 50 μM β-mercaptoethanol (Sigma) under standard cell culture conditions (15, 16). In addition, the media for the INS-r3#2 cells contained 100 μg/ml hygromycin and 100 μg/ml geneticin (GIBCO/BRL Life Technologies).
RNA Isolation and Semiquantitative RT-PCR.
Total RNA from the islets was extracted by a modification of the 8 mol/l guanidine method (15) and from the INS cells by the RNAzol method (RNAzol, Campro Scientific, Veenendaal, The Netherlands; ref. 16). Oligo(dT) primed cDNA was prepared from total RNA (Invitrogen cDNA cycle Kit; ref. 17) and semiquantitative RT-PCR performed and quantified by using a PhosphoImager (Molecular Dynamics; ref. 18). Contamination with genomic DNA was not observed. The internal standard TATA-binding protein (TBP) was included for normalization in each amplification (7). Because of the low expression level of ICE mRNA in the INS-r3#2, not allowing linear amplification of TBP, these analyses were based on identical cDNA volumes shown in other experiments to contain comparable levels of the housekeeping gene. The primers used were: SOCS-3, forward 5′-GGG CCC CTT CCT TTT CTT TAC, reverse 5′-GTC CAG GAA CTC CCG AAT G; iNOS, forward 5′-CAG CAA TGG GCA GAC TCT, reverse 5′-CAC AGG CTG CCC CCG GAA GGT TTG; ICE, forward 5′-AAG TTG CTG CTG GAG GAT CT, reverse 5′-GTC CCA CAT ATT CCC TCC TG; TBP, forward 5′-ACC CTT CAC CAA TGA CTC CTA TG, reverse 5′-ATG ATG ACT GCA GCA AAT CGC.
RNase Protection.
RNA was isolated from INS-r3#2 cells, grown in the presence or absence of doxycycline for 24 h, using the RNAeasy-kit from Qiagen. The 32P-labeled antisense 364-bp SOCS-3 probe and the cyclophilin control probe was in vitro transcribed with T7 RNA polymerase and [α-32P]UTP, using the Riboprobe In Vitro Transcription System (Promega). The RNase protection assay was carried out by using the RPA III kit (Ambion, Austin, TX) as described (19). Bands corresponding to probe fragments protected by hybridization to SOCS-3/cyclophillin transcripts were quantified by PhosphoImager analysis and the intensity of each SOCS-3 band normalized to the corresponding cyclophilin band.
Western Blot.
Cells were cultured in 10-cm dishes for 2 days. Medium was changed to include the indicated concentrations of doxycycline (Sigma). The next day, cell lysates were subjected to SDS-polyacrylamide gel electrophoresis and Western blotting as described (20).
Nuclear Extracts and Electrophoretic Mobility-Shift Assay (EMSA).
Cells were cultured in 10-cm dishes for 2 days in complete medium. The medium was changed to RPMI 1640 medium containing 0.5% FCS with or without 1 μg/ml doxycycline. After 20 h the cells were incubated with or without 200 units/ml IFN-γ for 15 min. Nuclear extracts were prepared and EMSA was carried out as described (20). For detection of STAT-1 and -3 binding, a double-stranded oligo M67 was used: agctTCATTTCCCGTAAATCCCTA. In supershift experiments, nuclear extracts were preincubated with STAT-1 or -3 antibodies for 30 min at 4°C.
iNOS Promoter Assay.
The rat iNOS promoter region (−1748 to + 84) was subcloned into the pGL3 enhancer vector for promoter analysis by using the Dual-Luciferase Reporter Assay System (Promega) cotransfected with equimolar concentration of the pRL-TK vector (constitutive expression driven by the herpes simplex virus thymidine kinase promoter) used to correct for transfection efficiency according the manufacturer's instructions. INS-1 or INS-r3#2 clones were seeded in 12-well tissue culture plates (Costar) at a density of 5 × 10⁵ cells per well 2 days before transfection performed with 2 μl Superfect Transfection Reagent (Qiagen) as described by the manufacturer. After 2 h the cells were washed once with culture medium and culture continued in 1 ml of culture media with or without 0.5 μg/ml doxycycline for 24 h, when 1 ml of culture medium containing IL-1β at different concentrations was added to each well. After culturing for a further 24 h, luciferase activities were assayed by using a TD-20/20 Luminometer (Turner, Sunnyvale, CA) and iNOS promoter activity normalized against the pRL-TK promoter activity.
Viability Assay.
One day before cytokine exposure, 104 INS-1 or INSr3#2 cells were set up in 96-well tissue-culture plates (Costar). After 3 days of additional culturing the proportion of viable cells in control vs. cytokine-containing wells was determined based on the 3-(4,5-dimethylthiazol-2-yl)-2,5-diphenyl-tetrazolium bromide (MTT) assay (Promega) as described (16), measuring the conversion of an MTT tetrazolium salt to a colored formazan product by the mitochondrial enzyme succinate dehydrogenase (21, 22).
NO Measurement.
NO was measured as accumulated nitrite in the medium by mixing 100 μl with 100 μl of Griess reagents (23). The absorbance was measured at 540 nm and nitrite concentration calculated from a NaNO2 standard curve.
Apoptosis.
INS-1 or INSr3#2 cells (2.5 × 10⁵ per well) were seeded into 24-well tissue-culture plates (Nunc) in 1.5 ml of culture medium containing 10% FCS. After 24 h of culture the medium was changed to medium containing 0.5% FCS and doxycycline (1 μg/ml) or vehicle and the cells were cultured for an additional 18 h before cytokine stimulation. After 24 h of cytokine stimulation early apoptosis was measured on a FACScan (Becton Dickinson), using the FACS AnnexinV-FITC assay as described by the manufacturer (R & D Systems).
Statistical Analysis.
Results are presented as means ± SD. ANOVA and two-tailed t tests were used for statistical analyses.
Results
Establishment of a SOCS-3-Overexpressing β-Cell Clone.
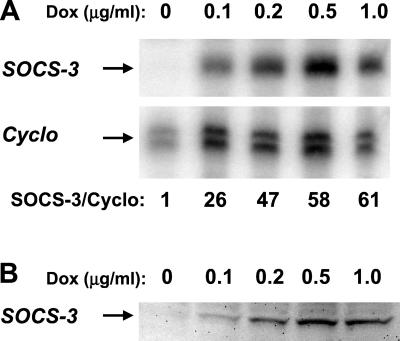
To investigate the effect of SOCS-3 on the cytokine response of β-cells, the β-cell clone, INS-r3, stably expressing the reverse tetracycline-dependent transactivator (24) was used. Following stable transfection with the pTRE response plasmid containing SOCS-3 cDNA downstream of a tetracycline operator–cytomegalovirus minimal promoter, the INS-r3#2 clone was obtained and used for these analyses. Fig. 1 demonstrates the inducible SOCS-3 mRNA expression in INS-r3#2 cells (A), determined by RNase protection assay, and protein expression (B), determined by Western blotting, following a 24 h culture with different concentrations of doxycycline. Cyclophilin was included as an internal control in the RNase protection assay, and the SOCS-3/cyclophilin mRNA ratio reached peak levels with an ≈60-fold induction in response to 0.5–1 μg/ml doxycycline, which also induced the maximal expression of the SOCS-3 protein, barely detectable in the absence of doxycycline (B). Semiquantitative reverse transcription (RT)-PCR analysis measuring SOCS-3 steady-state mRNA level as percent of the internal control TBP revealed the same magnitude of doxycycline-induced SOCS-3 mRNA expression as detected in the RNase protection assay. Approximately 5% SOCS-3 mRNA was detectable in the absence of induced SOCS-3 expression, which after exposure to 0.5 μg/ml doxycycline was increased to about 50% and 200% after 1 or 24 h, respectively.
Figure 1.
Inducible SOCS-3 expression in the INS-r3#2 clone. A clear induction of SOCS-3 mRNA measured by RNase protection assay was induced by increasing concentrations of doxycycline (A), with a maximal induction, relative to the internal standard cyclophilin (Cyclo), obtained at 0.5–1 μg/ml doxycycline. The induced mRNA correlated well with the induced SOCS-3 protein measured by Western blot (B).
SOCS-3 Overexpression Prevents Cytokine-Impaired β-Cell Viability.
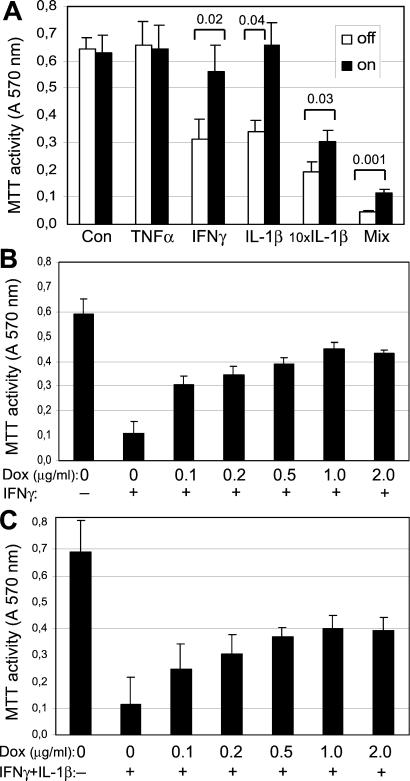
The viability of the INS-r3#2 cells exposed to IL-1β (150 pg/ml) or IFN-γ (200 units/ml) for 72 h was significantly reduced by ≈50% compared with the control condition (P < 0.003; Fig. 2A). No effect was observed for TNF-α (200 units/ml). The toxic effect of both IL-1β and IFN-γ at these concentrations was fully prevented when SOCS-3 was induced by 0.5 μg/ml doxycycline. SOCS-3 expression per se did not influence the viability of the INS-r3#2 cells as seen from the control conditions, and parallel control experiments performed on the parental INS-1 cell line demonstrated that doxycycline by itself did not influence the cytokine-induced toxicity (data not shown). A highly toxic effect was seen when the INS-r3#2 cells were exposed to a 10× higher concentration of IL-1β (1500 pg/ml) or to a mixture of all three cytokines. Whereas induced SOCS-3 expression was not sufficient to fully protect the cells under these strongly toxic conditions, it still significantly reduced the toxicity. Dose-response analyses revealed that the protective effect of SOCS-3 on toxicity induced by IFN-γ alone (Fig. 2B) or in combination with IL-1β (Fig. 2C) was inducible by low concentrations of doxycycline, with a maximal protective effect obtained at ≈0.5–1 μg/ml (ANOVA, P = 0.0001 in both cases), corresponding to the maximal induction of the SOCS-3 protein (Fig. 1B). Inducing SOCS-3 expression with 1 μg/ml doxycycline and exposing the cells to IL-1β concentrations titrated between the two IL-1β concentrations in Fig. 2A confirmed that the protective effect of SOCS-3 decreased with increasing IL-1b concentrations, yielding more that 50% decrease in viability over 3 days (data not shown).
Figure 2.
Effect of recombinant SOCS-3 expression on cytokine-mediated β-cell impairment. Viability was determined by the MTT assay in INS-r3#2 cells cultured in the absence or presence of cytokines for 3 days, with or without 0.5 μg/ml doxycycline-induced SOCS-3 expression, starting 1 day before exposure to the cytokines. (A) The cells were exposed to TNF-α (200 units/ml), IFN-γ (200 units/ml), IL-1β (150 pg/ml), 10× IL-1β (1500 pg/ml), or the mix of all three cytokines (200 units/ml, 200 units/ml, and 150 pg/ml, respectively). The INS-r3#2 cells were exposed to IFN-γ (B; 200 units/ml, n = 3) and to IFN-γ + IL-1β (C; 200 units/ml and 150 pg/ml, respectively, n = 5), in the presence of increasing concentrations of doxycycline. Data are mean values ± SD. Significant P values are indicated in A and in Results.
SOCS-3 Overexpression Reduces Cytokine-Induced Apoptosis.
To further address the protective effect of SOCS-3 on cytokine-induced β-cell viability, early apoptosis was assessed. Following 18 h preincubation with or without 1 μg/ml doxycycline to induce SOCS-3 expression, the cells were cultured for a further 24 h in the absence or presence of IFN-γ or IL-1β alone or together. The appearance of markers of early apoptosis was determined based on the ability of AnnexinV to bind the cell's inner phospholipids (e.g., phosphatidylserine) when exposed to the exterior, an early event in apoptosis. The mean percentage of AnnexinV positive cells was determined from three to four separate experiments. First, doxycycline by itself did not influence the frequency of apoptotic cells in the absence of cytokines (13% ± 4% vs. 12% ± 5% apoptotic cells, in culture without or with doxycycline, respectively). IFN-γ alone increased the percentage of early apoptotic cells, which was maintained at the control level when SOCS-3 was induced (27% ± 7%, vs. 14% ± 4%, P < 0.05). Exposure of the cells to IL-1β for 24 h did not induce a statistically significant increase in apoptosis by itself (19% ± 6% vs. 15% ± 3%); however, it did potentiate the toxic effect of IFN-γ, resulting in a rapid increase in the early apoptosis marker, which was also prevented by induced SOCS-3 expression (58% ± 9%, vs. 16% ± 4%, P < 0.01).
SOCS-3 Overexpression Reduces IL-1β-Induced NO Production.
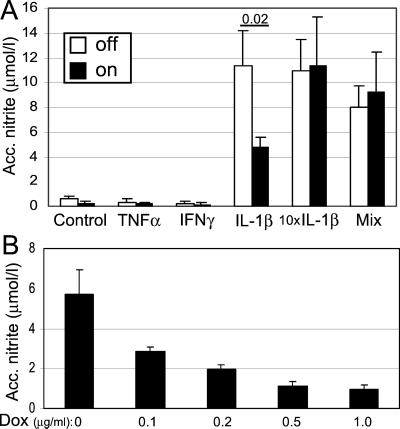
Exposure to IL-1β alone or in combination with IFN-γ and TNF-α for 72 h resulted in clear induction of NO (Fig. 3A). NO induced by 150 pg/ml IL-1β was significantly inhibited by induced SOCS-3 expression, which correlates well with the protective effect of SOCS-3 on IL-1β-induced toxicity (Fig. 2A). Induced SOCS-3 expression did not prevent NO production in response to a 10-fold higher concentration of IL-1β (1500 pg/ml) or to the combination of the cytokines. Under these highly toxic conditions (Fig. 2A) the majority of the accumulated NO is produced during the first 24 h, before the cells die, in contrast to the cells exposed to the less toxic concentration of IL-1β (150 pg/ml), where nitrite is accumulated over the entire period. Fig. 3B shows the dose-dependent inhibitory effect of SOCS-3 on NO production after 24 h exposure to 150 pg/ml IL-1β (ANOVA, P ≤ 0.0001). IFN-γ-induced toxicity (Fig. 2A) was not associated with a measurable NO production (Fig. 3A)
Figure 3.
Effect of recombinant SOCS-3 expression on cytokine-induced NO production in INS-r3#2 cells. NO production (measured as accumulated nitrite; A) was determined from the same experimental conditions detailed in Fig. 2A. (B) A dose-dependent reduction of NO production in response to increasing doxycycline concentration is shown for the INS-r3#2 cells exposed to IL-1β (150 pg/ml) for 3 days. Data are mean values ± SD of three separate experiments. Significant P values are indicated in A.
SOCS-3 Overexpression Reduces IL-1β-Induced iNOS Promoter Activity.
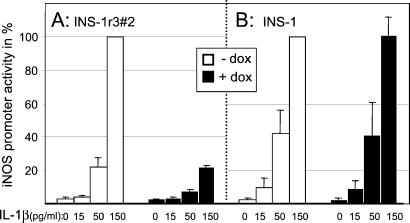
IL-1β-induced iNOS promoter activity of INS-r3#2 cells exposed for 24 h to different concentrations of IL-1β in the absence or presence of SOCS-3 expression was determined. As shown in Fig. 4, a dose-dependent IL-1β-induced iNOS promoter activity was observed, which was significantly inhibited in SOCS-3-expressing cells (150 pg/ml IL-1β: 100% vs. 22% ± 1%, P < 0.01 in the absence or presence of induced SOCS-3 expression, respectively. 50 pg/ml IL-1β: 22% ± 5% vs. 8% ± 1%, P < 0.05), suggesting a direct inhibition of IL-1β signaling. The control experiment in Fig. 4B shows that doxycycline did not influence the IL-1β-induced promoter activity induced in the parental INS-1 cell-line.
Figure 4.
Effect of recombinant SOCS-3 expression on IL-1β-induced iNOS promoter activity. Following transfection with an iNOS promoter construct, promoter activity was measured in INS-r3#2 cells (A) or the parental INS-1 cells (B) exposed to increasing concentrations of IL-1β in the absence (white bars) or presence (black bars) of doxycyclin. INOS promoter activity induced by 150 pg/ml IL-1β in the absence of doxycycline is set to 100% for both cell lines. Data are mean ± SD for n = 3.
SOCS-3 Overexpression Inhibits STAT-1 Signaling in INS-r3#2 Cells.
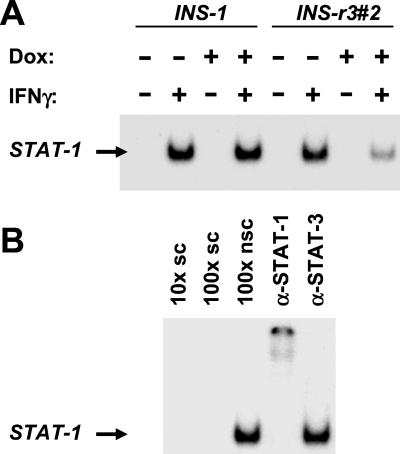
The biological activity of the recombinant SOCS-3 is evident from electrophoretic mobility-shift assay (EMSA) on nuclear extracts from the INS-r3#2 cells. A 15-min exposure to 200 units/ml IFN-γ induced a clear STAT-1 activation in both the INS-r3#2 and INS-1 cells, which was inhibited only in the INS-r3#2 cells with SOCS-3 expression induced by 1 μg/ml doxycycline (Fig. 5A). STAT activation was competed by a nonlabeled specific oligo nucleotide, but not by an unrelated oligo nucleotide (binding another transcription factor, CREB; Fig. 5B). The STAT probe used for these analyses may bind both STAT-1 and -3; however, the specific STAT-1 activation in response to IFN-γ was demonstrated by the ability of only the STAT-1 and not the STAT-3 antibody to supershift the band (Fig. 5B). Even though IFN-γ alone does not induce significant NO production, it potentates IL-1β-induced iNOS transcription through binding to the STAT-binding GAS site in the iNOS promoter (25). Consistent with this concept, iNOS mRNA expression revealed a small increase in IFN-γ-mediated steady-state iNOS mRNA level, which was significantly inhibited by SOCS-3 expression (0.22- ± 0.09-fold, P < 0.003, n = 6). We have previously shown that IFN-γ induces ICE transcription in rat and human islets, and speculated that ICE expression may be part of the NO-independent β-cell destruction (7) described for human islets and β-cell lines (6, 7). Because IFN-γ-activated ICE transcription is mediated through STAT-1/GAS interaction, we tested whether SOCS-3 may influence this. Indeed, induced SOCS-3 expression prevented the increase in steady-state ICE mRNA expression induced in the IFN-γ-exposed INS-r3#2. Whereas a clear ICE mRNA expression was detectable after 30 PCR cycles in five of five analyses, it was barely detectable in four of five experiments when SOCS-3 was induced (22,171 ± 17,322 vs. 4398 ± 2676, P = 0.05).
Figure 5.
SOCS-3 inhibited IFN-γ phosphorylation-dependent activation of STAT-1 signaling. EMSA of nuclear extracts demonstrated activation of STAT-1 following IFN-γ exposure of both the parental INS-1 cell line and the INS-r3#2 clone (A), which was clearly inhibited when SOCS-3 was induced by 1 μg/ml doxycycline in the INS-r3#2 clone. STAT-1 specificity of the activated STAT is evident from supershifting only by the STAT-1 specific antibody (B). In addition, only a competition with a specific oligo (sc) and not with a nonspecific oligo (nsc) was detected.
Cytokine-Induced SOCS-3 mRNA Expression in Rat Islets.
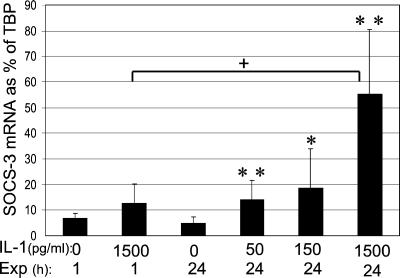
SOCS-3 may be induced by both IL-1β and IFN-γ and may feedback inhibit IFN-γ-mediated signaling through the JAK/STAT-1 pathway as demonstrated in other cell systems (10); however, interaction with the IL-1β-mediated signal transduction, primarily mediated through the Ras–Raf–MAPK pathway (5, 8), has not been described. To explore whether SOCS-3 might be a component in the native islet defense system against the toxic effect of IFN-γ and IL-1β, isolated pancreatic rat islets were exposed for 1 or 24 h to IL-1β or IFN-γ. The level of SOCS-3 mRNA steady state expression as percent of the internal standard TBP was the same as for the INS-r3#2 cells (around 5%). In response to IL-1β a statistically significant and dose-dependent induction of SOCS-3 mRNA expression was observed after a 24-h IL-1β exposure (ANOVA P = 0.001, Fig. 6), whereas after 1 h only a statistically nonsignificant trend (P = 0.12, n = 5) was detectable in response to the highest IL-1β (1500 pg/ml). Expressed relative to TBP, the steady-state level of SOCS-3 mRNA in rat islets exposed to 1500 pg/ml IL-1 was ≈¼ of that induced in the INS-r3#2 cells exposed to 0.5 μg/ml doxycycline for 24 h.
Figure 6.
SOCS-3 mRNA expression in rat islets exposed to IL-1β. Rat islets were exposed to different concentrations of IL-1β for 1 or 24 h and semiquantitative analysis of SOCS-3 mRNA expression relative to the internal standard TBP was performed. Data are mean ± SD of n = 5–10 separate experiments. *, P ≤ 0.01 and **, P ≤ 0.001 compared with control at 24 h, and +, P ≤ 0.001 between 1 and 24 h exposure to 1500 pg/ml IL-1β.
Exposure for 1 h to IFN-γ (200 units/ml) resulted in a small, but statistically significant, increase in SOCS-3 mRNA expression vs. control islets, expressed at percent of TBP (10.72% ± 2.21% vs. 6.72% ± 1.84% of TBP, n = 5, P ≤ 0.01), whereas no induced expression vs. control islets was observed after a 24-h exposure (6.28% ± 3.74% vs. 4.86% ± 1.86%, respectively).
Discussion
Several mechanisms may regulate the β-cell response to cytokines, including antagonists such as specific binding proteins and soluble receptors, other cytokines, growth factors, and hormones (26, 27). In contrast, the SOCS system represents an intracellular, fast-acting, regulated, negative feedback system for cytokine signaling. Our finding that up-regulated SOCS-3 expression inhibited subsequent signaling through both the IFN-γ and IL-1β receptors was unexpected, because previous publications have only described inhibition through the IFN-γ-mediated JAK/STAT signaling pathway (10, 28, 29). It is conceivable that SOCS-3 inhibition of IL-1β signaling might be targeted to key components of the MAPK/Ras pathways. However, evidence is accumulating of interdependence between the two signaling pathways (reviewed in ref. 30). Evidence for SOCS-3 interaction with JAK independent pathways is appearing [e.g., as an insulin-induced negative regulator of insulin signaling in 3T3-L1 adipocytes (31)]. Here insulin-induced SOCS-3 apparently competes with STAT-5A for binding to the same insulin receptor motif. SOCS-3 may also bind directly to the GH receptor (32) and to the cytoplasmic domain of the activated insulin-like growth factor 1 (IGF-1) receptor (33). Because insulin and IGF-1 reverse IL-1β-mediated inhibition of insulin secretion and induction of iNOS and apoptosis in β-cells (34, 35), this option should be explored.
Our finding that exposure of rat islets to either IFN-γ or IL-1β was associated with induction of SOCS-3 mRNA expression is in line with the previous results in bone marrow cells (11) and with recent array-based analysis of IL-1β-induced gene transcription of rat insulinoma cells (36). Our data suggest that IFN-γ induces a rapid and transient up-regulation of SOCS-3 mRNA expression, similar to previous studies in hepatocytes showing SOCS-3 expression after a 20-min IL-6 exposure, declining to basal levels within 8 h (11) and 30 min after GH and IL-1β exposure peaking at 1 h (37). The rapid decline may reflect the negative feedback of induced SOCS-3 in these systems. In contrast, our data suggest that induction of SOCS-3 transcription in IL-1β exposed rat islets is delayed but persistent at 24 h. This is consistent with a recent study that showed SOCS-3 expression for as along as 10 days in liver and spleen after burn injury (38). The delayed feedback response could, in part, explain why IL-1β is the main toxic cytokine on rat islets.
Induction of SOCS-3 expression has been associated with cross talk between different cytokines (e.g., the negative cross talk occurring in B-lymphocytes) where IL-3 inhibition of IL-11 expression was mediated through SOCS-3 inhibition of JAK/STAT signaling (39). A similar SOCS-3-dependent mechanism might be responsible for the recently demonstrated IFN-β suppression of iNOS and IRF-1 gene transcription in mouse macrophages, associated with inhibition of STAT-1 activation and decreased tumor killing capacity (40). Activation of SOCS-3 and subsequent inhibition of the iNOS promoter may also be the mechanism responsible for making STAT-1-overexpressing INS-1 cells resistant to the toxic combination of IFN-γ and IL-1β (41). Interestingly, preincubation of rat and NOD islets with IFN-γ resulted in an increased iNOS expression in response to subsequent IL-1β exposure, which was associated with a prolonged activation of STAT-1 (42). This is consistent with our finding that IFN-γ signaling in rat islets may fail to induce a significant and long-lasting SOCS-3 expression and thus be unable to inhibit subsequent IL-1β signaling. Thus, preincubation with IFN-γ may in addition to activation and binding of STAT-1 to the GAS site in the iNOS promoter, induce expression of IRF-1, which through binding to IFN-stimulated response elements (ISRE) and interaction with NF-κB sites in the iNOS promoter would augment IL-1β-induced iNOS transcription (43, 44). Future studies will reveal whether IL-1β-induced SOCS-3 transcription and the inhibitory effect of SOCS-3 on the IL-1β-mediated iNOS promoter activity are direct effects of the IL-1β signaling cascade, or rather secondary effects of other IL-1β-induced gene products (e.g., IRF-1).
In contrast to the effect of IFN-γ, our data suggest that IL-1β may induce long-lasting expression of SOCS-3 in rat islets. IL-1β-induced SOCS-3 may be responsible for the significantly reduced IFN-γ-activated ICE transcription (7) through inhibition of the JAK/STAT pathway. The involvement of ICE and other caspases in the pathogenesis of Type-1 diabetes mellitus (T1DM) is not proven; nevertheless, the recent demonstration of sequential ICE and caspase-3 activation resulting in motor neuron death in familial amyotrophic lateral sclerosis, linked to a mutation in the gene encoding the free-radical-scavenging enzyme copper-zinc superoxide dismutase, is of interest (45, 46). In the mouse model of this disease, ICE activity induced by the oxidative stress may proceed caspase-3 activation and resulting cell destruction by several months, and the authors suggest that a complex neurodegenerative death process evolving over months to years may be involved in the human counterpart (46).
Several studies have addressed the possibility of increasing the defense status of the β-cells against the deleterious effects of cytokines [e.g., by overexpressing NO scavengers and free radical scavengers, antioxidant enzymes like glutathione peroxidase, Mn-superoxide dismutase, or catalase (47), or antiapoptotic proteins like bcl-2 (48) and A20 (49)]. Like in all other studies of cytokine-protective mechanisms, no single mechanism has hitherto proven useful in preventing the effect of strongly toxic cytokine concentrations or combinations. Nevertheless, the perspective of the present study is that inhibition of cytokine signaling at the most proximal step, namely at the receptor level of both IL-1β and IFN-γ, may prevent or reduce activation of the cascade of downstream devastating effects, and further studies should address this possibility (e.g., in animal models of diabetes and other autoimmune diseases).
Acknowledgments
We thank Susanne Munch, Rikke Bonne, and Birgitte Born for excellent technical assistance. This manuscript was supported in part by grants from the Danish Diabetes Association, Juvenile Diabetes Foundation International (no. 1-2000-658), The Sehested-Hansen Foundation, Novo Nordisk A/S, and the Danish Medical Research Council.
Abbreviations
- SOCS
suppressor of cytokine signaling
- IL-1β
interleukin-1β
- TNF-α
tumor necrosis factor α
- iNOS
inducible nitric oxide synthase
- NO
nitric oxide
- TBP
TATA-binding protein
- ICE
interleukin-1 converting enzyme
- GAS
gamma-activated sites
References
- 1.Mandrup-Poulsen T, Bendtzen K, Nerup J, Dinarello C A, Svenson M, Nielsen J H. Diabetologia. 1986;29:63–67. doi: 10.1007/BF02427283. [DOI] [PubMed] [Google Scholar]
- 2.Bendtzen K, Mandrup-Poulsen T, Nerup J, Nielsen J H, Dinarello C A, Svenson M. Science. 1986;232:1545–1547. doi: 10.1126/science.3086977. [DOI] [PubMed] [Google Scholar]
- 3.Mandrup-Poulsen T, Egebjerg J, Nerup J, Bendtzen K, Nielsen J, Dinarello C. Acta Pathol Microbiol Immunol Scand Sect C. 1987;95:55–63. doi: 10.1111/j.1699-0463.1987.tb00009.x. [DOI] [PubMed] [Google Scholar]
- 4.Nerup J, Mandrup-Poulsen T, Helqvist S, Andersen H U, Pociot F, Reimers J I, Cuartero B G, Karlsen A E, Bjerre U, Lorenzen T. In: New Horizons in Diabetes Mellitus and Cardiovascular Disease. Schwartz C J, Born G V R, editors. London: Science Press; 1995. pp. 57–63. [Google Scholar]
- 5.Eizirik D L, Flodström M, Karlsen A E, Welsh N. Diabetologia. 1996;39:875–890. doi: 10.1007/BF00403906. [DOI] [PubMed] [Google Scholar]
- 6.Delaney C A, Pavlovic D, Hoorens A, Pipeleers D G, Eizirik D L. Endocrinology. 1997;138:2610–2614. doi: 10.1210/endo.138.6.5204. [DOI] [PubMed] [Google Scholar]
- 7.Karlsen A E, Pavlovic D, Nielsen K, Jensen J, Andersen H U, Pociot F, Mandrup-Poulsen T, Eizirik D L, Nerup J. J Clin Endocrinol Metab. 2000;85:830–836. doi: 10.1210/jcem.85.2.6366. [DOI] [PubMed] [Google Scholar]
- 8.Mandrup-Poulsen T. Diabetologia. 1996;39:1005–1029. doi: 10.1007/BF00400649. [DOI] [PubMed] [Google Scholar]
- 9.Rabinovitch A. Diabetes Metab Rev. 1998;14:129–151. doi: 10.1002/(sici)1099-0895(199806)14:2<129::aid-dmr208>3.0.co;2-v. [DOI] [PubMed] [Google Scholar]
- 10.Kovanen P, Leonard W. Curr Biol. 1999;9:899–902. doi: 10.1016/s0960-9822(00)80079-2. [DOI] [PubMed] [Google Scholar]
- 11.Starr R, Willson T, Viney E, Merray J, Rayner J, Jenkins B, Gonda T, Alexander W, Metcalf D, Nicola N, Hilton D. Nature (London) 1997;387:917–921. doi: 10.1038/43206. [DOI] [PubMed] [Google Scholar]
- 12.Wang H, Iynedjian P. Proc Natl Acad Sci USA. 1997;94:4372–4377. doi: 10.1073/pnas.94.9.4372. [DOI] [PMC free article] [PubMed] [Google Scholar]
- 13.Brunstedt J, Nielsen J H, Lernmark Å The Hagedorn Study Group. In: Methods in Diabetes Research (Laboratory Methods, part C) Larner J, Pohl S L, editors. Vol. 1. New York: Wiley; 1984. pp. 254–288. [Google Scholar]
- 14.Andersen H U, Mauricio D, Karlsen A E, Mandrup-Poulsen T, Nielsen J H, Nerup J. Eur J Endocrinol. 1996;134:251–259. doi: 10.1530/eje.0.1340251. [DOI] [PubMed] [Google Scholar]
- 15.Karlsen A E, Fujimoto W Y, Rabinovitch P, Dube S, Lernmark Å. J Biol Chem. 1991;266:7542–7548. [PubMed] [Google Scholar]
- 16.Nielsen K, Karlsen A E, Deckert M, Madsen O D, Serup P, Mandrup-Poulsen T, Nerup J. Diabetes. 1999;48:2324–2332. doi: 10.2337/diabetes.48.12.2324. [DOI] [PubMed] [Google Scholar]
- 17.Wadt K A W, Larsen K M, Andersen H U, Nielsen K, Karlsen A E, Mandrup-Poulsen T. Diabetes. 1998;47:1602–1608. doi: 10.2337/diabetes.47.10.1602. [DOI] [PubMed] [Google Scholar]
- 18.Jensen J, Serup P, Karlsen C, Nielsen T F, Madsen O D. J Biol Chem. 1996;271:18749–18758. doi: 10.1074/jbc.271.31.18749. [DOI] [PubMed] [Google Scholar]
- 19.Møldrup A, Petersen E, Nielsen J. Endocrinology. 1993;133:1165–1172. doi: 10.1210/endo.133.3.8365359. [DOI] [PubMed] [Google Scholar]
- 20.Hansen L, Madsen B, Teisner B, Nielsen J, Billestrup N. Mol Endocrinol. 1998;12:1140–1149. doi: 10.1210/mend.12.8.0154. [DOI] [PubMed] [Google Scholar]
- 21.Mosmann T. J Immunol Methods. 1983;65:55–63. doi: 10.1016/0022-1759(83)90303-4. [DOI] [PubMed] [Google Scholar]
- 22.Marshall N J, Goodwin C J, Holt S J. Growth Regul. 1995;5:69–84. [PubMed] [Google Scholar]
- 23.Green I C, Wagner D A, Glogowski J, Skipper P L, Wishnok J S, Tannenbaum S R. Anal Biochem. 1982;126:131–138. doi: 10.1016/0003-2697(82)90118-x. [DOI] [PubMed] [Google Scholar]
- 24.Maechler P, Haiyen W, Wollheim C. FEBS Lett. 1998;422:328–332. doi: 10.1016/s0014-5793(97)01618-9. [DOI] [PubMed] [Google Scholar]
- 25.Darville M, Eizirik D. Diabetologia. 1998;41:1101–1108. doi: 10.1007/s001250051036. [DOI] [PubMed] [Google Scholar]
- 26.Mandrup-Poulsen T, Nerup J, Reimers J I, Pociot F, Andersen H U, Karlsen A E, Bjerre U, Bergholdt R. Eur J Endocrinol. 1995;133:660–671. doi: 10.1530/eje.0.1330660. [DOI] [PubMed] [Google Scholar]
- 27.Dinarello C A. Int Rev Immunol. 1998;16:457–499. doi: 10.3109/08830189809043005. [DOI] [PubMed] [Google Scholar]
- 28.Krebs D, Hilton D. J Cell Sci. 2000;113:2813–2819. doi: 10.1242/jcs.113.16.2813. [DOI] [PubMed] [Google Scholar]
- 29.Naka T, Fujimoto M, Morita Y, Kishimoto T. Int Cytokine Soc Newslett. 2000;8:1–10. [Google Scholar]
- 30.Rane S, Reddy E. Oncogene. 2000;19:5662–5679. doi: 10.1038/sj.onc.1203925. [DOI] [PubMed] [Google Scholar]
- 31.Emanuelli B, Peraldi P, Filloux C, Sawka-Verhelle D, Hilton D, Van Obberghen E. J Biol Chem. 2000;275:15985–15991. doi: 10.1074/jbc.275.21.15985. [DOI] [PubMed] [Google Scholar]
- 32.Hansen J, Lindberg K, Hilton D, Nielsen J, Billestrup N. Mol Endocrinol. 1999;13:1832–1843. doi: 10.1210/mend.13.11.0368. [DOI] [PubMed] [Google Scholar]
- 33.Dey B, Furlanetto R, Nissley P. Biochem Biophys Res Commun. 2000;278:38–43. doi: 10.1006/bbrc.2000.3762. [DOI] [PubMed] [Google Scholar]
- 34.Mabley J, Belin V, John N, Green I C. FEBS Lett. 1997;417:235–238. doi: 10.1016/s0014-5793(97)01291-x. [DOI] [PubMed] [Google Scholar]
- 35.Castrillo A, Bodelón O, Boscá L. Diabetes. 2000;49:209–217. doi: 10.2337/diabetes.49.2.209. [DOI] [PubMed] [Google Scholar]
- 36.Rieneck K, Bovin L, Josefsen K, Buschard K, Svenson M, Bendtzen K. APMIS. 2000;108:855–872. doi: 10.1111/j.1600-0463.2000.tb00009.x. [DOI] [PubMed] [Google Scholar]
- 37.Paul C, Seiliez I, Thissen J, Le Cam A. Eur J Biochem. 2000;267:5849–5857. doi: 10.1046/j.1432-1327.2000.01395.x. [DOI] [PubMed] [Google Scholar]
- 38.Ogle C, Kong F, Guo X, Wells D, Aosasa S, Noel G, Horseman N. Shock. 2000;14:392–398. [PubMed] [Google Scholar]
- 39.Magrangeas F, Bioisteau O, Denis S, Jacques Y, Minvielle S. Biochem J. 2001;353:223–230. doi: 10.1042/0264-6021:3530223. [DOI] [PMC free article] [PubMed] [Google Scholar]
- 40.Gao J, Filla M, Lorsbach R, Pace J, Crespo A, Russell S, Murphy W. Eur J Immunol. 2000;30:1551–1561. doi: 10.1002/1521-4141(200006)30:6<1551::AID-IMMU1551>3.0.CO;2-Y. [DOI] [PubMed] [Google Scholar]
- 41.Chen G, Hohmeier H, Newgard C. J Biol Chem. 2001;276:766–772. doi: 10.1074/jbc.M008330200. [DOI] [PubMed] [Google Scholar]
- 42.Heitmeier M, Scarim A, Corbett J. J Biol Chem. 1999;274:29266–29273. doi: 10.1074/jbc.274.41.29266. [DOI] [PubMed] [Google Scholar]
- 43.Flodström M, Eizirik D. Endocrinology. 1997;138:2747–2753. doi: 10.1210/endo.138.7.5286. [DOI] [PubMed] [Google Scholar]
- 44.Saura M, Zaragoza C, Bao C, McMillan A, Lowenstein C. J Mol Biol. 1999;289:459–471. doi: 10.1006/jmbi.1999.2752. [DOI] [PubMed] [Google Scholar]
- 45.Li M, Ona V, Guegan C, Chen M, Jackson-Lewis V, Andrews L, Olszewski A, Stieg P, Lee J-P, Przedborski S, Friedlander R. Science. 2000;288:335–339. doi: 10.1126/science.288.5464.335. [DOI] [PubMed] [Google Scholar]
- 46.Pasinelli P, Houseweart M, Brown R, Jr, Cleveland D. Proc Natl Acad Sci USA. 2000;97:13901–13906. doi: 10.1073/pnas.240305897. . (First Published November 28, 2000; 10.1073/pnas.240305897) [DOI] [PMC free article] [PubMed] [Google Scholar]
- 47.Lortz S, Tiedge M, Nachtwey T, Karlsen A, Nerup J, Lenzen S. Diabetes. 2000;49:1123–1130. doi: 10.2337/diabetes.49.7.1123. [DOI] [PubMed] [Google Scholar]
- 48.Rabinovitch A, Suarez-Pinzon W, Strynadka K, Ju Q, Edelstein D, Brownlee M, Korbutt G S, Rajotte R V. Diabetes. 1999;48:1223–1229. doi: 10.2337/diabetes.48.6.1223. [DOI] [PubMed] [Google Scholar]
- 49.Grey S, Avelo M, Hasenkamp W, Bach F, Ferran C. J Exp Med. 1999;190:1135–1145. doi: 10.1084/jem.190.8.1135. [DOI] [PMC free article] [PubMed] [Google Scholar]


